ISSN 0104-6632 Printed in Brazil
www.abeq.org.br/bjche
Vol. 30, No. 01, pp. 133 - 140, January - March, 2013
Brazilian Journal
of Chemical
Engineering
SEPTIC TANK COMBINED WITH ANAEROBIC
FILTER AND CONVENTIONAL UASB – RESULTS
FROM FULL SCALE PLANTS
F. J. A. da Silva
1*, M. G. S. Lima
1, L. A. R. Mendonça
1and M. J. T. L. Gomes
11Department of Civil Engineering, Federal University of Ceará, Campus Cariri,
Av. Ten. Raimundo Rocha s/n, 63040-360, Juazeiro do Norte - CE, Brazil. E-mail: [email protected]
(Submitted: January 23, 2012 ; Revised: April 17, 2012 ; Accepted: May 3, 2012)
Abstract - Anaerobic digestion is an important alternative for domestic wastewater treatment, especially in warm climate regions. Two full-scale anaerobic schemes were investigated: septic tank combined with anaerobic filter (STANF) and conventional UASB reactors. Treated effluents from these systems were subjected to disinfection by
chlorination. The operational performance of 56 full-scale plants (36 STANF and 20 UASB) provided a realistic
view. Findings showed that the plants operated with low OLR (< 2.0 kg COD/m3.day). Despite this, the removal of organic material was below values suggested by the literature (around 60% for COD). A removal of 4.0 Log10
units of total coliform and E. coli can bereached with residual chlorine (RCL) of at least 2.0 Cl-Cl2/l. Although
UASB plants have performed better, improvement of maintenance is needed in both treatment configurations.
Keywords: Anaerobic treatment; Low-cost technology; Performance comparison.
INTRODUCTION
Technologies for municipal wastewater treatment are diverse with respect to configuration, performance and complexity. Advanced technologies achieve high pollutant removal, but impose economical and technical restrictions. In this sense, the adoption of low-cost technologies for low-income communities is a necessity. These technologies are particularly interesting for densely populated urban and suburban areas in developing countries, where complex socioeconomic inequalities are more evident. This imbalance is also related to the availability of appropriate wastewater infrastructure (i.e. collection and treatment). When existent, these wastewater systems are usually unreliable and deficiencies are quite noticeable (Oliveira et al., 2006; Muga and Mihelcic, 2008).
The benefits of wastewater systems are clearly recognized. They improve human health and protect
the environment. However, their expansion and universalization in developing countries should be a gradual process. Also, evolution of efficiency should assure an acceptable level of health safety combined with the concept of sustainable technology (von Sperling and Chernicharo, 2002). Within this context, anaerobic systems are very attractive due to low capital cost, operational simplicity and low production of solids. In countries like Brazil, anaerobic digestion for wastewater treatment is favored by the predominance of a warm climate.
The Brazilian Engineering Standards considered the use of septic tanks in 1963. The subsequent standards (NBR 7229/1982 and 1993) emphasized the need for reducing the organic content remaining in effluents from septic tanks by means of upflow anaerobic filters. The combination of septic tanks with upflow anaerobic filters (STANF) was considered as a temporary solution for wastewater treatment in low density urban areas. However, the reality of sanitary infrastructure in the country did not allow adoption of more efficient systems. Probably this is why septic tanks combined with anaerobic filters (STANF) became a widespread community system for domestic wastewater treatment in Brazil (Kamiyama, 1993; Oliveira et al., 2006). Regarding this, Massoud
et al. (2009) point out that indiscriminate use of low-cost technology aims to avoid excessive low-costs required by large centralized structures.
In Brazil the research on UASB technology begun during the second half of the 1980s and stemmed from the seminal paper by Lettinga et al. (1980). Although the UASB reactor had been conceived for wastewaters with high organic content, later discussions recommended its application for domestic wastewater treatment (van Haandel et al., 2006). Presently, the UASB concept is used to treat many types of wastewaters (e.g., Silva et al., 2011; Firmino et al., 2011) and reviews on its use in tropical countries can be found in Foresti (2002) and Lettinga (2011).
Compared to other anaerobic reactors the active sludge biomass in UASB reactors provides higher performance. This technology has been presented as equivalent to a secondary treatment. However, many of the results reported come from experimental and pilot scale studies, in which influent characteristics are fairly well controlled (e.g., Banu et al., 2007; Elmitwalli and Otterpohl, 2007; Paula Jr. and Foresti, 2009; Chelliapan et al., 2011).
Anaerobic systems are designed for the removal of organic material and their effluents require post-treatment, at least for pathogen removal. Effluent chlorination is an alternative widely employed due to its technological and economic viability (Wang, 2007). In general, disinfection is performed with chlorine as either sodium hypochlorite or calcium hypochlorite (WEF, 1996). Nevertheless, it is important to remember that chemical disinfectants potentially result in byproducts that pose direct or indirect health risks (Chernicharo, 2006; Debord and von Gunten, 2008).
As comparisons and discussions are required for technological evolution, this paper addresses a comparative evaluation between these two anaerobic
schemes (UASB and STANF) and provides a more realistic view of their applications.
MATERIALS AND METHODS
A survey was conducted to provide a profile on the technologies used to treat domestic wastewater in Ceará state (2°46’20”-7°52’15” S; 37°14’50”- 41°24’45” W), Northeastern Brazil. The population of Ceará state is approximately 8.5 million with 75% residing in urban areas. Onsite systems are the treatment solution for 58% of the urban population. The most urbanized area is the Metropolitan Region of Fortaleza (3º 43' S; 38º 32' W) that comprises 15 municipalities and a population of 3.6 million. About 39% of this population is served by complete sewerage systems (IPECE, 2010).
There were 256 treatment plants for municipal wastewater in urban areas of Ceará state at the beginning of 2011. The population served ranged from 120 to 150,000 inhabitants. The most employed technologies were waste stabilization ponds (90 plants) and plants comprised exclusively of anaerobic reactors followed by chlorination (113 STANF and 41 UASB). The remaining plants were constituted by activated sludge systems and UASB hybrid systems.
After this initial survey, fifty six treatment plants based on anaerobic digestion were selected for the study. Among these plants 36 were comprised by septic tanks followed by anaerobic filters (STANF) and 20 by UASB reactors. The criteria for plant selection were: availability of reliable design information, performance of regular maintenance, and in operation for at least five years. All plants were located in the Metropolitan Region of Fortaleza. They were built in areas with limited space, mainly housing estates and where slum urbanization interventions occurred.
The final effluent of each plant was subjected to chlorination via sodium hypochlorite solution and contact time of 30 minutes.
During one year 11 (±1) grab samples of raw wastewater and treated effluent were taken from each plant and collected around 10:00 am. This procedure followed the Standard Operating Procedures (SOP) provided by the water and wastewater company responsible for the plants. Influent wastewater was collected just after the preliminary treatment unit (screening and grit removal). However, 21 of the STANF plants did not have this structure. The samples of treated effluents from all plants were collected at two points: before and after the contact tank for disinfection.
The raw wastewater and treated effluent collected before the chlorination tank had the following parameters analyzed: pH, chemical oxygen demand (COD), total suspended solids (TSS), settleable solids (SSL), turbidity (Turb) and oil and grease (O&G). The effluents leaving the contact tank (i.e., after chlorination) were analyzed for total coliform (TC), Escherichia coli (E. coli) and residual chlorine (RCL). Ambient and sample temperatures were determined in loco. All analytical procedures followed the methods described in APHA (1998). The flow rate (q) was estimated as 80% of the water consumption measurements provided by the company responsible for water and wastewater services.
RESULTS AND DISCUSSION
The average temperature for both influent and effluent of any of the treatment schemes was 31.0 °C (±1) and reflected the warm climate in the region (mean temperature of 26.7 °C ±0.6).
Initially the results were grouped according to each anaerobic scheme as shown in Tables 1 and 2. In the STANF plants the influent COD, TSS, SSL and turbidity were stronger than in UASB plants. This was verified by standard parametric t-test for large samples (at α = 0.05) and non-parametric Kolmogorov-Smirnov test. For other parameters there was no significant difference in variance. For bacterial densities the statistical analysis required data transformation (Log10).
The normality of grouped data was suggested by the variation coefficient of (for CV ≤ 0.5), parametric
F-test (one-way analysis of variance) and non-parametric tests of Kolmogorov-Smirnov and Lilliefors. However, data transformation provided a closer approximation to lognormal distribution. As reported by Berthouex and Hunter (1983) and McBean and Rovers (1998), in most cases the lognormal distribution is more representative. These authors highlight that normal distribution does not offer feasible numbers due to the negative values for such assumptions. Despite this, for both inffluent and effluent, data transformation of COD, TSS, SSL, TSS and turbidity did not offer a conclusive answer for lognormal fitness.
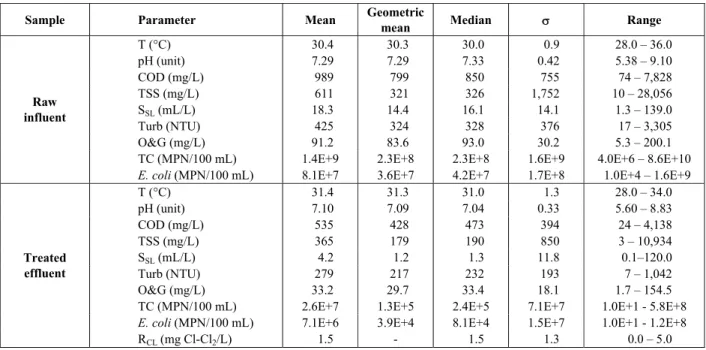
Table 1: Descriptive statistics of STANF plants monitoring (grouped results).
Sample Parameter Mean Geometric
mean Median σ Range
T (°C) 30.4 30.3 30.0 0.9 28.0 – 36.0
pH (unit) 7.29 7.29 7.33 0.42 5.38 – 9.10
COD (mg/L) 989 799 850 755 74 – 7,828
TSS (mg/L) 611 321 326 1,752 10 – 28,056
SSL(mL/L) 18.3 14.4 16.1 14.1 1.3 – 139.0
Turb (NTU) 425 324 328 376 17 – 3,305
O&G (mg/L) 91.2 83.6 93.0 30.2 5.3 – 200.1 TC (MPN/100 mL) 1.4E+9 2.3E+8 2.3E+8 1.6E+9 4.0E+6 – 8.6E+10 Raw
influent
E. coli (MPN/100 mL) 8.1E+7 3.6E+7 4.2E+7 1.7E+8 1.0E+4 – 1.6E+9
T (°C) 31.4 31.3 31.0 1.3 28.0 – 34.0
pH (unit) 7.10 7.09 7.04 0.33 5.60 – 8.83
COD (mg/L) 535 428 473 394 24 – 4,138
TSS (mg/L) 365 179 190 850 3 – 10,934
SSL(mL/L) 4.2 1.2 1.3 11.8 0.1–120.0
Turb (NTU) 279 217 232 193 7 – 1,042
O&G (mg/L) 33.2 29.7 33.4 18.1 1.7 – 154.5 TC (MPN/100 mL) 2.6E+7 1.3E+5 2.4E+5 7.1E+7 1.0E+1 - 5.8E+8
E. coli (MPN/100 mL) 7.1E+6 3.9E+4 8.1E+4 1.5E+7 1.0E+1 - 1.2E+8 Treated
effluent
Table 2: Descriptive statistics of UASB plant monitoring (grouped results).
Sample Parameter Mean Geometric
mean Median σ Range
T (°C) 30.4 30.4 30.0 0.8 29.0 – 33.0
pH (unit) 7.33 7.32 7.31 0.36 5.87 – 8.80
COD (mg/L) 818 748 811 316 102 – 2,075
TSS (mg/L) 399 306 314 482 16 – 5,737
SSL (mL/L) 14.7 13.7 15.0 4.7 2.0 – 338
Turb (NTU) 390 316 343 543 22 – 8,331
O&G (mg/L) 90.0 85.0 90.6 27.8 17.8 – 334.0 TC (MPN/100 mL) 1.2E+9 2.1E+8 2.2E+8 6.4E+9 3.5E+6 – 8.6E+10 Raw
influent
E. coli (MPN/100 mL) 1.1E+8 4.5E+7 4.3E+7 2.4E+8 7.2E+5 – 2.4E+9
T (°C) 30.9 30.8 31.0 1.6 31.0 – 34.0
pH (unit) 7.11 7.08 7.02 0.54 5.05 – 9.13
COD (mg/L) 338 277 283 224 25 – 1,333
TSS (mg/L) 213 128 132 621 30 – 9,513
SSL(mL/L) 1.6 1.0 0.9 1.8 < 0.1 – 11.0
Turb (NTU) 195 154 152 148 13 – 1,126
O&G (mg/L) 37.7 19.8 21.8 60.1 2.0 – 204.5 TC (MPN/100 mL) 1.0E+7 8.5E+3 1.7E+4 2.6E+7 1 – 2.3E+8
E. coli (MPN/100 mL) 3.7E+6 7.6E+3 2.4E+3 8.0E+6 1 – 4.1E+7
Treated effluent
RCL (mg Cl-Cl2/L) 2.1 - 2.5 1.2 0.0 – 5.0
A possible explanation for STANF plants present stronger influent is that most of them did not have a preliminary treatment unit. Also, many of the STANF plants were buried structures with access only at the ground level and this impose a certain difficulty for maintenance. Eventhough, there was no significant difference (at 0.05 level) in STANF influents, with respect to the existence of preliminar treatment.
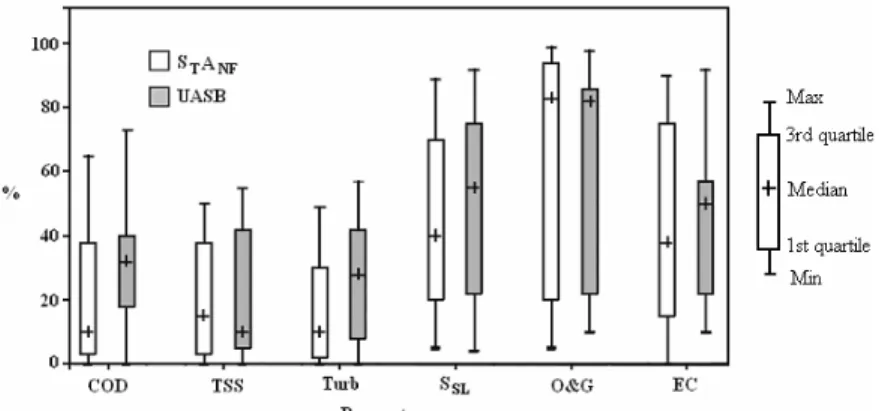
For grouped results, effluents from STANF plants showed higher concentrations compared to UASB. Considering only mean values the differences were more significant for TC, E. coli, COD, TSS and O&G. The effluents from the anaerobic schemes were also analyzed with respect to the compliance with discharge limits established by SEMACE
(2002), the local environmental statutes. The parameters and limits used as reference were: COD (200 mg/L), TSS (50 mg/L), turbidity (100 NTU), SSL (1.0 mL/L), O&G (70 mg/L) and E. coli (5.0x10³ MPN/100mL). The percentages of compliance with respect to the above limits are shown in Figure 1. The UASB plants performed better for COD, turbidity, settleable solids and E. coli, while STANF showed slightly higher numbers for TSS and oil and grease.
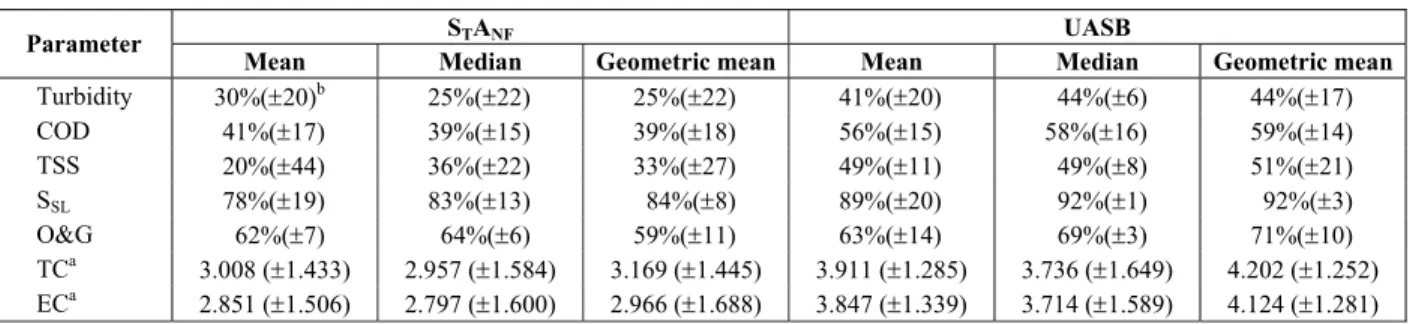
Individual analysis on the performance of the plants also revealed that UASB plants were better than STANF plants. By comparing basic central tendency measures, Table 3 shows a summary of pollutant removal and mean deviations relative to the performance of both plant types.
Table 3: Comparative performance of STANF and UASB plants.
STANF UASB
Parameter
Mean Median Geometric mean Mean Median Geometric mean
Turbidity 30%(±20)b 25%(±22) 25%(±22) 41%(±20) 44%(±6) 44%(±17)
COD 41%(±17) 39%(±15) 39%(±18) 56%(±15) 58%(±16) 59%(±14) TSS 20%(±44) 36%(±22) 33%(±27) 49%(±11) 49%(±8) 51%(±21)
SSL 78%(±19) 83%(±13) 84%(±8) 89%(±20) 92%(±1) 92%(±3)
O&G 62%(±7) 64%(±6) 59%(±11) 63%(±14) 69%(±3) 71%(±10) TCa 3.008 (±1.433) 2.957 (±1.584) 3.169 (±1.445) 3.911 (±1.285) 3.736 (±1.649) 4.202 (±1.252) ECa 2.851 (±1.506) 2.797 (±1.600) 2.966 (±1.688) 3.847 (±1.339) 3.714 (±1.589) 4.124 (±1.281)
a
Log10 unit removal; b mean deviation of the performance.
In general, the efficiency of removal of organic material (COD and TSS) in the two anaerobic treatment configurations was lower than that reported in the literature. In UASB reactors the removal was below expectations even considering the lower limits. Chernicharo (2006) reports typical TSS removal ranging from 65% to 80% and COD removal from 55% to 70%.
In these systems lower efficiency may occur due to low flow rate fluctuations during the night, when solids of the sludge blanket tend to settle, with a decrease in mixing with the influent. Also, peak flows may drag upper sludge layers upward. This, combined with the release of biogas to the water bulk, may cause an increase in concentrations of TSS in the effluent. Lower efficiency is also caused by the accumulation of scum in the liquid/biogas interface, with reduction in the regular release of biogas in this interface. Leitão et al. (2006) highlight that fluctuations in wastewater (hydraulic and composition) affect the performance of reactors. This may cause an imbalance among metabolic groups of microorganisms involved in the treatment.
Numbers for STANF performance were even worse. In the Brazilian Engineering Standard NBR 13969 (ABNT, 1997) estimates for TSS removal range from 60% to 90% and for COD from 40% to 70%.
Only 17% of the STANF plants reached an average COD removal of 60%. For this same level of treatment, 60% of the UASB plants performed similarly. Also, assuming a removal of 60% for TSS, only 28% of the STANF plants achieved this figure, compared to 40% in UASB plants. The STANF plants also showed higher variability in performance compared to UASB plants, as indicated by the statistics of central tendency and mean deviation shown in Table 3.
Septic tanks perform as primary treatment systems with COD removal ranging from 30 to 50%
(van Haandel et al., 2006). The release of biogas from sludge at the bottom of the tank enhances contact between the bacterial biomass and organic material in the influent. However, this may have a negative effect with flotation of solids and eventual discharge in the effluent. For this reason, it is recommended that the effluents from steptic tanks be subject to a further treatment to reduce concentra-tions of COD and TSS. However, results from STANF plants suggest that filtering material was clogged. Clogging occurs with continued operation and the sloughed biomass in upflow anaerobic filter accumulates in the bottom portion (Jawed and Tare, 2000). Also, part of the biomass that grows on the fixed media is incorporated into the suspended solids in the effluent because of shear stress caused by the water flow. Bodkhe (2008) stresses that an efficient removal of solids prior to entering the anaerobic filter can minimize clogging. Thus, the effectiveness of the combined system strongly relies on the adequate performance of the septic tank.
The flow rate variation (q) in the plants was around 78% of the mean value. Estimates showed a per caput contribution of 83 l/day. This value was lower than that assumed in the original designs (150 L/caput.day). The mean HRT in STANF systems was 2.16 days (ranging from 1.20 to 8.50 days). For this computation the rock media volume in the anaerobic filter was discounted. In UASB plants the mean HRT was 0.47 days and ranged from 0.27 to 1.89 days.
The applied volumetric organic loadings as COD (OLR), and as total suspended solids (TSSLR), are presented in Table 4. This table also shows the operational surface (Sr =q[ (Co−C)] A rea) and
Table 4: Organic loading and removal rates (surface and volumetric) in the anaerobic systems.
Sr
(kg/m2.day)
Vr
(kg/m3.day) Plant
type
OLR (kg/m3.day)
TSSLR
(g/m3.day)
COD TSS COD TSS
STANF
0.37 (0.15 - 0.68)
0.23 (0.07 - 1.12)
0.28 (0.08 - 0.50)
0.15 (0.04 - 0.28)
0.17 (0.04 - 0.30)
0.09 (0.02 - 0.16)
UASB 1.70 (0.78 - 2.14)
0.81 (0.39 - 1.77)
5.34 (1.32 - 9.37)
1.30 (0.32 - 2.04)
0.96 (0.24 - 1.71)
0.24 (0.06 - 0.42)
Effluent samples with no RCL (i.e., non-chlo-rinated) were 36% in STANF systems and 13% in UASB. Total coliform and E. coli densities in non-chlorinated effluents were not significantly different in both configurations (at the 5% level of signifi-cance). In non-disinfected effluents the average removals of TC and EC in STANF plants were 1.146 and 0.956 Log10 units, respectively. In UASB plants the average removals were 1.464 and 1.011 Log10 units for TC and EC.
In raw wastewater the differences in statistical variances were high and p-values were < 0.001 compared to treated effluent, in which p-values were closer to α (0.05). In disinfected effluents the bacterial densities were not significantly different, though UASB plants showed lower counts. This is explained by a higher variance of RCL concentration in STANF effluents. As shown in Table 2, the RCL concentration in STANF effluents had a lower mean value.
In effluents with residual chlorine there was a statistical correlation between total coliform and
E. coli removal (r = 0.9439, α = 0.05). E. coli removed (Log10 units) represented about 90% of the TC removed.
Analysis of variance showed that values of RCL ≥ 1.0 mg Cl-Cl2/L imposed a significant reduction in coliform numbers, with a greater difference for
E. coli (p = 9.8E-4). Effluents with RCL ≥ 1.0 mg Cl-Cl2/L were present in 59% of the samples from STANF systems and 82% of the samples from UASB systems. Comparing removals of CT e E. coli for RCL ranging from 1.0 to 2.0 mg Cl-Cl2/L, the ANOVA p values were 0.0222 and 0.0084, respectively.
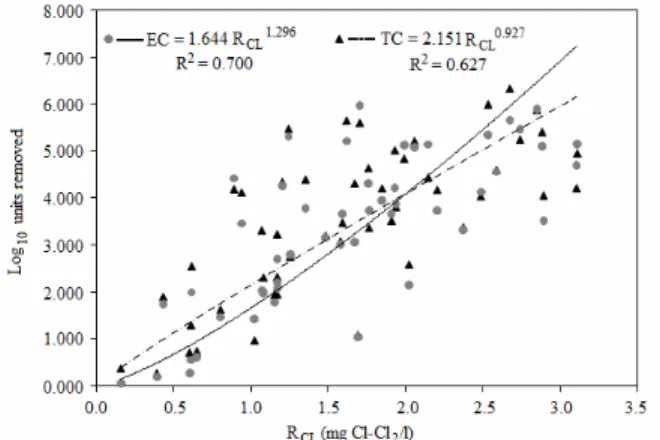
Figure 2 indicates that a concentration of 2.0 mg Cl-Cl2/L of RCL can provide a removal of 4.0 Log10 units of TC and E. coli (EC). However, it is important to minimize dispersion in RCL concentra-tions (i.e., maintain the CV as low as possible). A Monte Carlo simulation was applied to the removal observed in the present study and the results showed a risk of failure of 22 and 27%, for TC and E. coli, respectively. Increasing minimal RCL to 2.5 and 2.8 mg Cl-Cl2/l and considering only E. coli the simulation
resulted in a risk of failure of 10 and 8%, respectively. This approach was performed according to the guidelines of EPA (1997).
Figure 2: Removal of TC and EC (Log10 units) as a function of RCL (all plants grouped).
WEF (1996) and Chernicharo (2006) suggest that RCL concentrations should range from 1 to 3 mg Cl-Cl2/L in order to reach an adequate treatment. However, chlorine in solution changes with time, mainly during the mixture, when it undergoes rapid transformation. According to a number of studies (e.g., Narkis et al., 1995; Helbling and Vanbriesen, 2007; Winward et al., 2008) the organic content in water interacts with chlorine and prevents its action as disinfectant. Nevertheless, COD, TSS and SSL concentrations did not show any noticeable correlation with bacterial numbers or their removal in the treatment systems (at α = 0.05).
Although UASB reactors performed better, the STANF plants appeared to receive less attention in terms of maintenance. In fact, as a whole, all plants need better control practices. The need for proper maintenance is evidenced by bacterial removal variation and peaks in COD, TSS and SSL concentrations in the treated effluents.
of the sludge layer should be monitored. Broadly speaking the sludge layer should be kept at one third of the tank depth. The anaerobic filters require removal of excess biofilm attached to the media.
CONCLUSIONS
In the year 2011, in Ceará state, Northeast Brazil two anaerobic configurations (septic tanks combined with anaerobic filters - STANF and conventional UASB reactors) represented 60% of the community systems in the treatment of domestic wastewater. These plant schemes operated with low OLR (0.37 kg COD/m3.day for STANF and 1.70 kg COD/m
3
.day for UASB). Regardless of the low loading, the overall efficiency and organic removal rates were below numbers reported in the literature.
In UASB plants the volumetric (0.96 kg COD/m3.day) and surface (5.34 kg COD/m2.day) removal rates were, respectively, 5.6 and 19.1 times the value achieved by STANF plants. Thus, comparitively, the removal rates were quite distinct and reflected the differences between the two concepts. Also, effluents from UASB plants had higher compliance rates regarding environmental regulatory standards.
Concentrations of total coliform and E. coli in non-disinfected effluents of both types of treatment were not significantly different. That said, UASB performed slightly better. With respect to disinfected effluents a minimum concentration of residual chlorine (RCL) of 2.0 Cl-Cl2 /l was necessary to reach a removal of 4.0 Log10 units. However, fluctuations in RCL should be minimized in order to achieve a more dependable performance. E. coli represented 90% of the total coliform densities in the treated effluents.
Although the performance of conventional UASB plants was superior, the results suggest that operational attention (i.e., maintenance) has been neglected, especially in STANF plants. Apparently, the increasing interest in UASB has engendered care-lessness with regards to STANF plants. There is a need for increasing investments to improve maintenance and operation, including personnel training.
REFERENCES
ABNT, Associação Brasileira de Normas Técnicas. Projeto, construção e operação de sistemas de tanques sépticos: NBR 7229. Rio de Janeiro (1993). (In Portuguese).
ABNT, Associação Brasileira de Normas Técnicas. Rio de Janeiro. Projeto, construção e operação de unidades de tratamento complementar e disposi-ção final dos efluentes líquidos de tanques sépticos: NBR 13969. (1997). (In Portuguese). APHA, Standard Methods for the Examination of
Water and Wastewater, Twentieth Ed. American Public Health Association, American Water Works Association, Water Environmental Federation, New York (1998).
Azevedo Netto, J. M., Tanques sépticos: Conheci-mentos atuais. Revista Engenharia Sanitária, 24, 222-229 (1985). (In Portuguese).
Banu, J. R., Kaliappan, S., Yeom, I. T., Treatment of domestic wastewater using upflow anaerobic sludge blanket reactor. International Journal of Environmental Science and Technology, 4, 363-370 (2007).
Berthouex, P. M., Hunter, W. G., How to construct reference distributions to evaluate treatment plant effluent quality. Journal of the Water Pollution Control Federation, 55, 1417-1424 (1983).
Bodkhe, S., Development of an improved anaerobic filter for municipal wastewater treatment. Bioresource Technology, 99, 222-226 (2008). Chelliapan, S., Wilby, T., Sallis, P. J., Effect of
hydraulic retention time on up-flow anaerobic stage reactor performance at constant loading in the presence of antibiotic tylosin. Brazilian Journal of Chemical Engineering, 28, 51-61 (2011). Chernicharro, C. A. L., Post-treatment options for the
anaerobic treatment of domestic wastewater. Reviews in Environmental Science and Bio/ Technology, 5, 73-92 (2006).
Deborde, M., von Gunten, U., Reactions of chlorine with inorganic and organic compounds during water treatment - kinetics and mechanisms: A critical review. Water Research, 42, 13-51 (2008). Elmitwalli, T. A., Otterpohl, R., Anaerobic
biode-gradability and treatment of grey water in upflow anaerobic sludge blanket (UASB) reactor. Water Research, 41, 1379-1387 (2007).
EPA, Guiding principles for Monte Carlo analysis. Technical Panel. Risk Assessment Forum. U.S. Environmental Protection Agency. Washington, March (1997).
Firmino, P. I. M., Silva, M. E. R., Mota, F. S. B., dos Santos, A. B., Applicability of anthraquinone-2,6-disulfonate (AQDS) to enhance colour removal in mesophilic UASB reactors treating textile wastewater. Brazilian Journal of Chemical Engi-neering, 28, 617-623 (2011).
Science and Technology, 45, 181-186 (2002). Helbling, D. E., Vanbriesen, J. M., Free chlorine
demand and cell survival of microbial suspensions. Water Research, 41, 4424-4434 (2007).
IPECE, Anuário estatístico do Ceará. Secretaria do Planejamento e Gestão, Instituto de Pesquisa e Estratégia Econômica do Ceará, Fortaleza (2010). (In Portuguese).
Jawed, M., Tare, V., Post-mortem examination and analysis of anaerobic filters. Bioresource Techno-logy, 72, 75-84 (2000).
Kamiyama, H., Revisão e aperfeiçoamento do sistema tanque séptico-filtro anaeróbio para tratamento de esgoto (Parte I). Revista DAE, 53, 9-17 (1993). (In Portuguese).
Leitão, R. C., van Haandel, A. C., Zeeman, G., Lettinga, G., The effects of operational and environmental variations on anaerobic wastewater treatment systems: A review. Bioresource Technology, 97, 1105-1118 (2006).
Lettinga, G., The Route of Anaerobic Waste (Water) Treatment Toward Global Acceptance. In: Fang, H. H. P. (Editor), Environmental Anaerobic Tech-nology - Applications and New Developments, Chapter 1, pp. 1-15. World Scientific Publishing Co. Pte. Ltd, London (2011).
Lettinga, G., van Velsen, A. F. M., Hobma, S. W., de Zeeuw, W. E., Klapwijk, A., Use of upflow sludge blanket (USB) reactor concept for biological wastewater treatment, especially for anaerobic treatment. Biotechnology and Bioengineering, 22, 699-734 (1980).
Massoud, M. A., Tarhini, A., Nasr, J. A., Decentralized approaches to wastewater treatment and manage-ment: Applicability in developing countries. Journal of Environmental Management, 90, 652-659 (2009).
McBean, E. A., Rovers, F. A., Statistical Procedures for Analysis of Environmental Monitoring Data & Risk Assessment. Environmental Management & Engineering Series, Vol. 3, Prentice-Hall PTR, New Jersey (1998).
Muga, H. E., Mihelcic, J. R., Sustainability of wastewater treatment technologies. Journal of Environmental Management, 88, 437-447 (2008). Narkis, N., Armon, R., Offer, R., Orshansky, F.,
Friedland, E., Effect of suspended solids on wastewater disinfection efficiency by chlorine dioxide. Water Research, 29, 227-236 (1995).
Oliveira, S. M. A. C., Parkinson, J. N., von Sperling, M., Wastewater treatment in Brazil: Institutional framework, recent initiatives and actual plant performance. International Journal of Technology Management & Sustainable Development, 5, 241-256 (2006).
Paula Jr., D. R., Foresti, E., Sulfide toxicity kinetics of a UASB reactor. Brazilian Journal of Chemical Engineering, 26, 669-675 (2009).
Raman, V., Chakladar, N., Upflow filters for septic tank effluents. Journal of the Water Pollution Control Federation, 44, 1552-1560 (1972).
SEMACE, Dispõe sobre padrões e condições de lançamento de efluentes líquidos gerados por fontes poluidoras. Portaria 154. Superintendência Estadual do Meio Ambiente. Diário Oficial do Estado - DOE, Série 2, Ano 5, no 187, Fortaleza (2002). (In Portuguese).
Silva, A. J., Domingues, M. R., Hirasawa, J. S, Varesche, M. B. Foresti, E., Zaiat, M., Kinetic modeling and microbial assessment by fluorescent
in situ hybridization in anaerobic sequencing batch biofilm reactors treating sulfate-rich wastewater. Brazilian Journal of Chemical Engineering, 28, 209-219 (2011).
Van Haandel, A., Kato, M. T., Cavalcanti, P. F. F., Florêncio, L., Anaerobic reactor design concepts for the treatment of domestic wastewater. Reviews in Environmental Science and Bio/ Technology, 5, 21-38 (2006).
Von Sperling, M., Chernicharo, C. A. L., Urban wastewater treatment technologies and the imple-mentation of discharge standards in developing countries. Urban Water, 4, 105-144 (2002). Wang, L. W., Waste chlorination and stabilization.
In: L. K. Wang, L.K., Hung, Y.-T., Shammas, N.K. (Eds.) Handbook of Environmental Engineering - Advanced Physicochemical Treatment Processes. Volume 4, Chapter 12, pp. 403-440. The Humana Press Inc., Totowa, NJ (2007).
WEF, Wastewater Disinfection, Manual of Practice, FD-10. Water Environment Federation, Alexandria (1996).
Winward, G. P., Avery, L. M., Stephenson, T., Jefferson, B., Chlorine disinfection of grey water for reuse: Effect of organics and particles. Water Research, 42, 483-491 (2008).