ISSN 0104-6632 Printed in Brazil
www.abeq.org.br/bjche
Vol. 33, No. 04, pp. 1063 - 1071, October - December, 2016 dx.doi.org/10.1590/0104-6632.20160334s20150103
*To whom correspondence should be addressed
Brazilian Journal
of Chemical
Engineering
CHARACTERIZATION AND EVALUATION OF
WAXY CRUDE OIL FLOW
G. B. Tarantino, L. C. Vieira, S. B. Pinheiro, S. Mattedi, L. C. L. Santos,
C. A. M. Pires, L. M. N. Góis
*and P. C. S. Santos
Universidade Federal da Bahia, Escola Politécnica, Departamento de Engenharia Química. Rua Aristides Novis, 02, 3° Andar, Federação, CEP 40210-630, Salvador - BA, Brazil.
Phone: + 55 71 3283-9464 E-mail: [email protected]
(Submitted: February 22, 2012 ; Revised: May 28, 2015 ; Accepted: July 16, 2015)
Abstract - Part of the oil found in the Brazilian subsoil has a high wax content, which makes its flow process difficult at low temperatures because of the increase in the viscosity of the fluid. This paper studied the flow behavior of waxy crude oil under variation in the temperature of the external environment of the flow, the volumetric flow rate of the oil and the emulsified water content of the oil. The results were compared with those obtained for a non-waxy crude oil that had similar rheological properties at temperatures above the wax appearance temperature (WAT). The proposed tests were based on the experimental design technique, and the behavior of the fluids was evaluated based on the pressure variation generated by the flow.
Keywords: Waxy crude oil; Pressure variation; Crystallization.
INTRODUCTION
Paraffinization is one of the main problems in oil production and causes considerable losses to the oil industry. The wax precipitation phenomenon associ-ated with paraffin deposition can result in unsched-uled production shutdowns and promote operational risk conditions. Moreover, it can cause production losses and irreparable damage to equipment (Pauly et al., 2004).
In the Bahian Recôncavo region, the produced crude oil exhibits a density of approximately 30° API, almost no sulfur and high concentrations of dis-solved waxes. Although these properties are great for the manufacture of lubricant oils and yield high added value, the presence of wax adds many com-plications to production, transportation and storage by hindering the flow in pipes (Thomas, 2004; Novaes, 2009).
Paraffins are both linear (n-paraffins) and branched (iso-paraffins) chain alkanes, and they have low re-activity with most compounds. Their chains can have a high carbon number, which implies a higher wax appearance temperature. The low-molecular-weight paraffins are the main components of natural gas, and the medium- and high-molecular-weight ones are found in crude oil (Farayola et al., 2010; Gao, 2008; Jamaluddin et al., 2001).
solubili-1064 G. B. Tarantino, L. C. Vieira, S. B. Pinheiro, S. Mattedi e Silva, L. C. L. Santos, C. A. M. Pires, L. M. N. Góes and P. C. S. Santos
Brazilian Journal of Chemical Engineering
zation of waxes in the fluid (Tinsley; Prud’Homme, 2010). This condition ensures low viscosity and Newtonian behavior of the crude oil (Azevedo, 2003).
Temperature also influences the solubility of waxes in crude oil. When approximately 5% of the waxes crystallize because of oil cooling, a crystal lat-tice appears and traps some of the oil inside; this process is called “gelling” and hinders the fluid flow. Thus, the crude oil flow rate also interferes with wax solubility. The lower the oil flow rate, the longer it stays inside the piping, which favors heat exchange with the external environment (Vieira, 2008).
Once production starts, the oil flows through the pipelines, losing heat to the external environment, with consequent temperature decreases and reduced soluble light oil fractions. Such production condi-tions cause the oil viscosity to increase, which leads to production problems due to the precipitation of waxes (Venkatesan et al., 2005; Gao, 2008).
According to Vieira (2008), the first paraffin crys-tals start to form at a specific temperature, which is called the wax appearance temperature (WAT) and varies depending on the origin of the crude oil. Crys-tallization occurs in three steps:
Nucleation – formation of small particles of crystallized material from which the first paraffin crystals will grow.
Growth – mass transport of the solution to-wards the nuclei formed during the nucleation stage. Agglomeration – when the growing crystals are joined together, thereby yielding larger crystals.
With the nuclei already formed, there is incorpora-tion of new paraffin molecules at the growth sites, and additional molecules of other species are grouped at these sites and become part of the structure. The nu-clei form an ordered lamellar-structure arrangement.
After crystallization starts in a medium that con-tains water as an emulsion, the crystal lattice for-mation phenomenon occurs in a different manner. When the emulsion is of the water-in-oil type, the oil is waxy and the fluid temperature is below the WAT, the precipitated waxes are deposited onto the surface of the water drops, thereby contributing to the growth of the formed precipitate (Oliveira et al., 2010). When a large crystal lattice is in the vicinity of the water drops, a structure is formed; this struc-ture percolates the drops into the lattice and capstruc-tures them. According to Visitin (2008), this structure also provides mechanical resistance to the flow, thereby resulting in an increase in the viscosity and pour point of the oil.
The present study aims to evaluate and compare the flow of two types of crude oil, waxy and non-waxy, by measuring the pressure variation of the
system under the influence of the flow rate, tempera-ture and content of emulsified water.
MATERIALS AND METHODS Crude Oil
The characteristics that influenced the choice of oils used in this study were obtained from the rheo-logical behavior of the samples. Although the availa-ble oils had different wax contents, WATs and com-positions, for a comparative study of the influence of the content of emulsified water, temperature and oil flow rate in the context of loss of flow, it was neces-sary for the oils to be rheologically similar such that any differences originated exclusively from phenom-ena that characterize the increase in fluid viscosity and its implications for the flow.
After a series of comparative tests to search for a non-waxy oil with rheological behavior similar to that of the waxy oil above the WAT, a non-waxy oil was defined as the reference for comparison in the study.
The WAT of each oil was determined through dif-ferential scanning microcalorimetry, µDSC. The analysis was made using a DSC-VII microcalorime-ter, Setaram, with a 500 µL stainless steel pressure cell and the data acquisition and analysis was made through the Setsoft 2000 software. The procedure realized in the tests consists of heating the sample to 80 °C during one hour and a sample of known weight is placed in the cell and then in the equipment. The analysis is made by cooling the sample from 80 °C to 0 °C at a rate of 0.8 °C/min. Microcalorimetry measures any release or absorption of heat by the sample while it cools. The evaluated temperature range consisted in the cooling of the oils from 80 °C to 0 °C. The only possible exothermic event in this temperature range is the release of heat related to the crystallization of waxy species present in the sample. The greater the crystallization peak area, the greater the amount of wax present in the sample, and the higher the temperature at which crystallization oc-curs, the greater the length of the carbon chain of the crystallized paraffins. Figure 1 shows the microcalo-rimetry curve of the waxy oil, which has a WAT of 310.5 K.
w n th (S
in in za 8 p se ar p
F
cr
F
cr
d fr si co al ra T
when precipit earby paraff hat characte Senra et al., 2
The micro nformation b ncreased flo ation of the w
mW) comp roximately 1 econd crysta rea, which araffin.
Figure 1: M rude oil.
Figure 2: Mi rude oil.
The rheol etermined b rom Thermo imilar to tho onsisted of c long a linear ate of 0.5 K/ The rheologic
Brazilian J
tating, tend fin chains, th erize the se
2008). ocalorimetry besides the W
w of latent waxy crude o pared with th 1 mW for th allization eve indicates a
Microcalorim
icrocalorime
ogical behav y using the oHaake and ose used in collecting on r cooling ram K/min and un
cal behavior
Chara
Journal of Chemic
to co-crysta hereby form econd crysta
curves pro WAT of the s
heat during oil paraffins he non-waxy he WAT and ent) results in
large mass
metry curve
etry curve fo
vior of the Rheostress d started fro
microscopy ne thousand v mp from 353
nder a shear results are f
acterization and E
cal Engineering V
allize along ming the vall allization ev
vide additio studied oil. T
g the crysta (approximat y crude oil ( d 2 mW for
n a much lar of crystalliz
for the wa
or the referen
crude oils w 600 equipm om paramet y. The analy
viscosity poi K to 288 K a
rate of 100 found in Fig
Evaluation of Wa
Vol. 33, No. 04,
the leys vent
onal The
alli-tely
(ap-the rger zed
axy
nce
was ment ters ysis ints at a s-¹. gure
3, oil
oil exh na rea be cru exh ing beh cry
Fig
oil hig in he ity
Op
the C5 tro
sam rat fro ou me ve a d co
les len
axy Crude Oil Flo
pp. 1063 - 1071,
which presen ls.
It can be ob ls, with less hibit Newto mic viscosit aching the W
ginning of t ude oil beha
hibited a ma g. The non-w
havior only ystallization
gure 3: Rheo In addition ls must also e gh shear cau
which the e ating at 333 y for water-in
perational S
The experim e PSL System 50, with a cr ol and data ac The equipm mple is pump te. The press om a differen usly recorded ent consisted ssel, sample dosing pump llection inter
The test tub ss steel and ngth. The tem
ow
October - Decem
nts a compar
bserved from than 1% of onian behavi ty values du WAT of the w
the paraffin vior started arked increas waxy crude after the te event.
ogram that co
n to similar exhibit stable used by the f emulsion was .15 K, both n-oil emulsio
System
mental unit mtechnik WA ryostat bath cquisition so ment is a flo ped at contro sure variatio ntial measure d using a test d of a sample
pre-heating p, a thermal rface and a te be used in th
was 3 mm mperature of
ember, 2016
rative rheogr
m Figure 3 th f emulsified
ior and ver during the c waxy crude
crystallizati to be non-N se in viscosit
oil started to temperature
ompares the t
rheological e emulsions flow test. In s subjected t oils exhibite ons.
used in the AX LOOP 2
and the WL oftware packa ow simulator
olled temper on of the oil ement, which t-time diagra e storage ves and post-he l bath, a con est tube. he trials was m in diamete f the oil in th
10
ram of the tw
hat both of th water conten ry similar d cooling befo oil. From th ion, the wax Newtonian an ty during coo o exhibit suc of its secon
two crude oil
behavior, th because of th n stability tes
to 24 hours ed good stab
tests includ 08, model P L_Control co
age.
r in which th ature and flo
was obtaine h was contin am. The equi ssel, a dispos eating system ntrol and da
made of stai r and 2 m he storage ve
065
wo
he nt, dy-ore
he xy nd
ol-ch nd
ls.
he he sts of
il-des P2-
on-he ow ed
nu- ip-sal ms, ata
es-10 se th th co co an p te an T te w k b 6 5 is th an sp en o p su ri v te to ci b o o d F u
066 G. B
el was contro he vessel, wh hrough the p
onnected to ontrolled us nd outlet pre oint gauges. Initially, 1 ent is heated
ntee the sol Then, the oil emperature i when the sam eeping its st ath unit at th During the 0 °C, so tha 5 °C. After s reheated to hen returns to
The tempe nd output of pot meters, nce between ver time, wa Due to th ressure, the ure of 9 bar, ity. This lim alues with a ests relating o 8 bar, whe ific operatio een reached, f flow. The il were acco ue to a small Figure 4 sh
Figure 4: Sc nit.
B. Tarantino, L. C
olled using a hereas the tem
piping was a heating b ing a dosing essures of th
liter of sam to 60 ° C in lubility of a
is circulated is stabilized. mple flows pa tabilized tem he desired flo e test, the oil at the fluid in
cooling alon o solubilize th
o the reservo erature and p
f the test tu every 10 sec n the inlet an as obtained fo he limitation tests were c , in order to mitation resu
an 8 bar lim to the paraff en the limit on condition
, the tests w tests carried omplished w
l pressure los hows the equ
chematic dia
C. Vieira, S. B. Pi
a heating pla mperature of controlled u bath. The oil
g pump, wh e line were m
mple with kno n a reservoir all the paraff by the pass
The next st assing throug mperature due
ow rate. in the tank i nlet tempera ng the test tu he precipitat oir vessel.
pressure valu ube were rec
conds. The p d the outlet o or each test.
of 10 bar f conducted at
preserve th ults in differ mit, and, for t finic oil wer
was reached where this were conducte d out with th within 2 hour
ss.
uipment sche
agram of th
inheiro, S. Matted
Brazilian Jou
ate placed un f the oil pass using a syst l flow rate w hereas the in
measured us
own water c vessel to gu ffins in the
system until tage is initia gh the test tu e to the therm
is maintained ature is fixed ube, the sam ted paraffin a
ues at the in corded, throu
pressure diff of the test tu
for the proc t an input pr e system int rential press this reason, re conducted
d. For any s value had ed for up to he non-paraf rs of operati
ematic diagra
he experimen
di e Silva, L. C. L
urnal of Chemica
nder sing tem was nlet sing on- uar-oil. l its ated ube, mal d at d at mple and nput ugh ffer-ube, cess res- teg-sure the d up spe-not 6h ffin ion, am. ntal Ex ten tem ble wa Tw me list Ta en for cen Ta for wa cru tio po wi me the no pro cal of du co fin Th
L. Santos, C. A. M
al Engineering
xperimental
Three variab nt of emulsif mperature (T es influenced as quantified wo levels wer
es of the rang ted in Table
able 1: Extre ce the flow.
Independent variable A (%) T (K) Q (mL/min)
For the test r three varia nter point, as
able 2: Tests
Tests 1 2 3 4 5 6 7 8 9 10 11 The factors r each level a
Laboratory ater in the wa ude oil, these ometric titrati
tentiometric ith the titratio ental design e same for bo on-waxy crud opriate becau l properties o the waxy c ucted under h
mponents, w ns, thereby ch herefore, the
M. Pires, L. M. N.
Design
bles were def fied water in T) and the fl d the flow o d in terms of re defined fo ge to be anal
1.
eme values o
t Lowest
(-5 293 15
ts, a full fac ables (2³), w s described in
conducted a A X1 - + - + - + - + 0 0 0 involved in are described tests indica axy crude oil e analyzes w ion with Kar titrator mod on unit mode
created requ oth oils. It wa de oil from 0 use this proce of the sampl crude oil fro
eating, result which transfo hanging the
minimum lev
. Góes and P. C.
fined for the the crude oi low rate (Q) of waxy cru f the pressure or each varia lyzed), and th
of the variab
t value -) H 5 .15 50 ctorial design with three rep
n Table 2.
according to T X2 - - + + - - + + 0 0 0
n choosing th d below. ated 5.12% l and 0.3% in were made us rl-Fischer rea del Titrando 8 el Dosino 80 uired the leve was found tha
0.3% to 5% ess preserve le. In contras
om 5.12% t ted in volatil ormed solven
oil’s rheolog evel was set t
S. Santos
tests: the co il (A), the ba ). These vari ude oil, whic e change (∆P able (the extr
heir values a
bles that infl
Highest value (+)
35 298.15
200
n was applie plicates at th
the 2³ desig
Q X3 - - - - + + + + 0 0 0
he values use
of emulsifie n the non-wax sing the pote
agent with th 852, Metrohm 00. The exper
el values to b t hydrating th was more a s the rheolog st, dehydratio
Characterization and Evaluation of Waxy Crude Oil Flow 1067
Brazilian Journal of Chemical Engineering Vol. 33, No. 04, pp. 1063 - 1071, October - December, 2016
The highest levels of the variable “water cut“ were set to be 35% because, when this level was greater than 40%, the viscosity increased, which yielded difficulties in pumping the sample.
The influence of the temperature on the crystal-lization of paraffins dissolved in crude oil, and con-sequently its viscosity, is of paramount importance to this work. Preliminary tests demonstrated that, below 291.15 K, the waxy crude oil used as a sample did not flow properly because of its high viscosity. For this reason, 293.15 K was set as the lowest tempera-ture level used in this study.
The highest temperature level was defined based on the need to expose the waxy crude oil to condi-tions in which crystallization of solubilized paraffins occurs, i.e., at temperatures close to its WAT. There-fore, the highest level was set to 298.15 K.
The residence time in the test tube is also a factor that influences the crude oil flow. The greater the residence time, the greater the heat exchange with the external environment, which results in a wider variation of fluid viscosity. Based on this infor-mation, it was assumed that 150 mL/min would be adequate for the minimum flow rate level.
The maximum flow rate level was set to 200 mL/min, which is close to its maximum operating condition, 275 mL/min.
Experimental Methodology
One liter of the sample with a determined water cut was initially heated to 333.15 K in a storage ves-sel such that the solubility of all paraffins in the oil was ensured. At the same time, the oil was circulated through the system’s bypass until its temperature was stabilized. At the end of this step, the sample flowed through the cooling system.
During the test, the oil that fed the unit was cooled to 328.15 K. After the cooling that occurred throughout the test tube, the oil returned to the begin-ning of the process to be reheated to make the pre-cipitated wax soluble.
The temperature and pressure values at the inlet and outlet of the test tube were recorded during the tests every 10 seconds. The pressure difference be-tween the inlet and outlet of the test tube measured over time was the response obtained for each test. In most of the tests, the maximum pressure variation was achieved in less than two hours of operation. The results indicated that the best strategy to com-pose the experimental design was acquisition of pres-sure change data at a fixed time. The shortest time at which the maximum pressure was attained was used as the time to measure the differential pressure value for all tests.
RESULTS AND DISCUSSION Waxy Crude Oil
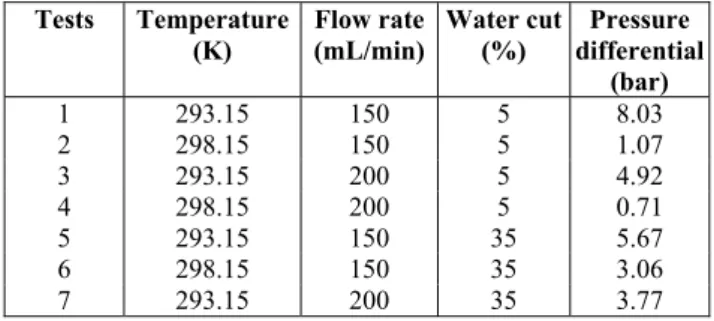
The tests were conducted according to the distri-bution in Table 2 and the pressure differential oc-curred due to the wax precipitation. The pressure difference was calculated from the pressure variation between two manometers, the first one located at the beginning of the flow and the second one at the end of the flow; these manometers present 99 percent accuracy. In most cases, the maximum pressure vari-ation of the system occurred at different times. Be-cause the goal of the research is to study the pressure variation based on the influence of the variables (the emulsified water in the crude oil (A), temperature (T) and flow rate (Q)), the differential pressure values considered as test responses were those attributed to the lowest operating time that reached the maximum pressure variation of the system. The worst flow con-dition was achieved in test 1, with a temperature of 293.15 K, flow rate of 150 mL/min and water cut of 5%; in this test a pressure difference of 8.03 bar was achieved in 36 minutes. Thus, the reference operat-ing time was 36 minutes. The pressure variation responses are found in Table 3.
Table 3: Pressure differential of the samples pre-pared with waxy crude oil.
Tests Temperature (K)
Flow rate (mL/min)
Water cut (%)
Pressure differential
(bar)
1 293.15 150 5 8.03
2 298.15 150 5 1.07
3 293.15 200 5 4.92
4 298.15 200 5 0.71
5 293.15 150 35 5.67
6 298.15 150 35 3.06
7 293.15 200 35 3.77
The data in Table 3 were processed with the aid of parametric statistics. The empirical models pre-sented in Figures 6 and 7 were evaluated for signifi-cance through analysis of variance based on the Pa-reto diagram shown in Figure 5.
10
o fo
F
re
p p p en ra es p w
F
p th ti in fr te it im lo
068 G. B
f 0.98, whic or describing
Figure 5: Par esults.
Figure 6 s erature and ressure varia ressure drop nt temperatu ange. The hig st ambient t ressure drop when a higher
Figure 6: Resp The lowes osed an aver hat was belo ion of large ncreasing the rom Figure 3 est tube dire t lost heat to mmersed ove ower the oil
B. Tarantino, L. C
ch implies th g the behavio
reto diagram
shows the be flow rate as ation. It can p occurred at ure for all fl ghest pressur emperature p was indepe
r ambient tem
ponse surface
st ambient tem rage tempera w its WAT (
amounts o e viscosity of
3. The resid ctly influenc
the environm er a longer t
flow rate in
C. Vieira, S. B. Pi
hat the mode or of the stud
m of the waxy
ehavior of th s a function be observed t the highest low rates in
re drop occu and lowest f endent of the mperature wa
e - flow rate a
mperature le ature of the (37.4 °C). Th
f waxes occ f the oil, as c dence time o ced its tempe
ment in whic time period. n the system
inheiro, S. Matted
Brazilian Jou
l is appropri died system.
y crude oil fl
he ambient te n of the syst
that the low t level of am the conside urred at the lo
flow rates. T e flow rate o
as imposed.
and temperatu
evel (20 °C) i waxy crude hus, crystalli
curred, there can be observ f the oil in erature becau ch the tube w Therefore, , the greater
di e Silva, L. C. L
urnal of Chemica
iate
low
em-tem west
mbi-ered ow-The only
ure.
im-oil iza-eby ved the ause was the r its
res av am vis (25 tem sam
did Ho po an dro wa tha en in am pre the led ab the lea
Fig
am the no to act sm bil hav
Re
to
L. Santos, C. A. M
al Engineering
sidence time erage tempe mount of crys
scosity. Near 5 °C), the flo m pressure b mple remain
For the stu d not have a owever, its i ortant. Figure d lowest wat op. This effe ax on the in an the effect
ce was so st the oil/wate mount of cry essure drop o e “gelling” o d to a more f sent. The wa e precipitate ading to decr
gure 7: Resp At the high mount of wate
e pressure d omenon occu
split and be tion of shea maller the siz
lity and divis ve a piston s
eference Cru
The non-wa the same me
M. Pires, L. M. N.
in the test t erature of the
stallized wax r the highest
ow rate did because the
ed above the udied parame significant e interaction w e 7 shows th
ter cut consp ect occurred ncrease in vi
of the emul trong that th er ratio of th ystallized par of the system of the paraffi
flexible struc ater droplets
, thereby m reased pressu
onse surface
hest temperat er mixed wit differential o
rred because ecome incre ar stresses c
e of these dr sibility, whic
hape.
ude Oil
axy crude oi ethodology a
. Góes and P. C.
tube. This im e oil, which x and conseq
ambient tem not interfere outlet temp e WAT.
eter ranges, effect on the with tempera hat the highe pired to reduc d because the iscosity was lsified water. he larger the he sample, t araffin and th m. This resul
in in the pres cture than wh
increased th making its flo
ure gain due
- water cut an
ture levels, t th the crude o of the syste e the water d easingly sma caused by t rops, the low ch caused the
il was evalua applied for th
S. Santos
mplied a low increased th quently the o mperature lev
e with the sy perature of th
the water c pressure dro ature was im
st temperatu ce the pressu e effect of th
much great . This interfe
amount of o the greater th he greater th lt suggests th
sence of wat hen water w he flexibility ow easier an
to “gelling”.
nd temperatur
the greater th oil, the great em. This ph droplets tende aller under th the flow. Th wer their flex
e fluid flow
ated accordin he waxy crud wer
he oil vel
ys-he
cut op. m-ure ure he ter er-oil
he he hat ter was of nd .
re.
he ter
he-ed he he
xi-to
o u T p th th sh th (R m st ca w an In n F fl fl b th le w
il. Table 4 p sed in the sta
Table 4: Pre ared with n
Tests Tem
1 2
2 2
3 2
4 2
5 2
6 2
7 2
8 2
9 2
10 2
11 2
The data in he significan he Pareto di how the effe his evaluatio R²) of 98.96 model properl
tudy. According antly influen waxy crude o nd interactio n contrast, th
ot significan
Figure 8: Par low results.
Figure 9 sh low rate on t
e observed th he water cut evel. Howev when the wat
Brazilian J presents the atistical analy ssure differ non-waxy cru mperature (K) Flo (m 293.15 298.15 293.15 298.15 293.15 298.15 293.15 298.15 295.65 295.65 295.65
n Table 4 wer nce values for iagram in F ects of the op on, with a c 6%. This resu
ly represente
g to Figure 8 nced the pre oil flow wer on between t he temperatu nt.
reto diagram
hows the inf the pressure hat the press was lower, ver, the pres ter cut was h
Chara
Journal of Chemic
pressure dif ysis.
rential of the ude oil.
ow rate mL/min)
Wate (%
150 5
150 5
200 5
200 5
150 3 150 3 200 3 200 3 175 2 175 2 175 2
re fitted with r the variabl igure 8. Fig perational va oefficient of ult indicates ed the physic
8, the variab essure variati
re the flow r the flow rate ure and its in
m of the
non-fluence of th variation of sure variation regardless o ssure variatio higher, as wa
acterization and E
cal Engineering V
fferential valu
e samples p
er cut %) Pressu differen (bar) 5 0.49 5 0.37 5 0.57 5 0.58 5 1.48 5 1.42 5 1.93 5 2.02 0 1.00 0 1.01 0 0.95
h a linear mod es are shown gures 9 and ariables used f determinat s that the lin al system un
les that sign ion in the n rate, water c e and water c nteractions w
-waxy crude
e water cut a the flow. It c n was less wh of the flow r
on was grea as the flow ra
Evaluation of Wa
Vol. 33, No. 04,
ues pre-re ntial ) del; n in 10 d in tion near nder nifi- non-cut, cut. were oil and can hen rate ater ate. Th sam it flo the oc sig the Fig dro im im cre flo ob wa the inc tem sho ran en ity can we tio ser per wa par are be tem sec no
axy Crude Oil Flo
pp. 1063 - 1071,
he water infl me manner t exhibited a owing with a e continuous curred, this gnificant phe e oil viscosity
gure 9: Resp It is notewo oplets in the mply wax dep mposed on t
eased the pr ow rate exhib bserved for t axy crude oil e pressure va crease in the Figure 8 sh mperature w
own in Figur nge was very ce of the tem y was very
nce. The tem ell above the on event of t rved in Figur The microc ratures above as little para raffin remain ea observed
cause the inl mperature of cond crystal ot significant
ow
October - Decem
uenced the n that it influen flow simila liquid, thus s phase. Bec phenomenon enomenon of
y.
ponse surface
orthy that, w flow, the inc position but these drople ressure varia bited behavio the waxy cr l a decrease ariation, in th
flow rate inc hows that the as not signif re 10. Becau y small, from mperature on small, which mperature lev temperature the non-wax re 2. alorimetry c e the second affin crystall ned soluble, in Figure 2. let temperatu f the system
lization even in the define
ember, 2016
non-waxy cr enced the wa ar to that o increasing th cause no wax n appeared t f those that i
e – water cut
with the pres ncrease in flo rather increa ets and con ation. For th or that was o rude oil. W in the flow he non-waxy creased the p e variation o ficant, and th use the studie m 20 °C to 25 n the increase h justifies it vels set for e of the seco xy crude oil
curves indica crystallizatio lization, and as indicated In the tests a ure was 55 ° m remained w
nt; thus, this ed level rang
10
rude oil in th axy oil, that i
f small soli he viscosity x precipitatio to be the mo interfered wi
and flow rate
sence of wat ow rate did n ased the she nsequently i his reason, th opposite to th Whereas in th
rate increase y crude oil th pressure gain of the ambie his fact is al ed temperatu 5 °C, the infl e in oil visco ts non-signif the tests we nd crystalliz (17.6 °C) o
10
F
p
M
cu g
tr at p cr
070 G. B
Figure 10: R erature.
Memory Effe
As can be urred in tripl ate phenome Figures 11 riplicate with t the middle ressure, the redibility to t
Figure 11: T
Figure
B. Tarantino, L. C
Response sur
ect
seen in Tab licate in the p ena such as a 1 and 12 sh h samples of e point of 3 differential the test and i
Triplicate tes
e 12: Triplica
C. Vieira, S. B. Pi
rface - wate
ble 2, trials 9 planning in o a memory eff how the test f both oils. It 36 minutes,
values are its repeatabil
t with non-w
ate test with w
inheiro, S. Matted
Brazilian Jou
er cut and te
, 10 and 11 order to inve fect.
s performed is evident th comparing similar, giv lity.
waxy crude o
waxy oil.
di e Silva, L. C. L
urnal of Chemica
em- oc-
esti-d in hat,
the ving
oil.
we ev wa the wo pro an rat
wa ver the oil tem an the wa eff lon cau tem flo thr wa mo ab spl beh inc
wa eff in mo po of be lar an pro flo inc
Ev Ap CA log
L. Santos, C. A. M
al Engineering
Although th ere very simi
idenced by F axy crude oil e waxy crud orking range oved to be d d interaction te and water
The variabl axy crude oi rsely propor e large amou l, once the mperature, a d contribute e system. Th as inversely p fect occurre nger residenc using further mperature. T ow, with wax
rough the in ax precipitate ore flexible,
sence of pre lit because o haved like creasing its v
The non-w ater cut, flow fects. Becaus
the non-wax ost significan rtional to the
emulsified w cause the be r to that of a
d, unlike th oportional to ow rate, the g
crease in asso
A
To Brazilian valuation of perfeiçoamen APES), Natio gical Develo
M. Pires, L. M. N.
CONCLU
he rheologic ilar at tempe Figure 3, the
l was comple de oil at lo e used, the
ependent on n between c
cut.
le that was th il was the te
tional to the unt of wax tha
WAT was a large amou d to increasi he flow rate proportional d because l ce time for t r heat loss an
he presence x precipitatio nteraction of e. This intera thereby fac ecipitate, the of the shear a solid disp viscosity.
axy crude o w rate and c se of the sma xy crude oil, nt was the w e pressure ga
water, the gr ehavior of the
a solid. The he waxy cru
o the pressu greater the sh ociated press
CKNOWLE
n Federal Ag Graduate Ed nto de Pess onal Council opment (Con
. Góes and P. C.
USIONS
cal propertie eratures abov e flow behavi etely differen ower temper
flow of wa the flow rat combination
he most sign emperature, w
pressure ga hat was prese achieved by unt of paraff
ing the press e was also s l to the press low flow ra the oil in the nd conseque
of emulsifie on, induced f water drop action made
cilitating its e water drop imposed by persed in th
oil was influ combination all amounts o
, the variabl water cut, w ain. The grea reater the sy e water drop
flow rate w ude oil, its
ure gain. Th hear and, con sure variation
EDGMENT
gency for th ducation (Co soal de Nív
for Scientifi nselho Nacio
S. Santos
es of both oi ve the WAT,
ior of the no nt from that ratures. In th
axy crude o te, temperatu
s of the flo
nificant for th which was i in. Because nt in the crud
lowering th fin crystallize sure change significant an
sure gain. Th ates caused e line, thereb ntly decrease ed water in th gel formatio plets with th the precipita s flow. In th plets tended y the flow an
e oil, thereb
uenced by th n of these tw of wax prese
e that was th which was pr
ater the amou stem viscosi plets was sim was significa
influence w he greater th nsequently, th
n.
TS
he Support an oordenação d el Superior ic and Techn nal de Dese
ils as
on-of he oil ure ow
he
in-of de he ed in nd his a by ed he on he ate he to nd by
he wo ent he ro-unt
ity
mi-ant was he he
en-Characterization and Evaluation of Waxy Crude Oil Flow 1071
Brazilian Journal of Chemical Engineering Vol. 33, No. 04, pp. 1063 - 1071, October - December, 2016
volvimento Científico e Tecnológico - CNPQ), and Petrobras (Petróleo Brasileiro S.A).
REFERENCES
Azevedo, L. F. A., Wax deposition in subsea pipe-lines: A review of modeling attempts. Petroleum Science and Technology, 21, 393-408 (2003). Camargo, R. M. T., Gonçalves, M. A. L., Montesanti,
J. R. T., Cardoso, C. A. B. R., Minami, K. A., Per-spective view of flow assurance in deepwater fields in Brazil. Offshore Technol. Conf. OTC – 16687 (2004).
de Oliveira, A. G., Caracterização da Distribuição do Tamanho de Gotas em Emulsões Água e Óleo Uti-lizando Diferentes Técnicas de Medição [Charac-terization of Size Distribution of Water and Oil Emulsion Drops Using Different Measurement Techniques]. Instituto de Engenharia Mecânica, UNIFEI, Master's Thesis (2010). (In Portuguese). de Oliveira, M. C. K Teixeira, A., Vieira, L.C., Car-valho, R. M., CarCar-valho, A. B., Couto, B. C., Flow Assurance Study for Waxy Crude Oils. Energy & Fuels, 26, 2688-2695 (2012).
de Oliveira, M. C. K., Carvalho, R. M., Carvalho, A. B., Couto, B. C., Faria, F. R. D., Cardoso, R. L. P., Waxy crude oil emulsion gel: Impact on flow as-surance. Energy & Fuels, 24, 2287-2293 (2010). Farayola, K. K., Adeboye, Y. B., Adekomaya, O. A.,
Thermodynamics prediction of wax precipitation using the Patel-Teja equation of state.In: Nigeria Annual International Conference and Exhibition.
Society of Petroleum Engineers, (SPE), Paper 136966 (2010).
Gao, S., Investigation of interactions between gas hydrates and several other flow assurance ele-ments.Energy & Fuels, 22, 3150-3153 (2008). Jamaluddin, A. K. M., Nighswander, J., Joshi, N., A
systematic approach in deepwater flow assurance fluid characterization. In SPE Annual Technical Conference and Exhibition Society of Petroleum Engineers (SPE), Paper71546 (2001).
Langevin, D., Poteau, S., Hénaut, I., Argillier, J. F., Crude oil emulsion properties and their applica-tion to heavy oil transportaapplica-tion. Oil & Gas Sci-ence and Technology, 59, 511-521 (2004). Novaes, R. C. S., Campos Maduros e Áreas de
Acu-mulações Marginais de Petróleo e Gás Natural uma Análise Econômica no Recôncavo Baiano [Mature Fields and Areas of Marginal Accumula-tion of Crude Oil and Natural Gas, an Economic Analysis at the Bahian Reconcavo], Escola
Poli-técnica, Universidade de São Paulo, Master’s Dis-sertation (2009). (In Portuguese).
Pauly, J., Daridon, J., Coutinho, J. A. P., Solid depo-sition as a function of temperature in the nC10+ (nC24-nC25-nC26) system. Fluid Phase Equilib-ria, 224, 237-244 (2004).
Ronningsen, H. P., Bjorndal, B., Hansen, A. B., Peder-sen, W. B., Wax precipitation from North Sea crude oils. 1. Crystallization and dissolution temperatures, and Newtonian and Non-Newto-nian flow properties. Energy & Fuels, 5, 895-908 (1991).
Santos, P. C. S., Precipitação de Parafina em Mistu-ras de Petróleo: Medidas Experimentais e Mo-delagem Termodinâmica. [Wax Precipitation in Crude Oil Mixtures: Experimental Measurements and Thermodynamic Modeling]. Faculdade de Engenharia Mecânica, UNICAMP, Master’s Dis-sertation (1994). (In Portuguese).
Senra, M., Panacharoensawad, E., Kraiwattanawong, K., Singh, P., Fogler, H. S., Role of n- polydisper-sity on the crystalization of n-alkanes from solu-tion. Energy & Fuels, 22, 545-555 (2008). Skrifvars, B. J., Hansen, L. A., Frandsen, F. J.,
Dam-Johasen, K., Sorensen, H. S., Characterization on ashes and deposits from high-temperature coal-straw co-firing. Energy & Fuels, 13(4), 803-816 (1999).
Szklo, A. S., Fundamentos de Refino de Petróleo. [Fundamentals of Petroleum Refining]. Rio de Ja-neiro, Ed. Interciência, (2005). (In Portuguese). Thomas, J. E., Fundamentos de Engenharia de
Petró-leo. [Fundamentals of Petroleum Engineering]. Rio de Janeiro, 2ª Ed., Interciência (2004). (In Portuguese).
Tinsley, J. F., Prud’Homme, R. K., Deposition appa-ratus to study the effects of polymers and asphal-tenes upon wax deposition. Journal of Petroleum Science and Engineering, 72, 166-174 (2010). Venkatesan, R., Nagarajan, N. R., Paso, K., Yi, Y. B.,
Sastry, A. M., Fogler, H. S., The strength of paraf-fin gels formed under static and flow conditions. Chemical Engineering Science, 60, 3587-3598 (2005).
Vieira, L. C., Estudo do efeito da pressão sobre a Cristalização de Parafinas de Petróleos. [Study of the effect of pressure on the crystallization of crude oil paraffins]. Instituto de Macromoléculas, UFRJ, Ph.D. Thesis (2008). (In Portuguese). Visintin, R. F. G., Lockhart, T. P., Lapasin, R.,