Distribution of Pyrethroid Resistant
Populations of
Triatoma infestans
in the
Southern Cone of South America
Marinely Bustamante Gomez1, Liléia Gonçalves Diotaiuti1, David E. Gorla2*
1Laboratório de Referência em Triatomíneos e Epidemiologia da Doença de Chagas, Centro de Pesquisas René Rachou—FIOCRUZ Minas, Belo Horizonte, Brazil,2Instituto Multidisciplinario de Biología Vegetal (IMBIV), CONICET-Universidad Nacional de Córdoba, Córdoba, Argentina
*david.gorla08@gmail.com
Abstract
Background
A number of studies published during the last 15 years showed the occurrence of insecti-cide resistance inTriatoma infestanspopulations. The different toxicological profiles and mechanisms of resistance to insecticides is due to a genetic base and environmental fac-tors, being the insecticide selective pressure the best studied among the last factors. The studies on insecticide resistance onT.infestansdid not consider the effect of environmental factors that may influence the distribution of resistance to pyrethroid insecticides. To fill this knowledge gap, the present study aims at studying the association between the spatial dis-tribution of pyrethroid resistant populations ofT.infestansand environmental variables.
Methodology/Principal Findings
A total of 24 articles reporting on studies that evaluated the susceptibility to pyrethroids of 222 field-collectedT.infestanspopulations were compiled. The relationship between resis-tance occurrence (according to different criteria) with environmental variables was studied using a generalized linear model. The lethal dose that kills 50% of the evaluated population (LD50) showed a strong linear relationship with the corresponding resistance ratio (RR50).
The statistical descriptive analysis of showed that the frequency distribution of the Log (LD50) is bimodal, suggesting the existence of two statistical groups. A significant model
including 5 environmental variables shows the geographic distribution of high and low LD50
groups with a particular concentration of the highest LD50populations over the region
identi-fied as the putative center of dispersion ofT.infestans.
Conclusions/Significance
The occurrence of these two groups concentrated over a particular region that coincides with the area where populations of the intermediate cytogenetic group were found might reflect the spatial heterogeneity of the genetic variability ofT.infestans, that seems to be the cause of the insecticide resistance in the area, even on sylvatic populations ofT.infestans, never before exposed to pyrethroid insecticides, representing natural and wild toxicological
OPEN ACCESS
Citation:Bustamante Gomez M, Gonçalves Diotaiuti L, Gorla DE (2016) Distribution of Pyrethroid Resistant Populations ofTriatoma infestansin the Southern Cone of South America. PLoS Negl Trop Dis 10(3): e0004561. doi:10.1371/journal. pntd.0004561
Editor:Ricardo E. Gürtler, Universidad de Buenos Aires, ARGENTINA
Received:October 2, 2015
Accepted:February 29, 2016
Published:March 23, 2016
Copyright:© 2016 Bustamante Gomez et al. This is an open access article distributed under the terms of theCreative Commons Attribution License, which permits unrestricted use, distribution, and reproduction in any medium, provided the original author and source are credited.
Data Availability Statement:All relevant data are within the paper and its Supporting Information files.
Funding:This work was supported by Conselho Nacional de Desenvolvimento Científico e Tecnológico (Cnpq)/Grant N° 400628/2013-9, Pesquisador Visitante Especial to DEG, and Programa de Estudantes-Convênio de
Pós-Graduação (PEC-PG)—Coordenação de
phenotypes. The strong linear relationship found between LD50and RR50suggest RR50
might not be the best indicator of insecticide resistance in triatomines.
Author Summary
The elimination ofT.infestansin wide areas of the Southern Cone countries of South America and good results in other vector control initiatives showed the high susceptibility of triatomines to pyrethroid insecticides. Despite the constant efforts of vector control, the success was not complete in several areas of the Gran Chaco region of Argentina, Bolivia and Paraguay and parts of the Inter-Andean Valleys of Bolivia, and southern Peru, where persistent populations of domestic and wildT.infestansstill persist. Additionally, high lev-els of insecticide resistance leading to control failures were described in the biogeographic region of the Gran Chaco, within the area of persistent house reinfestation after insecticide application. The influence of environmental variables on the geographic distribution of triatomine was previously studied for several species, showing significant correlations between Triatominae species occurrence and a number of environmental variables. We investigated the association between the spatial distribution of pyrethroid resistant popula-tions ofT.infestansand environmental variables. This study shows that pyrethroid resis-tance inT.infestanscausing control failures is a highly localized event, spatially associated with the putative dispersion origin of the species, the location of the intermediate cyto-genetic group, and with a particular combination of environmental variables, near the bor-der between Argentina and Bolivia. The strong linear relationship found between LD50
and RR50suggest RR50might not be the best indicator of insecticide resistance in
triatomines.
Introduction
Chagas disease is the most important vector-borne infection in Latin America, affecting approximately 5–6 million individuals [1]. The disease is caused by the protozoaTrypanosoma cruzi(Trypanosomatidae) and the most frequent transmission mechanism is through the feces of infected blood-sucking insects belonging to the subfamily Triatominae (Heteroptera: Redu-viidae). The main vector ofT.cruziin the countries of the southern cone of South America is
Triatoma infestans(Klug). This species lives mainly in warm and dry rural areas and in close association with human dwellings, including domiciles and peridomiciliary structures [2,3]. During the last years, a number of wild foci ofT.infestanshave been described, mainly in the Inter-Andean Valleys of Bolivia, in the Gran Chaco of Argentina, Bolivia and Paraguay [4–8] and in a Metropolitan region from Chile [9].
By 1960, the maximum geographic distribution ofT.infestansoccupied an estimated area of 6.28 million km2[10], including parts of Argentina, Bolivia, Brazil, Chile, Paraguay, Peru and Uruguay. This species was responsible for well over half of the 18 million people infected byT.cruzi, as estimated by WHO [11] for the 1980 decade. After the establishment of the Southern Cone Initiative (INCOSUR) in 1991, wich had the main goal of interrupting theT.
cruzitransmission using chemical insecticides to eliminateT.infestanspopulations and through blood transfusion, the vectorial transmission ofT.cruziwas interrupted in Uruguay (1997), Chile (1999) and Brazil (2006), according to the certification of the Pan-American Health Organization (PAHO) [12]. In Argentina (seven provinces) and Paraguay (eastern) the
design, data collection and analysis, decision to publish, or preparation of the manuscript.
transmission ofT.cruziwas interrupted in several areas where the disease had been historically endemic [13]. The Departments of La Paz and Potosí in Bolivia recently certified the interrup-tion of the vectorial transmission ofT.cruzi[14]. As a consequence of the vector control inter-ventions in the region, there was a significant reduction of the distribution area ofT.infestans
to less than 1 million km2, leading to a strong reduction of the new infections byT.infestans
[10,14–18].
Despite the constant efforts of vector control the success was not complete,T.infestans per-sists as domestic populations in several areas of the Gran Chaco region from Argentina, Bolivia and Paraguay and parts of the Inter-Andean Valleys of Bolivia, and southern Peru [19–21]. Persistent bug populations that survived the insecticide application at local spatial scales, were related with sources of peridomestic populations, operational failures, reduced residual effect of insecticide or development of resistance to pyrethroid insecticides that decrease the vector control efficacy [22–26]. Resistance to insecticides is a microevolutionary process, over which the dynamics, the structure of the population and the gene flow between groups of individuals would determine the maximum geographical spread of each process of resistance evolution [27,28]. In different geographic areas of Argentina and Bolivia, resistance ofT.infestansto pyrethroids was detected by 2000, [29–38]. The occurrence of insecticide resistance was rela-tively unexpected [39,40]for a long life cycled-insect duration (compared with other pest spe-cies with insecticide resistance records), relatively low frequency of insecticide applications, unsustained-over-time, and low insecticide efficacy in the peridomestic structures that would leave many residual populations (not necessarily resistant, but susceptible individuals that were not affected by the insecticide that degraded before contacting the insects). Studies showed dif-ferent toxicological profiles and mechanisms of resistance [31,35,36,41]. High levels of insec-ticide resistance (populations that need 1000 times the amount of active ingredient to kill the same fraction of a susceptible population) leading to control failures were described in the bio-geographic region of the Gran Chaco, coinciding with the area of persistent house reinfestation even after insecticide application.
The accumulation of evidence over the last years suggests that the occurrence of insecticide resistance inT.infestanspopulations is associated with the high genetic variability detected in the historical dispersion site of the species towards the southern cone of South America [21,42,
43] and the strong spatial structure of the populations derived by low population dispersal rates [24,44–45].
Why is it that control failure associated with insecticide resistance has only been recorded in this particular area and not anywhere else over the historical geographic distribution ofT. infes-tans? The cause of the appearance of pyrethroid resistance is still under discussion. The repeated application of pyrethroid insecticide does not seem to be the only cause of pyrethroid resistance appearance, as resistant populations occurred in areas that received less insecticide pressure than others where resistance did not occur, and because multiple independent resis-tance mechanisms were detected in several populations. The diversity of resisresis-tance mecha-nisms and the genetic variability around the putative dispersion center of theT.infestans
encouraged the consideration of the influence of environmental variables as another potential cause of pyrethroid resistance occurrence [28].
DNA regions that control their expression have been linked to evolutionary responses to pollu-tion, global warming and other changes. Interestingly, a significantly higher diapause propensi-ties in carriers of the resistance alleles (37.0–76.2%) than in susceptible homozygotes (6.7%) was shown [48]. Although no diapause was ever shown to exist in Triatominae, it was shown that the developmental delays in fifth instar nymphs of Triatominae could be due to an adap-tive risk-spreading diapause strategy [49], if survival throughout the diapause period and the probability of random occurrence of‘‘bad”environmental conditions are sufficiently high.
The influence of environmental variables on the geographic distribution of triatomine was studied for several species, showing significant correlations between a number of environmen-tal variables (particularly temperature) and species occurrence e.g. [10,50]. As other pheno-typic characters, the different toxicological profiles and mechanisms of resistance to
insecticides is due to a combination of a genetic base and environmental factors [28], with the selective insecticide pressure being the best studied among the last factors. So far, studies on insecticide resistance onT.infestansdid not consider the effect of environmental factors, that may influence the distribution of resistance to pyrethroid insecticides inT.infestans
populations.
Guided by the question about the particular occurrence of vector control failures caused by pyrethroid resistance in this particular area, we explored in this study for the first time the geo-graphic distribution of pyrethroid resistance ofT.infestanspopulations and its association with environmental variables.
Methods
Data collection
An exhaustive compilation of all available data on studies about susceptibilityof T.infestansto pyrethroid insecticides was carried out. Repeated data were discarded.
A database containing information on the field-collected specimens and methods used in the susceptibility studies based on topical application of insecticide was created. The database includes collection location coordinates, collection ecotope (intradomestic/peridomestic/syl-vatic), value of the lethal dose that kills 50% of the evaluated population (LD50), resistance ratio
50 (RR50) (calculated as LD50of the evaluated population/ LD50of the susceptible population)
and diagnostic dose (DD) (defined as percent mortality produced by twice the minimum con-centration of the insecticide that causes 99% of mortality in the susceptible laboratory strain). All tests were carried out using first instar nymphs between 3–5 days, topicated with a 0.2 uL droplet applied with a Hamilton microsyringe.
Identifying aT.infestanspopulation as resistant to pyrethroids is not easy, because no objec-tive definition of resistance for triatomines exists. At least three criteria have been proposed to operationally define triatomines' resistance. Pan American Health Organization [51] defined as resistant all populations with RR50>5 (PAHO criteria from now on). Zerba and Picollo
[52] suggested that a population should be considered resistant when RR50>2 (Z&P criteria
from now on). WHO [53] proposed the use the DD and considered a population as resistant if mortality is<80%, and susceptible if mortality>98% (WHO criteria from now on), although
the latter criteria is used mainly to evaluate resistance in mosquitos.
Analysis of resistance occurrence
resistant anyT.infestanssample that was classified as resistant by any of the three criteria. A fifth category (RR2) recorded as resistant anyT.infestanssample that was classified as resistant by at least two of the three criteria. A sixth category (RR3) recorded as resistant aT.infestans
sample that was classified as resistant by the three criteria. A seventh category (LD50) (strictly
not a resistance category) considered the value of the LD50(i.e. the amount of the active
ingre-dient that produced 50% of mortality within the sample under study). It is worth remarking that RR1, RR2 and RR3 are derived variables from PAHO, Z&P and WHO variables, not inde-pendent of each other, as they are defined as“both”or“either”of the other criteria.
Environmental data
The analysis of the association between resistance occurrence and environmental variables was carried out using the WorldClim dataset (http://www.worldclim.org) [54], that characterizes cli-matic conditions over the Earth surface between 1950–2000 in a grid format, with a pixel resolu-tion of 1km. Variables included 19 bioclimatic statistics derived from monthly total precipitaresolu-tion, and monthly mean, minimum and maximum temperature (Bio1 to Bio19 described in full at
http://worldclim.org/bioclim). Altitude above sea level was added to the climatic variables.
Modelling resistance occurrence
The distribution ofT.infestansresistance to pyrethroid insecticides occurrence was carried out using the species distribution modelling approach [55], with the geographic coordinates of resistance occurrence recorded as“presences”. We explored two different approaches on the consideration of“absences”. On one approach, we considered the coordinates ofT.infestans
populations defined as susceptible, and on the other approach (usual within the context of spe-cies distribution modelling [56]), we considered a random selection of 1000 background (pseudo-absence) points taken over the Gran Chaco region and Inter-Andean valleys, the area whereT.infestanspopulations still persists after the successful interventions of the Southern Cone Initiative [18].
For the study of the association between environmental variables and resistance occurrence we used a binary response variable, assigning 1 to cases recorded as a site with aT.infestans
resistant population, according to each of the seven resistance criteria mentioned above, and 0 to the susceptible populations or the randomly selected background points. The case of the LD50data was analyzed similarly as a binary variable based on a threshold value that divided
the dataset in high LD50(assigned the value 1) and low LD50(assigned 0) (see the appropriate
section inResultsfor additional details). The analysis was based on a generalized linear model (GLM) with a logit link. Colinearity between bioclimatic variables was estimated using the vari-ance inflation factor (vif), of the Rcarpackage. Only variables withvif<10 were considered for
the construction of the model. The evaluation of the model was estimated using the partial area under the receiver operation curve, calculated with the pAUC package of R. Cross-validation (through thecv.glmfunction) was used to measure the robustness of model estimation. Data analysis was carried out with R (version 3.2.0).
In order to qualitatively explore the association between population genetics characteristics ofT.infestansand the LD50measured on the populations compiled in this study we used the
geographic coordinates of the populations categorized by cytogenetics groups (andean, non andean and intermediate), as reported by [21].
Results
from Argentina (101), Bolivia (106), Brasil (14) and Paraguay (1) (Fig 1). Not all studies reported RR50, or LD50and DD, and as a consequence, the number of populations considered
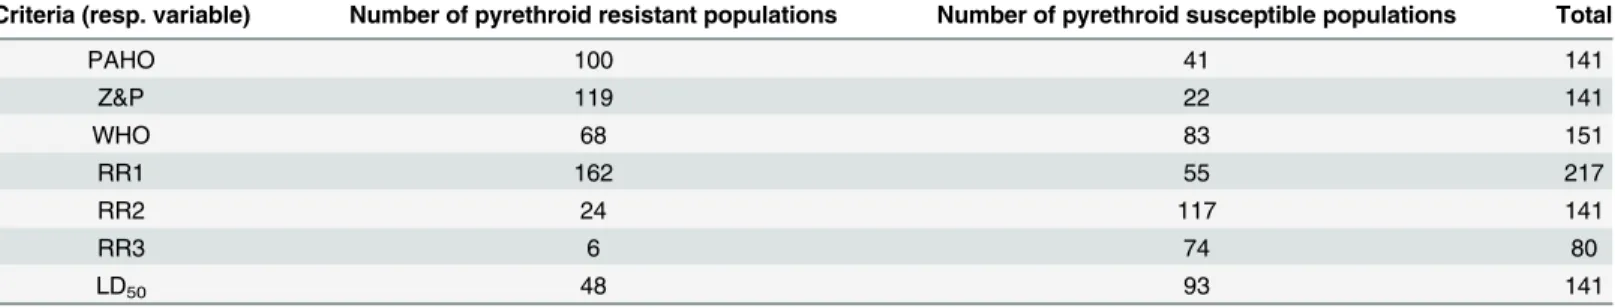
for the analysis was smaller than 222.Table 1summarizes the occurrence of pyrethroid resis-tance, according to each criterium category. The highest recorded RR50and LD50were 1108
and 228, respectively from Campo Largo (Salta, Argentina). The complete dataset is included inS1 Table.
Reported values of LD50show a significant and strong linear relationship with their RR50.
However, detailed consideration of compiled data shows that all the reported values by Ger-mano and colleagues [20,32,36,23], together with one reported value by [30] and one by [23] (n = 33, all tests used deltamethrin, except [30], that used B-cyfluthrin) (T.infestans popula-tions widely distributed around Argentina, Bolivia and Paraguay) lie over different line func-tions (with very low residual variability), compared with the rest of the n = 112 reported values by the other 15 authors (slope values of 7.5 and 4.4 for the first and second group, respectively; significantly different, P<0.0001) (S1 TableandS1 Fig).
Pyrethroid susceptibility and environmental variables
A first set of analysis for the first six categories using the recorded resistant and susceptible populations to fit the generalized linear model (GLM) with the environmental variables as pre-dictors showed a low ability to explain the variability of the resistant populations (of any con-sidered category) occurrence. Among the fitted models, the best one explained 43% of the resistance occurrence distribution, based on the PAHO criteria. This model was fitted using 100 points of resistance occurrence and 41 of susceptibility occurrence and included the high-est number of environmental variables (Table 2). These 41 susceptibility points is a probably biased sample of the susceptible populations occurrence, driven by the special interest in the region of the border between Argentina and Bolivia; the actual distribution of susceptible pop-ulations is probably more widely distributed. A similar result was found when the observed susceptible populations were replaced by the set of 1000 randomly selected points taken from the entire Gran Chaco region and Inter-Andean valleys, whereT.infestanspopulations are still patchily present. The analysis showed that none of the environmental variables (either consid-ering the location of the susceptible population or taking background points) were able to account for more than 50% of the resistance occurrence, defined by each of the 6 mentioned criteria.
The geographic distribution of LD
50The descriptive analysis of LD50values, showed that the frequency distribution of the Log
(LD50) is bimodal, suggesting the existence of two statistical subpopulations (groups).
The value 2.6 is the threshold value that best separates the two groups. Calculating the descriptive statistics separately for the two groups, the group with lower Log (LD50) has an
average = 0.17 and standard deviation = 1.47, whereas the group with higher Log (LD50) has
values 3.82 and 0.74, respectively (Fig 2).
Driven by this identified pattern, we plotted the distribution ofT.infestanspopulations clas-sifying them in two groups, with low (2.6) and high (>2.6) Log (LD50). The geographic
dis-tribution of these groups show a particular concentration of populations with highest LD50
over the region identified as the putative center of dispersion ofT.infestans. Thus, we pursued the analysis classifying the two LD50groups assigning 0 to those showing Log (LD50)2.6 and
1 to those showing Log (LD50)>2.6.
the environmental variables as predictors. The model was based on 48 population samples where the Log (LD50)>2.6 and 92 population samples where Log (DL50) was<2.6. After
vari-able selection to eliminate colinearity (vif<10), a model including 5 significant environmental
variables was able to explain 55% of the variation in the distribution of the Log (LD50) groups
(Table 2). The environmental variables Mean Diurnal Range (Mean of monthly (max temp— min temp)) (Bio2), Mean Temperature of the Driest Quarter (Bio9), Precipitation Seasonality (Coefficient of Variation) (Bio15); Precipitation of the Warmest Quarter (Bio18) are positively correlated, whereas isothermality (Bio2/Bio7) (100) (Bio3) is negatively correlated with the
occurrence of high LD50populations.
Using the model describing the distribution of populations with low and high Log (LD50), a
map with the potential distribution of populations with highest LD50values was created (Fig
3). The area identified as the one whereT.infestanspopulations could show highest LD50
includes the border between Bolivia and Argentina (seeS2 Fig), and southward to the east of Salta and north central Santiago del Estero provinces (Argentina). The model predicts a dis-junction area towards the border of La Rioja and San Juan provinces (Argentina) and towards the north of the Cochabamba Department (Bolivia) (seeS3 Fig). The model fails at describing the occurrence of one highly resistant population (Log(LD50)>2.6) in Chuquisaca (-65.25,
-19.05, a population studied by [28]) and 5 populations (out of 13) concentrated at the south of the Guemes Department (Chaco Province, Argentina, seeS4 Fig). The location of the other 40 populations is correct. The model showed a high goodness of fit, with an, AUC = 0.95, pROC = 77.8 (61.9–90.9) and highly robust, with only 3.6% error estimated by the leave-one-out cross validation method.
After identifying the significant model that described the distribution of high and low Log (LD50) groups, separated by the 2.6 threshold, we calculated 3 additional models, using 2, 2.2
and 2.4 as threshold values to separate low and high Log (LD50) groups. All models were
signif-icant, included the same environmental variables and explained over 50% of the variation of the geographic distribution of the newly defined groups. From each model, a map showing the prediction of high Log (LD50) occurrence was produced.Fig 3shows the geographic
Fig 1. Geographic distribution of the 222T.infestanspopulations evaluated for susceptibility to pyrethroids.Red circles: populations identified as resistant by PAHO and WHO criteria (RR50>5 or mortality DD<80%); blue circles: populations identified as susceptible by PAHO and WHO criteria (RR50<
5 or mortality DD>80%).
doi:10.1371/journal.pntd.0004561.g001
Table 1. Number ofT.infestanspopulations studied for pyrethroid resistance according to each criterion (response variable) for resistance
evalu-ation in triatomines.
Criteria (resp. variable) Number of pyrethroid resistant populations Number of pyrethroid susceptible populations Total
PAHO 100 41 141
Z&P 119 22 141
WHO 68 83 151
RR1 162 55 217
RR2 24 117 141
RR3 6 74 80
LD50 48 93 141
Response variables represent different ways of identifying susceptible/resistant populations. PAHO: considers resistant populations with RR50>5. Z&P:
considers resistant populations with RR50>2. WHO: considers resistant a population with mortality<80%. RR1: considers resistant a population that was
classified as resistant by any of the three criteria mentioned above. RR2: considers resistant any population that was classified as resistant by two of the three criteria. RR3: considers resistant any population that was classified as resistant by the three criteria.
distribution of the highest values of Log (LD50) in the four models defined by different
thresh-old values (Log (LD50)>2.0 to Log (LD50)>2.6 with a step of 0.2).
A map of the distribution of the threeT.infestanscytogenetic groups (andean, non-andean and intermediate reported by [21]) and the distribution of Log (LD50) measured onT.infestans
populations shows an almost perfect match between the highly resistantT.infestans popula-tions (Log (LD50)>2.6) and the intermediate cytogenetic group (Fig 3).
Discussion
Pyrethroid insecticides were introduced into the pest control market by the end of 1970, and were rapidly identified as a major tool for the control of agricultural pests and vectors of human diseases [56]. At present, pyrethroid insecticides have a 25% share of the insecticide market, and are used in different formulations in the public health sector because of their effi-cacy, toxicity profile, persistence and low impact over the environment [57–59].
Pyrethroids were incorporated as a tool for the control of domestic triatomines by mid 1980s. The elimination ofT.infestansin wide areas of the Southern Cone Countries of South America and good results in other vector control initiatives showed the high susceptibility of triatomines to pyrethroids [21,39]. The reduction of house infestation byT.infestansis a Table 2. Best GLM models for each response variable as a function of bioclimatic variables (Bioxx). Response variables are of binary type (0,1).
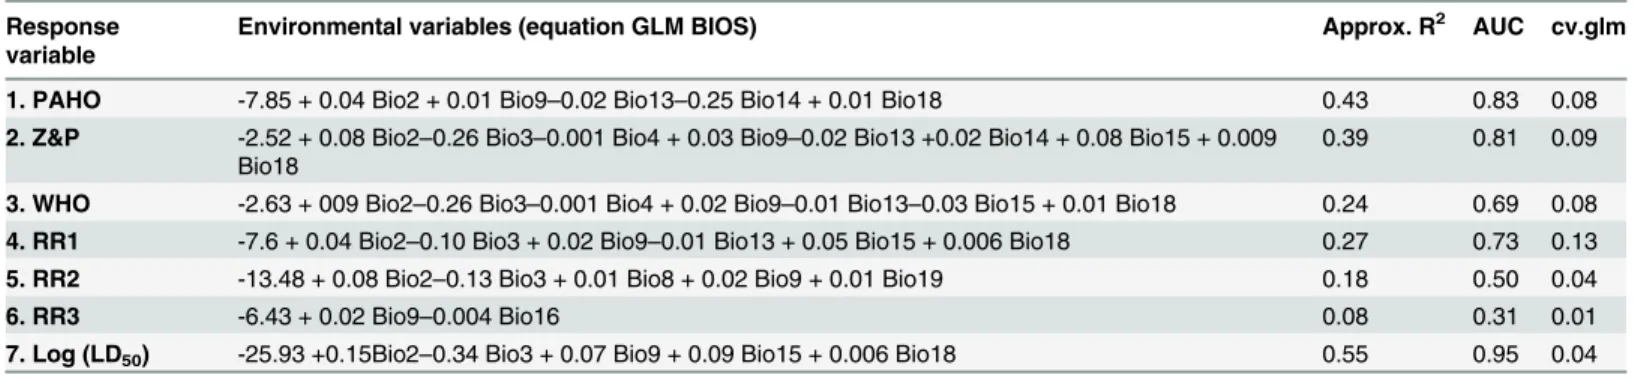
Response variable
Environmental variables (equation GLM BIOS) Approx. R2 AUC cv.glm
1. PAHO -7.85 + 0.04 Bio2 + 0.01 Bio9–0.02 Bio13–0.25 Bio14 + 0.01 Bio18 0.43 0.83 0.08
2. Z&P -2.52 + 0.08 Bio2–0.26 Bio3–0.001 Bio4 + 0.03 Bio9–0.02 Bio13 +0.02 Bio14 + 0.08 Bio15 + 0.009 Bio18
0.39 0.81 0.09
3. WHO -2.63 + 009 Bio2–0.26 Bio3–0.001 Bio4 + 0.02 Bio9–0.01 Bio13–0.03 Bio15 + 0.01 Bio18 0.24 0.69 0.08
4. RR1 -7.6 + 0.04 Bio2–0.10 Bio3 + 0.02 Bio9–0.01 Bio13 + 0.05 Bio15 + 0.006 Bio18 0.27 0.73 0.13
5. RR2 -13.48 + 0.08 Bio2–0.13 Bio3 + 0.01 Bio8 + 0.02 Bio9 + 0.01 Bio19 0.18 0.50 0.04
6. RR3 -6.43 + 0.02 Bio9–0.004 Bio16 0.08 0.31 0.01
7. Log (LD50) -25.93 +0.15Bio2–0.34 Bio3 + 0.07 Bio9 + 0.09 Bio15 + 0.006 Bio18 0.55 0.95 0.04
Approx. R2= residual deviance/null deviances; AUC = Area Under the Receiver Operator Curve; cv.glm = Estimated error Cross-validation from
generalized linear model.
Bio2 = Mean Diurnal Range (Mean of monthly (max temp—min temp)); Bio3 = Isothermality (Bio2/Bio7) (*100); Bio4 = Temperature Seasonality; Bio8 = Mean Temperature of Wettest Quarter; Bio9 = Mean Temperature of Driest Quarter; Bio13 = Precipitation of Wettest Month; Bio14 = Precipitation of Driest Month; Bio14 = Precipitation of Driest Month; Bio15 = Precipitation Seasonality (Coefficient of Variation); Bio16 = Precipitation of Wettest Quarter; Bio18 = Precipitation of Warmest Quarter; Bio19 = Precipitation of Coldest Quarter.
doi:10.1371/journal.pntd.0004561.t002
Fig 2. Frequency distribution of Log (LD50) in theT.infestansstudied populations (n = 141).The value Log (LD50) = 2.6 (equivalent to 13.6 ng a.i./insect) is the threshold value that best separates the two
success story over about 90% of its maximum geographic distribution area. This success is backed by a long history of vector control programs effort that started in the mid 1950s and made the strongest advances through the INCOSUR, coordinated by PAHO. The main tool for the elimination of house infestation byT.infestanswas the application of residual insecticides (particularly pyrethroids). However, other socio-demographic factors, such as rural-urban migration, improvement of house quality in rural areas, community education and/or land use changes had contributed to this trend [60].
Although high impact was obtained in the elimination of intradomestic populations ofT. infes-tansin most parts of the southern cone of South America, houses of several rural communities in the Gran Chaco are still infested byT.infestans. A number of reasons have been mentioned to explain the persistence ofT.infestanspopulations in the area, including low insecticide efficacy when applied to peridomestic structures, unsustainability of vector control interventions, and insecticide resistance. Low pyrethroid efficacy is caused by rapid degradation, as has been shown by field measurements of the residual activity of the insecticide sprayed over wood and adobe [61] and by a number of field studies that repeatedly recorded the persistence of frequent residual popu-lations shortly after the insecticide spraying [62]. In addition to the low efficacy of pyrethroid insec-ticides, the unsustainability of vector control interventions allows the recovery of the even small residual populations ofT.infestans[58,63]. Nevertheless, the majority of the sustained vector con-trol failures in the area still occupied by this vector can be attributed to the factors mentioned (low efficacy of pyrethroid insecticides and unsustainability of vector control interventions).
Resistance in the identified hot spot is higher than in other places and it is apparently inde-pendent of the frequency of insecticide application in the area, that is not different to the fre-quency of insecticide application elsewhere. Therefore, we propose that the occurrence of pyrethroid resistant populations in the border between Argentina and Bolivia is not a primary Fig 3. Location ofT.infestanspopulations analyzed in the present study (circles) and those studied by [21] (stars).Green, yellow and red stars: Non-andean, Andean and Intermediate cyto-genotypes, respectively (sensu [21]. Green (susceptible populations), yellow and red (resistant populations) circles indicate ranges of Log (LD50): -4.0–-0.15, -0.15–2.6, 2.6–5.4, respectively. Coloured background indicates
the gradient of log(DL50) predicted by the GLM (see text): yellow: Log(LD50)>2, to red: Log (LD50)>2.6. A, B
and C rectangular areas are enlarged inS2,S3andS4Figs.
result of the insecticide selection pressure, but a consequence of the existence of naturally toler-ant populations ofT.infestans, shown by the occurrence of resistantT.infestanspopulation of sylvatic origin. The resistance remains high not because of an insecticide-based selection pro-cess, but as a natural selection process acting over a population having a naturally high fre-quency of resistant individuals. A similar interpretation was produced in the review of Mougabure-Cueto and Picollo [28]. The compilation of studies on pyrethroid resistance inT.
infestansanalyzed in this study, shows that the frequency distribution of the Log(LD50) for
pyrethroids is bimodal, with two well spatially separated statistical groups. This is the first time this resistance feature is shown. The significance of these two groups is not clear. It might reflect the spatial heterogeneity of the high genetic variability ofT.infestans, that seems to be one possible cause of the insecticide resistance in the area, even on sylvatic populations ofT.
infestans, never before exposed to the pyrethroids, representing natural and wild toxicological phenotypes. The spatial heterogeneity of the LD50is associated with a combination of 3
tem-perature- and 2 rainfall-derived environmental variables, as shown by the significant fit of the generalized linear model developed in this study. This is the first time the spatial heterogeneity of resistance is shown significantly associated with environmental variables. Panzera et al. [21] speculated that the intermediate cytogenetic group might have appeared recently, as before 1998 house infestation was very low (ranging between 0.5 and 0.8%). These authors suggest that since 1998, and despite continued vector control activities, there has been a gradual increase of insects in houses, reaching house infestation levels of 50 to 80% in 2004. An alterna-tive explanation is that this intermediate cytogenetic group was already in the area and was revealed only after continued vector control activities over a population with high frequency of resistant individuals selected the most resistant ones.
IfT.infestansshowed widespread resistant populations, why is it that control failures have only been reported in a limited area of theT.infestansdistribution, even though pyrethroid insecticides for the control of the species are in use for more than 30 years now? The vector control failure within a limited area might suggest that the resistance in areas outside of the problematic area is not increasing, even though pyrethroid insecticides are in use, at the same frequency during the last 20 years, or even at higher frequency as it occurred during the last decade in some provinces in Argentina [64].
The occurrence of independent resistance mechanisms suggests that the process is wide-spread, but that it is not evolving rapidly, as expected by the demographic features of the spe-cies. Resistance to pyrethroids is widespread over the arid chaco and Andean valleys of Bolivia, although the high level of pyrethroid resistance (and other active ingredients, such as fipronil) occurs around the putative center of dispersion of the species, where the genetic variability is very high, and a particular combination of environmental variables exists.
We do not have enough information about the process that lead to the occurrence of the highly resistantT.infestanspopulations in the hotspot, to produce a meaningful mechanistic model able to analyze the relation between the occurrence of resistant populations ofT.infestansand environ-mental variables. This is a limitation of the study, that can not demonstrate a causal relation between pyrethroid resistance and environmental variables, because the model we based our study on is a statistic one. To be able to demonstrate a causal relationship, we would need a mechanistic model integrating population dynamics, population genetics and environmental variables. Regret-tably, we were not able to find publications compiling a geographic database on population genetics characteristics, equivalent to our compilation on pyrethroid resistance, to carry out an equivalent study on the relationship between environmental variables and population genetics.
the north of Bolivia, but does occur south, down to Santiago del Estero in central Argentina. As we can not claim a causal relation between insecticide resistance and environmental variables, we can not use the resulting model to predict the occurrence of highly resistantT.infestans
populations. However, we can identify the area highlighted by the model as the one that pos-sesses a similar combination of environmental variable values to the one where the highly resis-tantT.infestanspopulations occurs. If there is a causal relation between environment and pyrethroid resistance, then the area identified by the model should be carefully considered as an area of potential occurrence of highly resistantT.infestanspopulations. An important con-sideration should be given to the fact that if insecticide resistance existed in the area, without the need of selection by insecticide pressure, even if the use of pyrethroids is stopped, the fre-quency of resistant individuals will remain high.
The analysis of the relation between RR50and LD50revealed the existence of two groups of
populations in the compiled database. It is difficult to discern the cause of this discrepancy, as it could appear as a consequence of the use of different susceptible populations, or that the studied populations really have a different relation between RR50and LD50. Additional studies
on this relation could determine wether these two population groups are artifacts or not. More importantly, if shown that there is only one linear relationship between RR50and LD50, the use
of RR50for resistance detection should be revised, as it would mean that LD50multiplied by a
constant (the slope) would give the RR50value.
Supporting Information
S1 Table. Compiled database of studies onTriatoma infestanssusceptibility to synthetic pyrethroids.All studies used topical application of 0,2μL of the active ingredient on age and weight standardized first instar nymphs produced by adults collected on domestic, peridomes-tic or sylvaperidomes-tic ecotopes. PAHO, Z&P and WHO columns contains the binary codes (0, 1) iden-tifying susceptible (0) or resistant (1) populations, according to the corresponding three criteria currently used to identify insecticide resistance in Triatominae. LD50: lethal dose 50,
RR50: resistance ratio 50, DD: mortality (%).
(XLS)
S1 Fig. Relation between RR50and LD50of 145T.infestanspopulations.Red circles: data
reported by Germano et al [20,32,36], Carvajal et al [23] and Picollo et al [30], linear function is RR50= -2.02 + 7.53 LD50, R2= 0.99, n = 33; black circles: data reported by the rest of the
authors reported in the compiled database (S1 Table), linear function is RR50= -2.76 + 4.41
LD50, R2= 0.98, n = 112.
(TIFF)
S2 Fig.Fig 1zoomed on rectangle A, over the area where most of highly resistantT. infes-tanspopulations (Log (LD50)>2.6) (red circles) and the intermediate cytogenetic group (red stars) are found.
(TIF)
S3 Fig.Fig 1zoomed on rectangle B, over the Potosi Department (Bolivia) where two highly resistantT.infestanspopulations (Log (LD50)>2.6) (red circles) are correctly iden-tified by the GLM based on environmental variables.
(TIF)
S4 Fig.Fig 1zoomed on rectangle C, over the Chaco province (Argentina) where a concen-trated group of 5 highly resistantT.infestanspopulations (Log (LD50)>2.6) (red circles) were not identified by the GLM based on environmental variables.
Author Contributions
Conceived and designed the experiments: MBG DEG LGD. Analyzed the data: MBG DEG. Wrote the paper: MBG LGD DEG. Compilation of data: MBG.
References
1. World Health Organization. Chagas disease in Latin America: an epidemiological update based on 2010 estimates. Wkly Epidemiol Rec. 2015; 90:33–44 PMID:25671846
2. Coura JR. The main sceneries of Chagas disease transmission. The vectors, blood and oral transmis-sions-A comprehensive review. Mem Inst Oswaldo Cruz. 2015; 110(3):277–82. doi: 10.1590/0074-0276140362PMID:25466622
3. Piccinali RV, Gürtler RE. Fine-scale genetic structure ofTriatoma infestansin the Argentine Chaco. Infect Genet Evol. 2015; 34:143–52. doi:10.1016/j.meegid.2015.05.030PMID:26027923
4. Noireau F, Flores R, Gutierrez T, Dujardin JP. Detection of sylvatic dark morphs ofTriatoma infestans
in the Bolivian Chaco. Mem Inst Oswaldo Cruz. 1997; 92:583–4. PMID:9566222
5. Cortez MR, Emperaire L, Piccinali R, Gürtler RE, Torrico F, Jansen AM, et al. SylvaticTriatoma infes-tans(Reduviidae, Triatominae) in the Andean valleys of Bolivia. Acta Trop. 2007; 102(1):47–54. PMID: 17397789
6. Buitrago R, Waleckx E, Bosseno M-F, Zoveda F, Vidaurre P, Salas R, et al. First report of widespread wild populations ofTriatoma infestans(Reduviidae, Triatominae) in the valleys of La Paz, Bolivia. Am J Trop Med Hyg. 2010; 82(4):574–9. doi:10.4269/ajtmh.2010.09-0325PMID:20348501
7. Ceballos LA, Piccinali RV, Marcet PL, Vazquez-Prokopec GM, Cardinal MV, Schachter-Broide J, et al. Hidden sylvatic foci of the main vector of Chagas diseaseTriatoma infestans: threats to the vector elimi-nation campaign. PLoS Negl Trop Dis. 2011; 5(10):e1365. doi:10.1371/journal.pntd.0001365PMID: 22039559
8. Rolón M, Vega MC, Román F, Gómez A, Rojas de Arias A. First report of colonies of sylvaticTriatoma infestans(Hemiptera: Reduviidae) in the Paraguayan Chaco, using a trained dog. PLoS Negl Trop Dis. 2011; 5(5):e1026. doi:10.1371/journal.pntd.0001026PMID:21572522
9. Bacigalupo A, Torres-Pérez F, Segovia V, García A, Correa JP, Moreno L, et al. Sylvatic foci of the Chagas disease vectorTriatoma infestansin Chile: description of a new focus and challenges for con-trol programs. Mem Inst Oswaldo Cruz. 2010; 105(5):633–41. PMID:20835609
10. Gorla DE. Variables ambientales registradas por sensores remotos como indicadores de la distribución geográfica deTriatoma infestans(Heteroptera: Reduviidae). Ecología austral. 2002; 12(2):117–27.
11. World Health Organization. Control of Chagas disease. Technical Report. Geneva. Switzerland. 1991; Series No. 811.
12. Coura JR, Dias JCP. Epidemiology, control and surveillance of Chagas disease: 100 years after its dis-covery. Mem Inst Oswaldo Cruz. 2009; 104:31–40. PMID:19753455
13. Coura JR. Present situation and new strategies for Chagas disease chemotherapy: a proposal. Mem Inst Oswaldo Cruz. 2009; 104(4):549–54. PMID:19722074
14. Salvatella R, Irabedra P, Castellanos LG. Interruption of vector transmission by native vectors and“the art of the possible”. Mem Inst Oswaldo Cruz. 2014; 109(1):122–30. doi:10.1590/0074-0276140338 PMID:24626310
15. Dias JCP, Silveira AC, Schofield CJ. The impact of Chagas disease control in Latin America: a review. Mem Inst Oswaldo Cruz. 2002; 97(5):603–12. PMID:12219120
16. Schofield CJ, Jannin J, Salvatella R. The future of Chagas disease control. Trends Parasitol. 2006; 22 (12):583–8. PMID:17049308
17. Schofield CJ, Kabayo JP. Trypanosomiasis vector control in Africa and Latin America. Parasit Vectors. 2008; 1(1):24. doi:10.1186/1756-3305-1-24PMID:18673535
18. Schofield CJ, Gorla DE. Vector distribution. Nature Outlook, Suppl, Nature. 2010; 465 S3,
19. Gürtler RE. Sustainability of vector control strategies in the Gran Chaco Region: current challenges and possible approaches. Mem Inst Oswaldo Cruz. 2009; 104:52–9. PMID:19753458
20. Germano MD, Picollo MI, Mougabure-Cueto GA. Microgeographical study of insecticide resistance in
Triatoma infestansfrom Argentina. Acta trop. 2013; 128(3):561–5. doi:10.1016/j.actatropica.2013.08. 007PMID:23962389
22. Germano MD, Picollo MI, Spillmann C, Mougabure-Cueto G. Fenitrothion: an alternative insecticide for the control of deltamethrin-resistant populations ofTriatoma infestansin Northern Argentina. 2013b; Med. Vet. Entomol. 28(1): 21–25.
23. Carvajal G, Mougabure-Cueto G, Tolosa AC. Toxicity of non-pyrethroid insecticides againstTriatoma infestans(Hemiptera: Reduviidae). Mem Inst Oswaldo Cruz 2012; 107(5): 675–679. PMID:22850959
24. Gurevitz JM, Gaspe MS, Enríquez GF, Vassena CV, Alvarado-Otegui JA, Provecho YM, et al. Unex-pected failures to control Chagas disease vectors with pyrethroid spraying in northern Argentina. J Med Entomol. 2012; 49(6):1379–86. PMID:23270166
25. Cecere MC, Vazquez-Prokopec GM, Ceballos LA, Boragno S, Zárate JE, Kitron U, et al. Improved chemical control of Chagas disease vectors in the dry Chaco region. J Med Entomol. 2013; 50(2):394– 403. PMID:23540129
26. Gaspe MS, Gurevitz JM, Gürtler RE, Dujardin J-P. Origins of house reinfestation withTriatoma infes-tansafter insecticide spraying in the Argentine Chaco using wing geometric morphometry. Infect Genet Evol. 2013; 17:93–100. doi:10.1016/j.meegid.2013.03.044PMID:23557838
27. Crow JF. Genetics of insect resistance to chemicals. Annual review of entomology. 1957; 2(1):227–46.
28. Mougabure-Cueto G, Picollo MI. Insecticide resistance in vector Chagas Disease: evolution, mecha-nisms and management. Acta Trop. 2015; 149:70–85. doi:10.1016/j.actatropica.2015.05.014PMID: 26003952
29. Vassena C, Picollo M, Zerba E. Insecticide resistance in BrazilianTriatoma infestansand Venezuelan
Rhodnius prolixus. Med Vet Entomol. 2000; 14(1):51–5. PMID:10759312
30. Picollo MI, Vassena C, Santo Orihuela P, Barrios S, Zaidemberg M, Zerba E. High resistance to pyre-throid insecticides associated with ineffective field treatments inTriatoma infestans(Hemiptera: Redu-viidae) from Northern Argentina. J Med Entomol. 2005; 42(4):637–42. PMID:16119553
31. Santo Orihuela PL, Vassena CV, Zerba EN, Picollo MI. Relative contribution of monooxygenase and esterase to pyrethroid resistance inTriatoma infestans(Hemiptera: Reduviidae) from Argentina and Bolivia. J Med Entomol. 2008; 45(2):298–306. PMID:18402146
32. Germano M, Acevedo GR, Cueto GM, Toloza A, Vassena C, Picollo M. New findings of insecticide resistance inTriatoma infestans(Heteroptera: Reduviidae) from the Gran Chaco. J Med Entomol. 2010; 47(6):1077–81. PMID:21175056
33. Lardeux F, Depickère S, Duchon S, Chavez T. Insecticide resistance ofTriatoma infestans(Hemiptera, Reduviidae) vector of Chagas disease in Bolivia. Trop Med Int Health. 2010; 15(9):1037–48. doi:10. 1111/j.1365-3156.2010.02573.xPMID:20545921
34. Acevedo GR, Cueto GM, Germano M, Santo Orihuela P, Cortez MR, Noireau F, et al. Susceptibility of sylvaticTriatoma infestansfrom Andeans valleys of Bolivia to deltamethrin and fipronil. J Med Entomol. 2011; 48(4):828–35. PMID:21845942
35. Fabro J, Sterkel M, Capriotti N, Mougabure-Cueto G, Germano M, Rivera-Pomar R, et al. Identification of a point mutation associated with pyrethroid resistance in the para-type sodium channel ofTriatoma infestans, a vector of Chagas’disease. Infec Genet Evol. 2012; 12(2):487–91.
36. Germano M, Santo-Orihuela P, Roca-Acevedo G, Toloza A, Vassena C, Picollo M, et al. Scientific evi-dence of three different insecticide-resistant profiles inTriatoma infestans(Hemiptera: Reduviidae) populations from Argentina and Bolivia. J Medical Entomol. 2012; 49(6):1355–60.
37. Depickère S, Buitrago R, Siñani E, Baune M, Monje M, Lopez R, et al. Susceptibility and resistance to deltamethrin of wild and domestic populations ofTriatoma infestans(Reduviidae: Triatominae) in Bolivia: new discoveries. Mem Inst Oswaldo Cruz. 2012; 107(8):1042–7. PMID:23295756
38. Gomez MB, Pessoa G, García ALO, Cortez MR, Rosa ACL, Noireau F, Diotaiuti LG. Susceptibility to deltamethrin of wild and domestic populations ofTriatoma infestansof the Gran Chaco and the Inter-Andean Valleys of Bolivia. Parasit Vectors. 2014; 7:497. doi:10.1186/s13071-014-0497-3PMID: 25394392
39. Schofield C, Dias J. The Southern cone initiative against Chagas disease. Adv Parasitol. 1999; 42:1– 27. PMID:10050271
40. Gorla DE. Perspectivas biológicas y ecológicas para el desarrollo de resistencia en Triatominos. Insect Sci Applic. 1994; 9(2):233–6.
41. Capriotti N, Mougabure-Cueto G, Rivera-Pomar R, Ons S. L925I Mutation in the Para-Type Sodium Channel Is Associated with Pyrethroid Resistance inTriatoma infestansfrom the Gran Chaco Region. PLoS Negl Trop Dis. 2014; 8(1):e2659. doi:10.1371/journal.pntd.0002659PMID:24466362
43. Bargues M, Klisiowicz D, Panzera F, Noireau F, Marcilla A, Perez R, et al. Origin and phylogeography of the Chagas disease main vectorTriatoma infestansbased on nuclear rDNA sequences and genome size. Infection, Genetics and Evolution. 2006; 6(1):46–62. PMID:16376840
44. De Rosas ARP, Segura EL, Fichera L, García BA. Macrogeographic and microgeographic genetic structure of the Chagas’disease vectorTriatoma infestans(Hemiptera: Reduviidae) from Catamarca, Argentina. Genetica. 2008; 133(3):247–60. PMID:17885811
45. Perez De Rosas AR, Segura EL, Garcia BA. Microsatellite analysis of genetic structure in natural Tria-toma infestans(Hemiptera: Reduviidae) populations from Argentina: its implication in assessing the effectiveness of Chagas’disease vector control programmes. Mol Ecol. 2007; 16(7):1401–12. PMID: 17391265
46. Foster SP, Harrington R, Devonshire AL, Denholm I, Devine GJ, Kenward MG, Bale JS. Comparative survival of insecticide-susceptible and resistant peach-potato aphids,Myzus persicae(Sulzer) (Hemi-ptera: Aphididae), in low temperature field trials. 1996; Bulletin of Entomological Research 86(1): 17– 27.
47. Hoffmann A and Willi Y. Detecting genetic responses to environmental change. Nature Genetics 2008; 9, 421–432.
48. Boivin T, Bouvier JC, Beslay D, Sauphanor B. 2003. Phenological segregation of insecticide resistance alleles in the codling mothCydia pomonella(Lepidoptera: Tortricidae): a case study of ecological diver-gences associated with adaptive changes in populations. Genetical Research 81(3): 169–177. PMID: 12929908
49. Menu F, Ginoux M, Rajon E, Lazzari CR, Rabinovich JE. 2010. Adaptive development delay in Chagas disease vectors: an evolotionary ecology approach. PLoS Negl Trop Dis 4(5): e691. doi:10.1371/ journal.pntd.0000691PMID:20520796
50. Gurgel-Gonçalves R, Galvao C, Costa J, Peterson AT. Geographic distribution of Chagas disease vec-tors in Brazil based on ecological niche modeling. J Trop Med. 2012; 2012:705326. doi:10.1155/2012/ 705326PMID:22523500
51. Pan American Health Organization: II Reunion técnica latinoamericana de monitoreo de resistencia a insecticidas en triatominos vectores de Chagas. Panamá 2005.
52. Zerba EN, PicolloMI. Resistencia a insecticidas piretroides enTriatoma infestans. Centro de Investiga-ciones de Plagas e Insecticidas (CIPEIN) CITEFA-CONICET. Buenos Aires, Argentina. 2002.
53. World Health Organization. Guidelines for Testing Mosquito Adulticides for Indoor Residual Spraying and Treatment of Mosquito Nets. WHO/CDS/NTD/WHOPES / GCDPP/ 2006. 2006; p. 1–60.
54. Hijmans R, Cameron S, Parra J, Jones P, Jarvis A. WorldClim, version 1.3. University of California, Berkeleyhttp://biogeoberkeleyedu/worldclim/worldclimhtm. 2005.
55. Elith J, Leathwick JR. Species distribution models: ecological explanation and prediction across space and time. Annual Review of Ecology, Evolution, and Systematics. 2009; 40(1):677.
56. Casida JE, Quistad GB. Golden age of insecticide research: past, present, or future? Annu Rev Ento-mol. 1998; 43(1):1–16.
57. Hemingway J, Hawkes NJ, McCarroll L, Ranson H. The molecular basis of insecticide resistance in mosquitoes. Insect Biochem Mol Biol. 2004; 34(7):653–65. PMID:15242706
58. Gürtler RE, Kitron U, Cecere MC, Segura EL, Cohen JE. Sustainable vector control and management of Chagas disease in the Gran Chaco, Argentina. Proc Natl Acad Sci U S A. 2007; 104(41):16194–9. PMID:17913895
59. Gorla D, Ponce C, Dujardin J-P, Schofield C. Control strategies against Triatominae. In: Telleria J, Tibayrenc M, editors. American trypanosomiasis Chagas disease one hundred years of research. Elsevier; 2010. pp. 233–45.
60. Hoyos LE, Cingolani AM, Zak MR, Vaieretti MV, Gorla DE, Cabido MR. Deforestation and precipitation pat-terns in the arid Chaco forests of central Argentina. Applied Vegetation Science. 2013; 16(2):260–71.
61. Gürtler RE, Canale DM, Spillmann C, Stariolo R, Salomón OD, Blanco S, et al. Effectiveness of residual spraying of peridomestic ecotopes with deltamethrin and permethrin onTriatoma infestansin rural western Argentina: a district-wide randomized trial. Bulletin of the World Health Organization. 2004; 82 (3):196–205. PMID:15112008
62. Porcasi X, Hrellac H, Catalá S, Moreno M, Abrahan L, Hernandez L, et al. Infestation of rural houses by
Triatoma infestansin the region of Los Llanos (La Rioja, Argentina). Mem Inst Oswaldo Cruz. 2007; 102(1):63–8. PMID:17294001
63. Gorla DE. Population dynamics and control ofTriatoma infestans. Med Vet Entomol. 1992; 6(2):91–7. PMID:1421494
![Fig 3. Location of T . infestans populations analyzed in the present study (circles) and those studied by [21] (stars)](https://thumb-eu.123doks.com/thumbv2/123dok_br/18340231.351900/10.918.311.773.112.463/location-infestans-populations-analyzed-present-study-circles-studied.webp)
