Cortical Response Similarities Predict which
Audiovisual Clips Individuals Viewed, but Are
Unrelated to Clip Preference
David A. Bridwell1*, Cullen Roth1,2,3,4, Cota Navin Gupta1, Vince D. Calhoun1,5
1The Mind Research Network, Albuquerque, New Mexico, United States of America,2Department of Mathematics and Statistics, University of New Mexico, Albuquerque, New Mexico, United States of America,
3Department of Biology, IMSD, University of New Mexico, Albuquerque, New Mexico, United States of America,4Program in Genetics and Genomics, Duke University, North Carolina, United States of America,
5Department of ECE, University of New Mexico, Albuquerque, New Mexico, United States of America
Abstract
Cortical responses to complex natural stimuli can be isolated by examining the relationship between neural measures obtained while multiple individuals view the same stimuli. These inter-subject correlation’s (ISC’s) emerge from similarities in individual’s cortical response
to the shared audiovisual inputs, which may be related to their emergent cognitive and per-ceptual experience. Within the present study, our goal is to examine the utility of using ISC’s
for predicting which audiovisual clips individuals viewed, and to examine the relationship between neural responses to natural stimuli and subjective reports. The ability to predict which clips individuals viewed depends on the relationship of the EEG response across subjects and the nature in which this information is aggregated. We conceived of three ap-proaches for aggregating responses, i.e. three assignment algorithms, which we evaluated in Experiment 1A. The aggregate correlations algorithm generated the highest assignment accuracy (70.83% chance = 33.33%) and was selected as the assignment algorithm for the larger sample of individuals and clips within Experiment 1B. The overall assignment accura-cy was 33.46% within Experiment 1B (chance = 06.25%), with accuracies ranging from 52.9% (Silver Linings Playbook) to 11.75% (Seinfeld) within individual clips. ISC’s were
sig-nificantly greater than zero for 15 out of 16 clips, and fluctuations within the delta frequency band (i.e. 0-4 Hz) primarily contributed to response similarities across subjects. Interesting-ly, there was insufficient evidence to indicate that individuals with greater similarities in clip preference demonstrate greater similarities in cortical responses, suggesting a lack of asso-ciation between ISC and clip preference. Overall these results demonstrate the utility of using ISC’s for prediction, and further characterize the relationship between ISC
magni-tudes and subjective reports.
a11111
OPEN ACCESS
Citation:Bridwell DA, Roth C, Gupta CN, Calhoun VD (2015) Cortical Response Similarities Predict which Audiovisual Clips Individuals Viewed, but Are Unrelated to Clip Preference. PLoS ONE 10(6): e0128833. doi:10.1371/journal.pone.0128833
Academic Editor:Jyrki Ahveninen, Harvard Medical School/Massachusetts General Hospital, UNITED STATES
Received:January 2, 2015
Accepted:April 30, 2015
Published:June 1, 2015
Copyright:© 2015 Bridwell et al. This is an open access article distributed under the terms of the Creative Commons Attribution License, which permits unrestricted use, distribution, and reproduction in any medium, provided the original author and source are credited.
Data Availability Statement:The de-identified data is publicly available within COINS. The user may access the data athttps://portal.mrn.org/micis/index. php?subsite = dxby creating an account, entering "Data Exchange", entering "Study Information", and selecting "MOVIEDATA".
Introduction
Individuals experience a broad range of perceptual and cognitive events throughout the day. This complexity is approximated by the complexity of the experience of watching short movies or audiovisual clips, which may invoke a greater array of emotional and perceptual experiences than traditional cognitive experiments [1]. However, the diversity of cognitive experience is paralleled by the resultant diversity in neural responses to the stimulus [2,3]. In order to better characterize these responses, it is important to understand the relationship between neural re-sponses to natural stimuli and subjective reports, and to develop approaches to understand the information that may be retrieved (i.e. decoded) from cortical responses to complex stimuli.
Cortical responses may emerge from natural stimuli as either evoked oscillations (i.e. evoked potentials) from the stimuli, or phase entrainment (i.e. phase tracking) to the stimulus features [4,5]. These responses may be mediated in part by individual’s preference toward the stimulus, which may be interrelated with their attentional and emotional engagement with the stimulus content [6]. These factors contribute to the characteristics of electroencephalography (EEG) or magnetoencephalography (MEG) responses that may be preserved across subjects viewing the same stimulus, which would facilitate the ability to integrate information across multiple sub-jects for predicting the audiovisual clip that an individual viewed.
The relationship between neural time series may be examined across individuals using Pear-son’s correlation coefficient, or inter-subject correlation’s (ISC’s) [7–9]. Within the present study, we examine the utility of using EEG ISC’s for predicting which audiovisual clips individ-uals viewed. The approach emphasizes the relationship between responses measured across multiple individuals viewing the same stimulus, providing a means to extract information from complex stimuli without explicitly extracting the low and high level auditory and visual fea-tures presented. In this manner, the utility of predicting which clips individuals viewed de-pends on the relationship of the EEG response across subjects and the nature in which this information is aggregated. We conceived of three approaches for aggregating responses, i.e. three assignment algorithms, which we implement to examine the utility of ISC’s for assigning individual EEG segments to one of the 16 audiovisual clips presented.
Since ISC’s may emerge from similarities in the direct neural response to the audiovisual in-puts, as well as similarities in their emergent perceptual experience [10,11], we additionally ex-amined whether individuals with similar clip preferences had similar cortical responses to the clips. These findings add to previous studies which focus on the relationship between ISC’s and individuals subjective experience of natural stimuli, including whether they perceive the clip to invoke negative or positive emotions (i.e. the clips valence), whether they perceive the clip to invoke a low or high level of arousal or emotional response, and whether they enjoyed the clip content [6,12,13].
The relationship between ISC’s and valence and arousal appears mixed, however, with rela-tionships demonstrated in some cases [6], but not others [13]. These differences may be related to the differences in clip content between the two studies, with Nummenmaa et al., 2012 pre-senting 13 short (i.e. ~30 sec to ~2 min.) clips characterized by discrete changes in valence and arousal, while Jääskeläinen et al., 2008 presented a continuous 30 minute clip with fewer dis-crete changes in valence/arousal. Thus, ISC’s may show a greater increase when the eliciting events are well defined, but may be insensitive to subtle fluctuations in valence/arousal from longer segments primarily characterized by low arousal or neutral valence.
The nuanced relationship between subjective reports and ISC’s is further demonstrated by a recent study by Dmochowski et al., 2014. The authors examined the relationship between EEG ISC magnitudes (measured while individuals watched Super Bowl advertisements) with the preference of the broad population and the preference of the individuals within the study. They Competing Interests:The authors have declared
found that the EEG response similarities explained 66% of the variance of population ratings, but only 26% of the variance of the individuals own preferences. Thus, EEG ISC’s appear better at predicting the preferences expressed by a broad audience than the preferences obtained di-rectly from the individuals in which the ISC’s are measured [12].
Within the present study, our primary goal is to examine the utility of using ISC’s for pre-dicting which clips individuals viewed. Within Experiment 1A, we examine the prediction ac-curacy of three different assignment algorithms which emphasize different aspects of similarity across subjects. The algorithm is implemented within Experiment 1B in a larger sample view-ing a diverse array of audiovisual clips. Within Experiment 1B, we recommend the best per-forming algorithm for future studies implementing EEG ISC’s for prediction. In order to understand the relationship between ISC’s and individual’s perceptual experience, within Ex-periment 1B we additionally examined whether ISC’s were related to individual preference. We were unable to demonstrate a statistical relationship between ISC’s and preference, which sug-gests that this measure of subjective experience is unrelated to cortical response similarities across subjects.
Materials and Methods (Experiment 1A)
Participants
Two subjects (2 males, 22 and 31 years old) were recruited to participate inalgorithm selec-tionsessions in order to select the assignment algorithm to predict which video clips subjects watched within the main experiment. Each individual had normal or corrected to normal vi-sion and had no family history of mental illness. Both participants were enrolled in protocols approved by the University of New Mexico Institutional Review Board (HRRC/MCIRB), and provided informed written consent prior to the first session at the Mind Research Network.
Design and Stimuli
The video clips were presented on a computer using VLC media player. Participants were seated 56 cm from the computer screen, and the VLC media player window comprised 13.2 de-gree visual angle (dva) horizontally and 7.4 dva vertically. The audio was presented to the indi-vidual through speakers placed adjacent the monitor. On average, the audio intensity was ~ 90 decibels (db) across all clips, and the maximum intensity never exceeded ~95 db (calibrated 4 inches away from the speakers). Two individuals participated in four sessions each consisting of three ~4:56 min video clips (Table 1) presented in a fixed order. The 3 clips for algorithm se-lection were primarily composed of comedic speech. Many of the 16 test clips contain comedic content, and the auditory information within the test clips is predominantly speech, thus there is considerable overlap between the content of the 3 clips for algorithm selection (Experiment 1A) and the content of the 16 test clips (Experiment 1B).
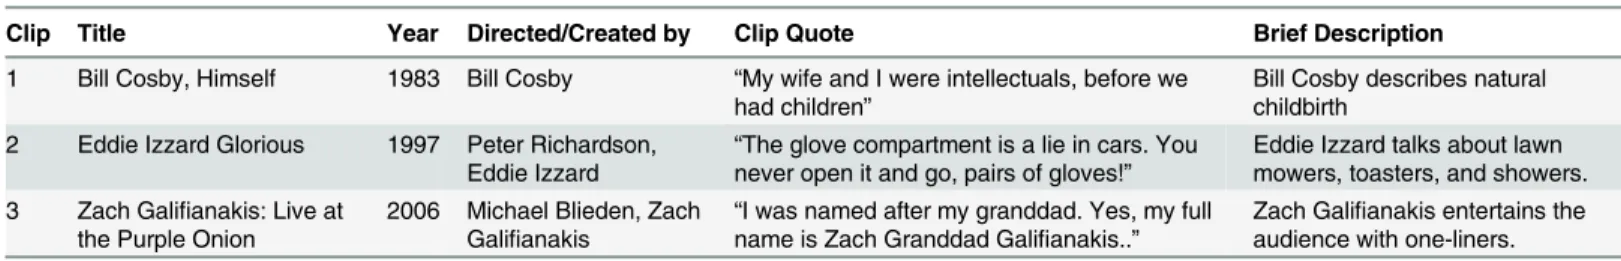
Table 1. Filmography: Detailed information about the video clips displayed within the algorithm selection sessions.
Clip Title Year Directed/Created by Clip Quote Brief Description
1 Bill Cosby, Himself 1983 Bill Cosby “My wife and I were intellectuals, before we had children”
Bill Cosby describes natural childbirth
2 Eddie Izzard Glorious 1997 Peter Richardson,
Eddie Izzard “never open it and go, pairs of gloves!The glove compartment is a lie in cars. You”
Eddie Izzard talks about lawn mowers, toasters, and showers. 3 Zach Galifianakis: Live at
the Purple Onion 2006 Michael Blieden, ZachGalifianakis “name is Zach Granddad GaliI was named after my granddad. Yes, my fullfianakis..”
Zach Galifianakis entertains the audience with one-liners.
EEG acquisition and preprocessing
EEG responses were collected with two 4 channel CamNtech Actiwave mobile EEG devices (sampling rate: 128 Hz). The eight electrodes where placed on the participant’s scalp using the standard 10–20 locations F3, Fz, F4, Cz, P3, P4, O1, and O2, with a left mastoid reference (e.g. see [14]). EEG analysis was conducted in MATLAB using custom and built-in functions. The EEG data was linearly detrended and forward and backward filtered with a Butterworth filter (bandpass: 0.01 to 50 Hz).
The continuous EEG recordings were segmented into individual segments for each ~4:56 min video clip. The time-courses were visually inspected for each electrode and segment (i.e. clip) and artifactual time-courses were marked for removal before averaging across time series, as described in detail below. Artifactual segments typically contained multiple segments of large amplitude fluctuations. 4.87 out of 24 (3 clips × 8 electrodes) segments were removed on average.
Correlation and video clip assignments
Our goal was to assign a particular EEG segment measured with a given individual to 1 of the 3 video clips. To illustrate this specifically, consider determining which video clip an individual watched while we recorded 1 of the 3 [8 channels × 37940 samples] EEG segments in an indi-vidual session. The general approach was to assign this segment, which we refer to as the with-held segment, to one of the three clips using the segments recorded in the other sessions (i.e. sessions 2–8), when subjects watched each of the three clips. In this example, we refer to the segments from sessions 2–8 as the reference segments.
The relationship between the withheld segment and the reference segments were examined by calculating the electrode-wise Pearson correlation coefficient between the time series. We conceived of three potential ways in which the time series may be related across subjects, which motivated the three assignment algorithms that were evaluated within Experiment 1A (Fig 1). The algorithms differ with respect to whether the reference segments were averaged before cal-culating the correlation with the withheld segment, and whether the correlation between the reference and withheld segments were averaged prior to the assignment. These three ap-proaches, which we term the aggregate time series approach, the separate time series approach, and the aggregate correlations approach, are described in detail below.
In the separate time series approach (Fig 1a) electrode-wise correlations were computed be-tween the withheld segment and the time series of the individual reference segments generating 168 correlation values (3 clips × 8 electrodes × 7 remaining sessions). The maximum correla-tion was identified and the video clip that corresponded to that EEG segment was assigned to that particular withheld segment. This approach preserves the relationship between pairs of subjects, which is advantageous in instances where only a subset of subjects demonstrate a sim-ilar response to a given clip.
Fig 1. Three assignment algorithms.Individual [channel × time] segments were assigned to one of the video clips using the separate time series approach (a), the aggregate time series approach (b) or the aggregate correlations approach (c). Within (a), electrode-wise correlations are computed between the
withheld segmentand thereference segments(i.e. the segments recorded within all other sessions and clips). The reference segment which contributes to
In the aggregate correlations approach (Fig 1c) correlations were computed between the withheld segment and the time series of the individual reference segments. These correlation values were then averaged across the reference segments that correspond to the same clip, gen-erating 24 correlation values for evaluation (3 clips × 8 electrodes). As in the other approaches, the maximum correlation was identified and the video clip that corresponded to the EEG seg-ment that contributed to the calculation was assigned to that particular withheld segseg-ment. This approach integrates information from multiple subjects similar to the aggregate time series ap-proach, but preserves similarities in the evoked potential within subject pairs which might be obscured when averaging across all subjects.
Within each of the three approaches, assignments were computed for each of the 24 with-held segments, and assignment accuracy was evaluated by determining the percentage of seg-ments which were correctly assigned. The algorithm with the highest assignment accuracy was then used to predict which of the 16 video clips corresponded to each segment within the main experiment.
Results (Experiment 1A)
Algorithm selection and assignment accuracy
Fourteen, 13, and 17 of the EEG segments were correctly assigned to 1 of 3 clips using the sepa-rate time series (Fig 1a), aggregate time series (Fig 1b), and aggregate correlations (Fig 1c) as-signment algorithms respectively. Among the 24 recorded segments, asas-signment accuracies were 58.33%, 54.17%, and 70.83% (chance = 33.33%), with the highest assignment accuracy with the aggregate correlations approach. Thus, we observed a 30.76% and 21.43% increase in assignment accuracy between the aggregate correlations approach and the separate time series and aggregate time series approaches, respectively. Based on these findings, the aggregate cor-relations approach was selected as the assignment algorithm within the data collected in Exper-iment 1B.
Materials and Methods (Experiment 1B)
Participants
Eighteen subjects (12 males) between the ages 20 and 35 were recruited to participate. One in-dividual was excluded due to artifactual EEG, bringing the total number of participants to 17. Each individual had normal or corrected to normal vision and had no family history of mental illness. All participants were enrolled in protocols approved by the University of New Mexico Institutional Review Board (HRRC/MCIRB), and provided informed written consent prior to the first session at the Mind Research Network.
Design and Stimuli
The viewing distance and audio levels were identical to Experiment 1A. Eighteen individuals viewed sixteen clips (Table 2) within a single session, with clip durations between 3:55 and 3:59 min. The 16 clips were displayed in blocks of four, and subjects took a short break between each block. The order of the 16 clips were balanced across subjects using a Latin square design. The Latin square consisted of a 16 × 16 matrix with the elements 1, 2,. . .16 such that no instances where only a subset of subjects demonstrate a similar response on a given clip, (b) is advantageous in instances where subjects demonstrate similar cortical responses within a clip, and when these similarities would be obscured when averaging across time series (as in c). C preserves the similarities in the time series across individuals, and is thus advantageous when the majority of individual’s demonstrate similar responses to the clips, and averaging time series enhances these similarities (i.e. the signal).
element repeated within a given row or column. Subjects were instructed to silence their cell phones, to minimize movements and to“relax and enjoy the show”. Subjects ranked the 16 clips at the end of the session by preference, rated each clip on a scale of 1 to 5, with 1 repre-senting“hated it”and 5 representing“loved it”, and indicated whether they had seen the con-tent of each clip before.
EEG acquisition, preprocessing, and wavelet decomposition
The continuous EEG recordings were acquired (see Experiment 1A) and segmented into ~ 4:00 min intervals for each video clip. Segments were preprocessed as described in Experiment 1A (section 2.1.3). In order to determine the frequency that contributes to ISC’s, the EEG time se-ries were decomposed into time-frequency representations using the discrete wavelet trans-form (DWT) prior to ISC calculations. We chose multiresolution analysis (MRA) [15,16] by DWT since it provides an improved localization and resolution of EEG features compared to conventional digital filtering [17]. The biorthogonal spline mother wavelet was used since they
Table 2. Filmography: Detailed information about the video clips displayed within the main experiment. Clip Title Year Directed/Created by Content
Summary
Clip Quote Brief Description
1 50/50 2011 Jonathan Levine Romance “Did I just score your digits” A client expresses interest in his therapist.
2 Requiem for a Dream
2000 Darren Aronofsky Drama “Are you on uppers ma? A son confronts his mother about taking pills.
3 Who’s Afraid of Virginia Woolf
1966 Mike Nichols Drama “Decency Martha” A couple argues in front of their guests.
4 The Office (Season 2, Ep. 1)
2005 Ricky Gervais, Stephen Merchant, Greg Daniels
Romance “And the award for whitest sneakers goes to:”
Two co-workers express their latent romantic attractions.
5 Vanilla Sky 2001 Cameron Crowe Romance “Do you ever accept any of your 12,000 proposals?”
A manflirts with a woman he met at a party.
6 Silver Linings Playbook
2012 David O. Russell Awkward social interaction “
you say more inappropriate things than appropriate things”
A man meets and interacts awkwardly with another woman.
7 Jim Gaffigan, King Baby
2009 Troy Miller Comedy
(stand-up) “
my parents never took me camping, because they loved me”
Jim Gaffigan describes the downsides of camping
8 West Wing
(Season 2, Ep. 3) 2000 Aaron Sorkin Drama “Nobody sits” The president confronts a conservativeradio host about gay marriage. 9 Meet Joe Black 1998 Martin Brest Romance “you could be her” A manflirts with a woman sitting next to
him. 10 Good Will
Hunting 1997 Gus Van Sant Socialinteraction “my boy is wicked smart” The protagonist out intellectualizes anintellectual in front of women at a bar. 11 Breaking Bad
(Season 5, Ep. 6) 2012 Vince Gilligan Awkward socialinteraction “my affair?Did you also tell him about”
An awkward conversation over dinner.
12 Bill Cosby,
Himself 1983 Bill Cosby Comedy (stand-up) “chocolate cake!Dad is great! Gave us the”
Bill Cosby describes when he fed his children chocolate cake for breakfast. 13 Friends(Season
4, Ep. 1) 1997 Marta Kauffman, DavidCrane Comedy “It stung real bad” The friends disclose that one was stungby a jellyfish and the other peed on the sting.
14 Ellen, One Night
Stand 2003 Joel Gallen Comedy (stand-up) “glass window?you ever walk into a plate”
Ellen describes awkward social interactions.
15 Fargo 1996 Joel Coen, Ethan Coen Awkward social
interaction “I like you so much Marge” A woman has an awkward conversationwith an old friend. 16 Seinfeld 1998 Marty Callner Comedy
(stand-up) “marrying himIf I’m the best man why is she”
Seinfeld talks about candy, chopsticks, McDonalds, and being a best man at a wedding.
have optimal mathematical characteristics (i.e. they are anti-symmetric, smooth, and have opti-mal time-frequency resolution (compact support)) [18,19] and since their shape is similar to evoked potentials [20]. Detailed descriptions of the WT are provided in [21–23]. In general, the DWT filters the input signal by multiple matched filters that are shifted and scaled. Wavelet coefficients are computed for each filter by an integral transform and the original signal is re-constructed using the inverse WT. Conceptually, patterns within the original signal are pre-served when they match the pattern of the filter. Different frequencies are emphasized by scaling and shifting the filter at each level of the DWT, generating filtered representations of the original signal within the characteristic EEG frequency bands [24–26].
Five levels of DWT were implemented using the wavedec and wrcoef functions in matlab with a biorthogonal spline wavelet (bior3.9; dyadic decomposition). Each level of decomposi-tion returns two time-frequency representadecomposi-tions with half the frequency band of the input, a course representation (i.e. the approximation A), and a high frequency representation (i.e. the detail, D). With a 128 Hz signal, the first level of decomposition returns an approximation A containing ~0–32 Hz and its associated detail, D encompassing ~32–64 Hz. At the second level, the approximation AA is ~0–16 Hz and the detail AD is ~16–32 Hz. Following this con-vention, we focus analysis on the following details and approximations which approximately overlap with the characteristic EEG frequencies: delta (AAAA; ~0–4 Hz), theta (AAAD; ~4–8 Hz), alpha (AAD; ~8–16 Hz), beta (AD; ~16–32 Hz), gamma (DA: ~32–48).
Correlation and video clip assignments
Individual [8 channels × 30721 samples] segments were assigned to 1 of the 16 video clips using the aggregate correlations algorithm (Fig 1c), i.e. the algorithm with the highest assign-ment accuracy within Experiassign-ment 1A.
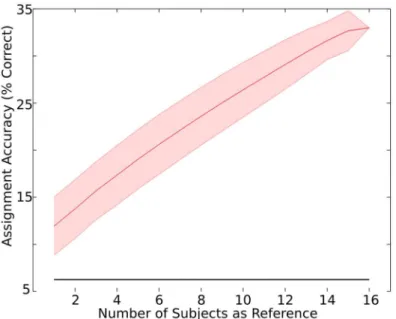
Dependence on the number of subjects
The assignment accuracy likely depends on the number of subjects that contribute to the ref-erence segments in the assignment. We evaluated the nature of this dependence when N = 1, 2, 3. . .16 subjects were used as reference. When N<16, an individual withheld segment is
assigned to a particular video clip using all of the unique combinations of subjects from the pool of 16. For example, in the instance where 2 subjects are used as reference, there are 120 unique combinations of the 16 subjects available. The average and standard deviation of these assignment accuracies were examined for each unique combination of subjects, gener-ated with N = 1, 2, 3,. . .16 subjects in the assignment.
Statistical Analysis
Statistical tests were conducted to determine whether ISC’s were significantly greater than zero for each of the 16 clips (16 permutation tests). Additional tests (Pearson’s r) were conducted to determine whether there was a relationship between ISC magnitudes and individual clip pref-erences, and ISC magnitudes and assignment accuracy. Statistical tests are reported as signifi-cant if p<0.0028, which conservatively corrects for the 18 tests (i.e. with alpha = .05 and 18 tests, Bonferroni corrected p-values are = 0.0028).
Results (Experiment 1B)
ISC
’
s within different wavelet frequencies
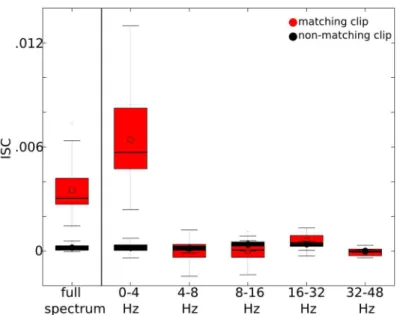
segments that correspond to matching clips and non-matching clips. For example, for a given pair of subjects, 16 correlations were computed among matching segment pairs (16 movies) and 120 correlations were computed among unique non-matching segment pairs. The 2048 matching correlations (16 clips × 8 electrodes × 16 remaining subjects) were averaged for each individual, and the distribution of individual averages is indicated inFig 2when ISC’s were computed from the broadband EEG signal (0–50 Hz) or the wavelet filtered signals.
The overall average ISC increased from .0035 with the broadband EEG signal (0–50 Hz) to .0064 with the signal filtered between 0–4 Hz (Fig 2). The other frequency bands (i.e. 4–8 Hz, 8–16 Hz, 16–32 Hz, and 32–48 Hz) have negligible contribution to ISC’s. Thus, it appears that the low frequency (i.e. delta) EEG content primarily contributes to the observed similarities in responses across subjects. Based on this finding, we focus our subsequent analysis on ISC’s computed from the 0–4 Hz filtered signal.
Average ISC
’
s for each of the 16 clips
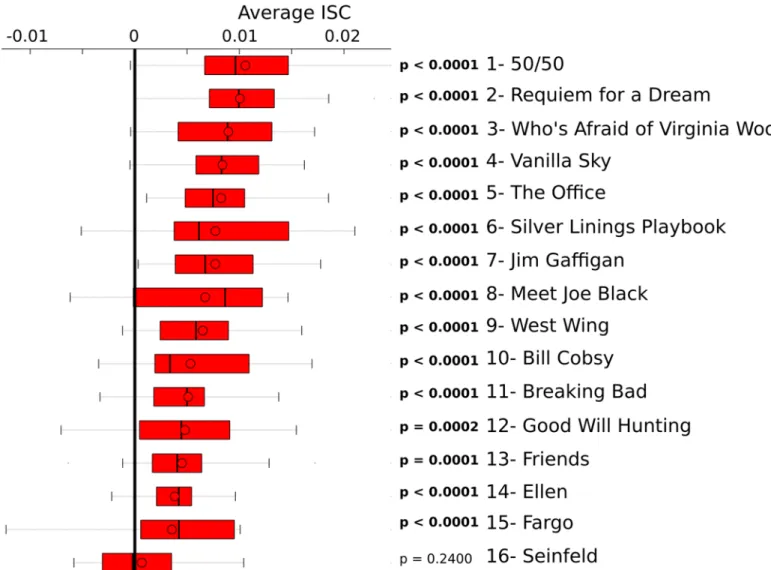
Individual ISC’s (N = 17) were computed for each clip by averaging the correlations computed among 128 segment pairs (8 electrodes × 16 remaining subjects). The distribution of individual average ISC’s is indicated inFig 3. We examined whether the overall average ISC (i.e. averaged across subjects) was greater than zero by conducting a non-parametric permutation test [27,28]. The permutation distribution of ISC’s were computed in the same manner as described above, except that a given segment was correlated to a segment corresponding to different clip (i.e. a non-matched clip). The non-matching segment was drawn at random for each iteration (100,000 iterations). The non-matched permutation ICS’s were averaged across all subjects for each permutation and p-values were derived by determining the percentage of permutation ISC’s which exceed the average ISC value calculated when the segments correspond to the
Fig 2. Average ISC’s within different frequencies.The average ISC was calculated for each individual across matching clips (in red) and non-matching clips (in black) across all unique subject pairs and
electrodes. The distribution of individual ISC’s are indicated when computed from the full spectrum (i.e. 0–50 Hz), and when computed from signals wavelet filtered within the ~0–4 Hz, 4–8 Hz, 8–16 Hz, 16–32 Hz, and 32–48 Hz frequency bands. The upper and lower bars indicate the maximum and minimum data points, respectively. The red bar spans the first (lower) and third (upper) quartiles. The solid line indicates the median and the circle indicates the mean.
same clip. The average ISC was significantly above zero (p<0.0028) for 15 out of the 16 clips. There was insufficient evidence that ISC’s were above zero when individuals watched the clip from Seinfeld (permutation test: p = 0.240).
The spatial distribution of ISC’s were examined by computing the average ICS (across all subject pairs and clips) separately for each electrode. The highest ISC’s were observed at elec-trode Cz (r = 0.0083) and elecelec-trode 02 (r = 0.0081). The ISC’s were 0.0055, 0.0054, 0.0073, 0.0060, 0.0065, and 0.0044 within electrodes Fz, O1, F3, F4, P3, and P4, respectively (S2 Fig). Thus, the highest ICS’s were observed over the mid central electrode and the electrode located over occipital regions.
ISC
’
s and clip preference
The similarity in preferences between each subject pair was calculated by computing the Spear-man rank correlation coefficient between their rankings for the 16 video clips. If ISC’s are related
Fig 3. The average ISC for each video clip.ISC’s were calculated across all unique subject pairs and electrodes. The ISC's were averaged across all electrodes and subject pairs for each individual. The distribution of individual average ISC’s are indicated in each boxplot, separately for each clip. The boxplots are organized with the highest average ISC’s on top and the lowest ISC’s on bottom. ISC’s were greater than zero (permutation test: p<0.0028) for
15 out of 16 clips. Within each boxplot, the upper and lower bars indicate the maximum and minimum data points, respectively. The red bar spans the first (lower) and third (upper) quartiles. The solid line indicates the median and the circle indicates the mean.
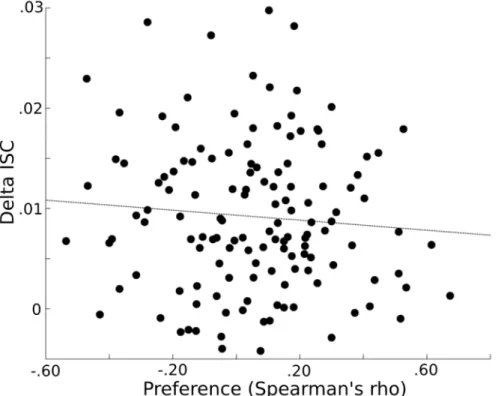
to individual preferences, then subjects with similar preferences, as reflected by larger Spearman’s rho values, would demonstrate a greater similarity in their EEG response to the clips, as reflected in larger ISC’s. The Spearman’s rho and average delta-band ISC’s (i.e. across the 16 movies and 8 electrode) values were uncorrelated across the subject pairs (r(135) = -0.08; p = 0.34), indicating insufficient evidence to demonstrate a relationship between these two variables (Fig 4).
Algorithm selection and assignment accuracy
EEG segments were DWT filtered within the delta band, since this frequency primarily con-tributed to ISC’s, and were assigned to 1 of the 16 clips in Experiment 1B using the aggregate correlations assignment algorithm (Fig 1c). The aggregate correlations assignment algorithm was used since it was the best performing algorithm within a separate dataset (see Experiment 1A). Using this approach, 91 out of 272 total segments (17 subjects × 16 clips), or 33.46% of the segments, were correctly assigned (chance = 06.25%). Within post-hoc analysis, we found ac-curacies of 08.82% and 24.26% using the separate time series and aggregate time series ap-proach, respectively. Thus, the aggregate correlations approach was selected as the optimal approach using an independent dataset, and its utility was verified within the data in the main experiment since it continued to outperform the alternative assignment algorithms.
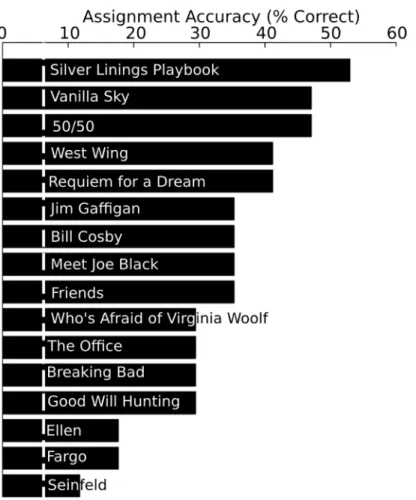
The assignment accuracies are indicated for each of the separate clips inFig 5. The assign-ment accuracies range from 52.9% (Silver Linings Playbook) to 11.75% (Seinfeld). In general, there appear to be qualitative differences in the assignment accuracies across the clips, and there is a significant relationship between delta ISC’s (inFig 3) and assignment accuracy (in
Fig 5) (r(15) = 0.76; p = 0.0007).
Fig 4. Preference and delta ISC’s.Similarities in preference (x-axis) (the Spearman’s rho between clip rankings for each subject pair) are plotted against similarities in delta EEG responses (y-axis) (represented by the average ISC). There was insufficient evidence of a relationship among clip preference and ISC’s (r (135) = -0.08; p = 0.34).
We examined which spatial locations were most informative for prediction by determining the percentage of correct assignments for each electrode. The best predicting electrode was electrode Cz, with 26 out of 91 (28.57%) correct predictions derived from this mid central spa-tial location. Electrodes Fz, O1, F3, F4, O2, P3, and P4 contributed to 10.99%, 01.10%, 10.99%, 02.20%, 17.58%, 26.37% and 02.20% of the correct predictions.
Dependence on the number of subjects
We examined assignment accuracy with the aggregate correlations approach when N = 1, 2, 3,. . .
16 subjects were used as reference. Assignment accuracy monotonically increased from 11.94% with N = 1, up to 33.46% with N = 16, as indicated inFig 6. Assignment accuracy increased an av-erage of 01.43% with each new additional subject added, and doubling the number of subjects from 8 to 16 resulted in a 41.65% increase in assignment accuracy (from 23.60% to 33.46%).
Discussion
Assignment accuracy for each algorithm
In the present study, our primary goal was to implement and evaluate different assignment algorithms for predicting which audiovisual clips individuals viewed. The aggregate
Fig 5. Assignment accuracy for each clip.The assignment accuracy is indicated for each clip. The clips are organized with the highest (top) to lowest assignment accuracies. The white line indicates chance assignment accuracy (06.25%).
correlations algorithm (Fig 1c) outperformed the alternative algorithms both within an inde-pendent dataset (Experiment 1A) as well as within the data obtained in the main experiment (Experiment 1B) (i.e. with a 21.4% and 37.92% increase in accuracy compared to the second best algorithm, respectively). Within the aggregate correlations algorithm, correlations were computed first for each unique subject pair, and the resulting correlations were then averaged across subjects. This approach integrates information from multiple subjects similar to the aggregate time series approach, except similarities may be preserved in the evoked potential within subject pairs that might be obscured when averaging across all subjects. For example, averaging across time series emphasizes information which is highly similar across subjects, and this constraint appears to reduce the information available when using ISC’s for prediction. The aggregate correlations approach appears most informative in the context of the present study using low magnitude EEG ISC’s, and further studies may examine whether the algorithm continues to perform better when ISC’s are obtained from signals with a higher SNR, such as with BOLD fMRI, and when compared with alternative approaches [29,30].
It is important to note that the assignment accuracy monotonically increased as the number of subjects increased. This finding suggests that further increases in assignment accuracy, from the peak at 33.46%, would likely be observed with further increases in sample size. Additional studies with a larger sample size could potentially characterize the nature of this assignment ac-curacy increase, revealing the subject sample that may result in a plateau in prediction accura-cy. A greater sample size could additionally enhance the ability to examine whether individual differences, such as gender and the individuals prior exposure to the clip, are related to differ-ences in ISC magnitude across clips.
Fig 6. Assignment accuracy as a function of the number of subjects.The assignment accuracy was examined within the data collected in the main experiment using N = 1, 2, 3,. . .16 subjects as reference. The
assignment accuracy was 33.46% (chance = 06.25%, solid black line) when all 16 subjects were used as reference. The shaded area represents the standard deviation of assignment accuracies observed with repeated assignments (i.e. across the assignments generated with all unique combinations of subjects drawn from the sample of 16).
ISC
’
s and preference
There was insufficient evidence to support our hypothesis that individuals with similar clip preferences would have similar EEG responses (i.e. greater ISC’s). There are a few reasons why individual preferences would potentially diverge from EEG responses to the stimuli. In general, ISC magnitudes and assignment accuracies appeared to differ across the clips. These differ-ences may be related to many aspects of the clip content, including the spectral characteristics of the auditory signals, low level characteristics of the audiovisual content and differences in at-tentional and emotional engagement toward the different clips. A subset of these characteristics may be related to individual’s preferences. Thus, individuals preference ratings may represent an aggregate measure of their subjective and perceptive response to the video, which may be not necessarily be related to the characteristics that lead to cortical engagement toward the sti-muli, as expressed by EEG ISC magnitudes. This is consistent with previous studies demon-strating the recruitment of neural responses toward behaviorally relevant ecological events, irrespective of whether or not the content is subjectively pleasing [31]. The divergence between individual preference and cortical engagement is also consistent with a general divergence be-tween cognitive and behavioral measures and subjective reports, as demonstrated by a recent finding that EEG ISC’s were more predictive of the preferences of a general audience than the preferences of the individuals in which the ISC’s were measured [14]. In general, this is consis-tent with findings which suggest that measures of neural engagement can supplement subjec-tive reports of preference, perception, and emotion [29,32–35].
Differences between EEG and fMRI ISC
’
s
The majority of ISC studies have been conducted using BOLD fMRI measures [1,6–9,12,13,
29,36–50], with comparatively fewer studies using EEG or MEG [5,12,51–54]. Given this
dis-crepancy, it is important to consider how differences in spatial and temporal sensitivities of each measure [55] may contribute to differences in the interpretation of ISC’s and the strengths and weaknesses of each modality.
Previous studies demonstrate that fMRI ISC increases correspond to segments of the clip that display content consistent with the functional properties of the region [37,41,48,56–58]. For example, early visual and auditory regions demonstrate higher ISC’s when auditory and vi-sual content are presented, respectively [8,13,49,59], while ISC peaks within the fusiform gyrus and post-central sulcus appear to correspond to regions in the clip where faces are displayed or buildings are displayed, respectively [8]. Thus, ISC’s are a promising approach to determine complex functional properties of fMRI regions.
increases in ISC’s across subjects, and these findings will help determine the relationship be-tween ISC’s and individuals perceptual, cognitive, and emotional responses to audiovisual stimuli.
Neurologically plausible ISC magnitudes
Eye movements are coherent across subjects when viewing natural scenes [63] and eye move-ment artifacts strongly contribute to EEG responses measured at frontal scalp locations. Thus, it is important to consider the potential contribution of eye movement artifacts to EEG ISC’s. The contribution of these non-neurological sources may be addressed by recording eye move-ments directly with electrooculography (EOG), by examining the spatial locations that contrib-ute to ISC’s, by considering the size of the video display, or by directing participants to fixate on a point at the center of the video.
EOG responses were not measured in the present study due to the limited coverage of the mobile EEG system and individual’s eye movements were not constrained to a central fixation point. However, the spatial topography of ISC’s and our choice of video size help alleviate con-cerns that the results of the present study are influenced primarily by eye movements. For ex-ample, the peak ISC was not observed within the electrodes which are predominantly influenced by eye movements (e.g. frontal electrodes F3, Fz, and F4 in this study). Instead, the peak ISC location (electrode Cz) is consistent with the topographic locations in which cognitive ERP peaks are often observed (e.g. the P300 [64]). Additionally, we conducted a pilot experi-ment to compare the magnitude of ISC’s with video and audio to the magnitude with audio only. The individual average ISC values obtained within Experiment 1A were comparable in magnitude to the individual average ISC values obtained when individuals listened to the audi-tory stimuli without video (S1 Fig). Thus, the use of a smaller video display size (13.2 × 7.4 dva, compared to 22 × 17 dva in [53] and 18 × 11 dva in [5] likely reduced the influence of eye movements on EEG ISC’s in the present study.
The smaller video size may have contributed to the small ISC values (i.e. r<.01) reported in the present study. These low correlations indicate that the evoked response to shared audio-visual inputs explains only a small portion of the EEG signal variance, which is expected given that the variability of single-trial evoked potentials and their low magnitude against back-ground EEG (i.e. the poor signal to noise ratio of EEG). Previous studies have implemented spectral decomposition and canonical correlations analysis (CCA) and have reported ISC val-ues up to 0.3. As in the present study, these studies demonstrate that ISC’s emerge from activity within the delta band (0–4 Hz), with few significant correlations observed within the higher frequencies [53,65]. Multivariate correlation methods such as CCA likely contributed to the larger ISC’s in previous studies, since the approach maximizes the correlation among paired [channels × time] matrices. Compared to the current study, the approach appears to enhance the correlations among matching as well as non-matching segments, thus, it would be interest-ing for future studies to examine the predictive utility of CCA usinterest-ing the algorithms imple-mented in the present study.
The utility of EEG ISC
’
s for complex stimuli
superposition of phase-locked EEG oscillations arising from the responses associated with the events and the emotional and cognitive response. In contrast to ERP analysis, the ISC approach shifts emphasis from the specific shape of the EEG response toward the commonalities in the response across subjects. Thus, ERP responses that are non-stationary and non-linear with re-spect to a stimulus within an individual subject will contribute to large ISC values as long as the characteristics of the non-stationary and non-linear response are preserved across subjects.
It is important to note that the ISC approach may be useful for capturing complex stimulus-response characteristics that may result within conventional task-based paradigms, and thus, may complement traditional analyses of task data [9,39,39,44–46,66]. For example, there is an apparent non-linear relationship between the amplitudes of ERP responses to target tones and the number of preceding non-targets tones [67]. These amplitude fluctuations are averaged out in the conventional ERP, but would be preserved in ISC analysis, since the continuous ampli-tude differences would contribute to the calculation of correlation.
Future directions
Further studies may manipulate the content of audiovisual clips and the subject population to determine whether clinical populations demonstrate similar cortical responses to particular content. For example, clinical populations may demonstrate a greater commonality in their re-sponses among themselves than among other populations. Individuals with autism demon-strate reduced ISC’s within multiple fMRI regions while watching social interactions [47], and demonstrate reproducible, but idiosyncratic, responses amongst themselves [68]. Individuals with depression demonstrate attentional biases toward negative environmental stimuli [69,70], and these biases may emerge as enhanced ISC’s within this population (compared to controls) when viewing clips with negative content. Thus, ISC’s may be a useful approach for identifying neural response similarities that may be unique to patients, especially as we gain a better under-standing of the subjective and perceptual factors that are related to ISC modulation.
Conclusions
Within the present study, we examined the utility of using ISC’s for predicting which audiovi-sual clips individuals viewed, and their potential relationship to subjective reports. Three ap-proaches were evaluated for aggregating responses across subjects for assignment within Experiment 1A. The aggregate correlations algorithm generated the highest assignment accura-cy (70.83% chance = 33.33%) and was selected as the assignment algorithm for the larger sam-ple of individuals and clips within Experiment 1B. The overall assignment accuracy was 33.46% within Experiment 1B (chance = 06.25%), with accuracies ranging from 52.9% (Silver Linings Playbook) to 11.75% (Seinfeld). ISC’s were significantly greater than zero for 15 out of 16 clips, and fluctuations within the delta frequency band (i.e. 0–4 Hz) primarily contributed to response similarities across subjects. There was insufficient evidence to indicate that individ-uals with greater similarities in clip preference demonstrate greater similarities in cortical re-sponses, suggesting a lack of association between ISC and clip preference. These results demonstrate the utility of using ISC’s for prediction, and further characterize the relationship between ISC magnitudes and subjective reports.
Supporting Information
in Experiment 1A with video and audio. The column“Audio”indicates the distribution of indi-vidual ISC’s when the experiment was repeated with only audio (i.e. without video, and while individuals fixated). There was insufficient evidence of a different in ISC’s between the two conditions (T(10) = -0.09; p = 0.93). These results suggest that eye movements were not a strong contributor to ISC’s within the present study.
(PNG)
S2 Fig. Overall average ISC for each electrode.The spatial distribution of ISC’s were exam-ined by computing the average ICS (across all subject pairs and clips) separately for each elec-trode. The 8 electrodes are indicated by their 10–20 label (i.e. F3, Fz, F4, Cz, P3, P4, O1, and O2) with the average ISC indicated below each label. The highest ICS’s were observed over the mid central electrode (Cz) and the electrode located over occipital regions (O2).
(PNG)
Author Contributions
Conceived and designed the experiments: DB CNG CR. Performed the experiments: DB CR. Analyzed the data: DB. Contributed reagents/materials/analysis tools: CNG CR VC. Wrote the paper: DB CR CNG VC.
References
1. Hasson U, Landesman O, Knappmeyer B, Vallines I, Rubin N, Heeger DJ. Neurocinematics: The neu-roscience of film. Projections. 2008; 2: 1–26.
2. Carandini M. Do We Know What the Early Visual System Does? J Neurosci. 2005; 25: 10577–10597. doi:10.1523/JNEUROSCI.3726-05.2005PMID:16291931
3. Haxby JV, Guntupalli JS, Connolly AC, Halchenko YO, Conroy BR, Gobbini MI, et al. A Common, High-Dimensional Model of the Representational Space in Human Ventral Temporal Cortex. Neuron. 2011; 72: 404–416. doi:10.1016/j.neuron.2011.08.026PMID:22017997
4. Horton C, Srinivasan R, D’Zmura M. Envelope responses in single-trial EEG indicate attended speaker in a“cocktail party.”J Neural Eng. 2014; 11: 046015. doi:10.1088/1741-2560/11/4/046015PMID: 24963838
5. Luo H, Liu Z, Poeppel D. Auditory Cortex Tracks Both Auditory and Visual Stimulus Dynamics Using Low-Frequency Neuronal Phase Modulation. Zatorre R, editor. PLoS Biol. 2010; 8: e1000445. doi:10. 1371/journal.pbio.1000445PMID:20711473
6. Nummenmaa L, Glerean E, Viinikainen M, Jaaskelainen IP, Hari R, Sams M. Emotions promote social interaction by synchronizing brain activity across individuals. Proc Natl Acad Sci. 2012; 109: 9599–
9604. doi:10.1073/pnas.1206095109PMID:22623534
7. Bartels A, Zeki S. The chronoarchitecture of the human brain—natural viewing conditions reveal a time-based anatomy of the brain. NeuroImage. 2004; 22: 419–433. doi:10.1016/j.neuroimage.2004.01.007 PMID:15110035
8. Hasson U. Intersubject Synchronization of Cortical Activity During Natural Vision. Science. 2004; 303: 1634–1640. doi:10.1126/science.1089506PMID:15016991
9. Hejnar MP, Kiehl KA, Calhoun VD. Interparticipant correlations: A model free FMRI analysis technique. Hum Brain Mapp. 2007; 28: 860–867. doi:10.1002/hbm.20321PMID:17133393
10. Hasson U, Ghazanfar AA, Galantucci B, Garrod S, Keysers C. Brain-to-brain coupling: a mechanism for creating and sharing a social world. Trends Cogn Sci. 2012; 16: 114–121. doi:10.1016/j.tics.2011. 12.007PMID:22221820
11. Hasson U, Malach R, Heeger DJ. Reliability of cortical activity during natural stimulation. Trends Cogn Sci. 2010; 14: 40–48. doi:10.1016/j.tics.2009.10.011PMID:20004608
12. Dmochowski JP, Bezdek MA, Abelson BP, Johnson JS, Schumacher EH, Parra LC. Audience prefer-ences are predicted by temporal reliability of neural processing. Nat Commun. 2014; 5. doi:10.1038/ ncomms5567
14. Roth C, Gupta CN, Plis SM, Damaraju E, Khullar S, Calhoun VD, et al. The influence of visuospatial at-tention on unattended auditory 40 Hz responses. Front Hum Neurosci. 2013; 7. doi:10.3389/fnhum. 2013.00370
15. Mallat SG. A theory for multiresolution signal decomposition: the wavelet representation. IEEE Trans Pattern Anal Mach Intell. 1989; 11: 674–693.
16. Samar VJ, Swartz KP, Raghuveer MR. Multiresolution analysis of event-related potentials by wavelet decomposition. Brain Cogn. 1995; 27: 398–438. PMID:7626282
17. Quiroga RQ, Sakowitz OW, Basar E, Schürmann M. Wavelet transform in the analysis of the frequency composition of evoked potentials. Brain Res Protoc. 2001; 8: 16–24. PMID:11522524
18. Unser M. On the Asymptotic Convergence of Ä-Spline Wavelets to Gabor Functions Michael Unser, Member, IEEE, Akram Aldroubi, and Murray Eden, Life Fellow, IEEE. IEEE Trans Inf Theory. 1992; 38.
19. Cohen A, Daubechies I, Feauveau JC. Biorthogonal bases of compactly supported wavelets. Commun Pure Appl Math. 1992; XLV: 485–560.
20. Quiroga RQ. Obtaining single stimulus evoked potentials with wavelet denoising. Phys Nonlinear Phe-nom. 2000; 145: 278–292.
21. Daubechies I. Ten lectures on wavelets. Philadelphia, PA.: Society for Indistrial and Applied Mathe-matics; 1992.
22. Mallat SG. A wavelet tour of signal processing. 2nd ed. San Diego, CA.: Academic Press; 1999.
23. Strang G, Nguyen T. Wavelets and filterbanks. Cambridge, MA.: Cambridge Press; 1996.
24. Bradley A., Wilson W. On wavelet analysis of auditory evoked potentials. Clin Neurophysiol. 2004; 115: 1114–1128. doi:10.1016/j.clinph.2003.11.016PMID:15066537
25. Demiralp T, Ademoglu A, Istefanopulos Y, Başar-Eroglu C, Başar E. Wavelet analysis of oddball P300. Int J Psychophysiol. 2001; 39: 221–227. PMID:11163899
26. Roth A, Roeschely D, Bender S, Weisbrod M, Kaiser S. Increased event-related potential latency and amplitude variability in schizophrenia detected through wavelet-based single trial analysis. Int J Psy-chophysiol. 2007; 66: 244–254. doi:10.1016/j.ijpsycho.2007.08.005PMID:17900725
27. Efron B, Tibshirani R. An introduction to the bootstrap. Chapman and Hall; 1993.
28. Good PI. Permutation, Parametric and Bootstrap Tests of Hypothesis. New York, NY: Springer; 2005.
29. Gaebler M, Biessmann F, Lamke J-P, Müller K-R, Walter H, Hetzer S. Stereoscopic depth increases intersubject correlations of brain networks. NeuroImage. 2014; 100: 427–434. doi:10.1016/j. neuroimage.2014.06.008PMID:24945664
30. Huttunen H, Manninen T, Kauppi JP, Tohka J. Mind Reading with regularized logistic regression. Mach Vis Appl. 2013; 24: 1311–1325.
31. Von Borries AKL, Verkes RJ, Bulten BH, Cools R, de Bruijn ERA. Feedback-related negativity codes outcome valence, but not outcome expectancy, during reversal learning. Cogn Affect Behav Neurosci. 2013; 13: 737–746. doi:10.3758/s13415-013-0150-1PMID:24146314
32. Lee Y-Y, Hsieh S. Classifying Different Emotional States by Means of EEG-Based Functional Connec-tivity Patterns. Daunizeau J, editor. PLoS ONE. 2014; 9: e95415. doi:10.1371/journal.pone.0095415 PMID:24743695
33. Porbadnigk AK, Treder MS, Blankertz B, Antons J-N, Schleicher R, Möller S, et al. Single-trial analysis of the neural correlates of speech quality perception. J Neural Eng. 2013; 10: 056003. doi:10.1088/ 1741-2560/10/5/056003PMID:23902853
34. Scholler S, Bosse S, Treder MS, Blankertz B, Curio G, Muller K-R, et al. Toward a Direct Measure of Video Quality Perception Using EEG. IEEE Trans Image Process. 2012; 21: 2619–2629. doi:10.1109/ TIP.2012.2187672PMID:22345537
35. Yazdani A, Lee J-S, Vesin J-M, Ebrahimi T. Affect recognition based on physiological changes during the watching of music videos. ACM Trans Interact Intell Syst. 2012; 2: 1–26. doi:10.1145/2133366. 2133373
36. Abrams DA, Ryali S, Chen T, Chordia P, Khouzam A, Levitin DJ, et al. Inter-subject synchronization of brain responses during natural music listening. Eur J Neurosci. 2013; 37: 1458–1469. doi:10.1111/ejn. 12173PMID:23578016
37. Bartels A, Zeki S, Logothetis NK. Natural Vision Reveals Regional Specialization to Local Motion and to Contrast-Invariant, Global Flow in the Human Brain. Cereb Cortex. 2008; 18: 705–717. doi:10.1093/ cercor/bhm107PMID:17615246
39. Hanson SJ, Gagliardi AD, Hanson C. Solving the brain synchrony eigenvalue problem: conservation of temporal dynamics (fMRI) over subjects doing the same task. J Comput Neurosci. 2009; 27: 103–114.
doi:10.1007/s10827-008-0129-zPMID:19104925
40. Hasson U, Furman O, Clark D, Dudai Y, Davachi L. Enhanced Intersubject Correlations during Movie Viewing Correlate with Successful Episodic Encoding. Neuron. 2008; 57: 452–462. doi:10.1016/j. neuron.2007.12.009PMID:18255037
41. Hasson U, Yang E, Vallines I, Heeger DJ, Rubin N. A Hierarchy of Temporal Receptive Windows in Human Cortex. J Neurosci. 2008; 28: 2539–2550. doi:10.1523/JNEUROSCI.5487-07.2008PMID: 18322098
42. Kauppi. Inter-subject correlation of brain hemodynamic responses during watching a movie: localiza-tion in space and frequency. Front Neuroinformatics. 2010; doi:10.3389/fninf.2010.00005
43. Kauppi J, Jaaskelainen IP, Sams M, Tohka J. Clustering inter-subject correlation matrices in functional magnetic resonance imaging. Information Technology and Applications in Biomedicine (ITAB), 2010 10th IEEE International Conference on. IEEE; 2010. pp. 1–6.
44. Kim D, Pearlson GD, Kiehl KA, Bedrick E, Demirci O, Calhoun VD. A method for multi-group inter-par-ticipant correlation: Abnormal synchrony in patients with schizophrenia during auditory target detection. NeuroImage. 2008; 39: 1129–1141. doi:10.1016/j.neuroimage.2007.09.042PMID:17996465
45. Lessa PS, Sato JR, Cardoso EF, Neto CG, Valadares AP, Amaro E. Wavelet correlation between sub-jects: A time-scale data driven analysis for brain mapping using fMRI. J Neurosci Methods. 2011; 194: 350–357. doi:10.1016/j.jneumeth.2010.09.005PMID:20869400
46. Pajula J, Kauppi J-P, Tohka J. Inter-Subject Correlation in fMRI: Method Validation against Stimulus-Model Based Analysis. Harrison BJ, editor. PLoS ONE. 2012; 8: e41196. doi:10.1371/journal.pone. 0041196PMID:22924089
47. Salmi J, Roine U, Glerean E, Lahnakoski J, Nieminen-von Wendt T, Tani P, et al. The brains of high functioning autistic individuals do not synchronize with those of others. NeuroImage Clin. 2013; 3: 489–
497. doi:10.1016/j.nicl.2013.10.011PMID:24273731
48. Salmi J, Glerean E, Jääskeläinen IP, Lahnakoski JM, Kettunen J, Lampinen J, et al. Posterior parietal cortex activity reflects the significance of others’actions during natural viewing: PPC Reflects Signifi-cance of Others’Actions. Hum Brain Mapp. 2014; 35: 4767–4776. doi:10.1002/hbm.22510PMID:
24706557
49. Wilson SM, Molnar-Szakacs I, Iacoboni M. Beyond Superior Temporal Cortex: Intersubject Correlations in Narrative Speech Comprehension. Cereb Cortex. 2008; 18: 230–242. doi:10.1093/cercor/bhm049 PMID:17504783
50. Ylipaavalniemi J, Savia E, Malinen S, Hari R, Vigário R, Kaski S. Dependencies between stimuli and spatially independent fMRI sources: Towards brain correlates of natural stimuli. NeuroImage. 2009; 48: 176–185. doi:10.1016/j.neuroimage.2009.03.056PMID:19344775
51. Dmochowski JP, Sajda P, Dias J, Parra LC. Correlated Components of Ongoing EEG Point to Emotion-ally Laden Attention—A Possible Marker of Engagement? Front Hum Neurosci. 2012; 6. doi:10.3389/ fnhum.2012.00112
52. Konvalinka I, Bauer M, Stahlhut C, Hansen LK, Roepstorff A, Frith CD. Frontal alpha oscillations distin-guish leaders from followers: Multivariate decoding of mutually interacting brains. NeuroImage. 2014; 94: 79–88. doi:10.1016/j.neuroimage.2014.03.003PMID:24631790
53. Lankinen K, Saari J, Hari R, Koskinen M. Intersubject consistency of cortical MEG signals during movie viewing. NeuroImage. 2014; 92: 217–224. doi:10.1016/j.neuroimage.2014.02.004PMID:24531052
54. Sänger J, Müller V, Lindenberger U. Directionality in hyperbrain networks discriminates between lead-ers and followlead-ers in guitar duets. Front Hum Neurosci. 2013; 7. doi:10.3389/fnhum.2013.00234
55. Bridwell DA, Calhoun VD. Fusing Concurrent EEG and fMRI intrinsic networks. In Supek S. & Aine C., editors. MEG- From Signals to Dynamic Cortical Networks. Springer; 2014.
56. Golland Y, Bentin S, Gelbard H, Benjamini Y, Heller R, Nir Y, et al. Extrinsic and Intrinsic Systems in the Posterior Cortex of the Human Brain Revealed during Natural Sensory Stimulation. Cereb Cortex. 2006; 17: 766–777. doi:10.1093/cercor/bhk030PMID:16699080
57. Kriegeskorte N, Mur M, Ruff DA, Kiani R, Bodurka J, Esteky H, et al. Matching Categorical Object Rep-resentations in Inferior Temporal Cortex of Man and Monkey. Neuron. 2008; 60: 1126–1141. doi:10. 1016/j.neuron.2008.10.043PMID:19109916
58. Lahnakoski JM, Glerean E, Salmi J, Jääskeläinen IP, Sams M, Hari R, et al. Naturalistic fMRI Mapping Reveals Superior Temporal Sulcus as the Hub for the Distributed Brain Network for Social Perception. Front Hum Neurosci. 2012; 6. doi:10.3389/fnhum.2012.00233
60. Whittingstall K, Bartels A, Singh V, Kwon S, Logothetis NK. Integration of EEG source imaging and fMRI during continuous viewing of natural movies. Magn Reson Imaging. 2010; 28: 1135–1142. doi:10.
1016/j.mri.2010.03.042PMID:20579829
61. Doelling KB, Arnal LH, Ghitza O, Poeppel D. Acoustic landmarks drive delta—theta oscillations to en-able speech comprehension by facilitating perceptual parsing. NeuroImage. 2014; 85: 761–768. doi: 10.1016/j.neuroimage.2013.06.035PMID:23791839
62. Gross J, Hoogenboom N, Thut G, Schyns P, Panzeri S, Belin P, et al. Speech Rhythms and Multiplexed Oscillatory Sensory Coding in the Human Brain. Poeppel D, editor. PLoS Biol. 2013; 11: e1001752. doi:10.1371/journal.pbio.1001752PMID:24391472
63. Dorr M, Martinetz T, Gegenfurtner KR, Barth E. Variability of eye movements when viewing dynamic natural scenes. J Vis. 2010; 10: 28–28. doi:10.1167/10.10.28PMID:21191134
64. Sur S, Sinha VK. Event-related potential: an overview. Ind Psychiatry J. 2009; 18: 70–73. doi:10.4103/ 0972-6748.57865PMID:21234168
65. Koskinen M, Seppä M. Uncovering cortical MEG responses to listened audiobook stories. NeuroImage. 2014; 100: 263–270. doi:10.1016/j.neuroimage.2014.06.018PMID:24945666
66. Seghier ML, Price CJ. Dissociating functional brain networks by decoding the between-subject variabili-ty. NeuroImage. 2009; 45: 349–359. doi:10.1016/j.neuroimage.2008.12.017PMID:19150501
67. Bridwell DA, Kiehl KA, Pearlson GD, Calhoun VD. Patients with schizophrenia demonstrate reduced cortical sensitivity to auditory oddball regularities. Schizophr Res. 2014; 2014.
68. Hasson U, Avidan G, Gelbard H, Vallines I, Harel M, Minshew N, et al. Shared and idiosyncratic cortical activation patterns in autism revealed under continuous real-life viewing conditions. Autism Res. 2009; 2: 220–231. doi:10.1002/aur.89PMID:19708061
69. Joormann J. Attentional bias in dysphoria: The role of inhibitory processes. Cogn Emot. 2004; 18: 125–
147. doi:10.1080/02699930244000480
![Fig 1. Three assignment algorithms. Individual [channel × time] segments were assigned to one of the video clips using the separate time series approach (a), the aggregate time series approach (b) or the aggregate correlations approach (c)](https://thumb-eu.123doks.com/thumbv2/123dok_br/18315382.349200/5.918.57.762.113.944/assignment-algorithms-individual-aggregate-approach-aggregate-correlations-approach.webp)