J. Evid. Based Med. Healthc., pISSN- 2349-2562, eISSN- 2349-2570/ Vol. 3/Issue 11/Feb. 08, 2016 Page 305
SONOGRAPHIC EVALUATION OF PLACENTAL THICKNESS
–
AN INDICATOR OF
GESTATIONAL AGE
Anu Kapoor1, Mahesh D. Dudhat2
1Associate Professor, Department of Radiology, Nizam’s Institute of Medical Sciences, Hyderabad, Telangana. 2Former Radiology Resident, Department of Radiology, Image Hospital, Hyderabad, Telangana.
ABSTRACT
AIMS AND OBJECTIVES
The purpose of this study was to evaluate the placental thickness by sonography in normal singleton pregnancies at different stages of gestation in order to develop this as a useful tool for gestational age estimation.
MATERIALS AND METHODS
We evaluated 310 normal singleton pregnancies and calculated the fetal gestational age using sonographic biometric criteria for different periods of gestation. Placental thickness was measured by sonography at the site of umbilical cord insertion using the standardized technique. Mean placental thickness along with its standard deviation and 95 % confidence interval was calculated for each week of gestation. We used correlation regression analysis to study the relationship between placental thickness and gestational age.
RESULTS
Mean placental thickness (in mm) closely matched the gestational age (in weeks) between 10 to 30 weeks of gestation. We established a nomogram for placental thickness measurements with increasing gestational age.
CONCLUSIONS
Placental thickness has a linear relationship with gestational age especially during the second trimester of pregnancy. Placental thickness measurements when used along with fetal biometry can increase the accuracy of predicting gestational age during pregnancy. The regression equation and nomogram developed by us can be used to calculate the gestational age with minimal error.
KEYWORDS
Placenta, Thickness, Sonography, Gestational age.
HOW TO CITE THIS ARTICLE: Kapoor A, Dudhat MD. Sonographic evaluation of placental thickness – An indicator of gestational age. J. Evid. Based Med. Healthc. 2016; 3(11), 305-310. DOI: 10.18410/jebmh/2016/74
INTRODUCTION: Placenta is a unique organ with
important metabolic, endocrine and immunological functions. Placental size correlates well with the foetal growth and development and is therefore a reflection of foetal health. Sonography provides a safe and non-invasive means to evaluate of the foetus and placenta. Routine antenatal sonography includes foetal biometry for evaluation of foetal growth and gestational age estimation. Abnormal thickness of placenta is well recognized as a diagnostic harbinger in a wide spectrum of pathologic events and has been studied extensively.[1,2,3,4] The measurement of placental thickness by sonography is a relatively simple and useful parameter and can be used as to calculate the foetal gestational age. A number of foetal parameters like foetal head circumference, biparietal diameter, abdominal circumference and femur length are routinely evaluated during biometric assessment and these when used in combination are reliable predictors of fetal gestational age.[5,6,7,8,9] Placental thickness when used along with other
parameters can increase the accuracy of foetal gestational age estimation.[10,11,12] The present study describes a simple and easily reproducible sonographic method of measuring the placental thickness. It also presents a normogram for comparison of placental thickness in normal singleton pregnancies thereby providing a reliable tool for estimation of foetal gestational age.
METHODS: This prospective study included 310 pregnant women of all gestational ages attending the antenatal clinic of our Hospital. After obtaining a detailed history, the subjects underwent sonographic evaluation for assessment of placental thickness, gestational age and foetal weight. Only those cases with normal singleton pregnancy, known last menstrual period (LMP) and a discernable placental outline at sonography were included in the study.
Cases with coexisting medical or surgical disease conditions were excluded from the study. Subjects with multi-foetal pregnancy, foetal or placental anomalies, marginal or velamentous cord insertion and poly/oligohydramnios were also excluded from the study group.
Submission 11-01-2016, Peer Review 25-01-2016, Acceptance 02-02-2016, Published 08-02-2016. Corresponding Author:
Dr. Anu Kapoor,
J. Evid. Based Med. Healthc., pISSN- 2349-2562, eISSN- 2349-2570/ Vol. 3/Issue 11/Feb. 08, 2016 Page 306 Trans abdominal sonography was carried out in each
subject using Siemens Acuson X300 (Premium) equipment with 2-5MHz curvilinear probe. The following parameters were assessed at sonography:
Foetal age based on the gestational sac size or by measuring the crown to rump length (CRL) in the first trimester, biparietal diameter (BPD) and femur length (FL) in the second trimester and BPD, FL and abdominal circumference (AC) in the third trimester. Placental location and maturity (using the Grannum
grading method) [13,14] and placental thickness at the site of cord insertion.
The placental thickness was measured at the level of cord insertion, from the echogenic chorionic plate to placental myometrial interface, the placenta being profiled in sagittal plane. Cord insertion site was identified as a
hypoechoic ‘V’ shaped area closest to the chorionic plate in
the thickest portion of the placenta or as linear echoes emanating at right angles from the placental surface. (Fig. 1). All placental measurements were taken during the relaxed phase of the uterus as contractions can spuriously increase the placental thickness.
STATISTICAL METHODS: The mean placental thickness
(in mm) was calculated by averaging three independent measurements for each case along with its standard deviation (SD) calculated for each week of gestational between 11 to 40 weeks. The 95% confidence interval was also calculated for the same. Correlation and regression analysis was carried out to establish a relationship between gestational age in weeks and placental thickness in mm. These results were also compared for different placental positions and Gestational ages. SPSS 10.0 Microsoft Excel was used for statistical analysis of the data and to generate graphs and tables.
Fig. 1: Technique for sonographic measurement of placental thickness
The above illustration depicts the correct technique for measuring placental thickness at the level of cord insertion.
RESULTS: A total of 310 antenatal cases were included in
the present study with the age range of 18 to 39 years (mean age 23 years). The gestational age of cases varied from 10-40 weeks. Placental localization by sonography revealed fundal placentae in 128 out of 310 cases followed by anterior, posterior and lateral locations in 84, 79 and 19 cases respectively.
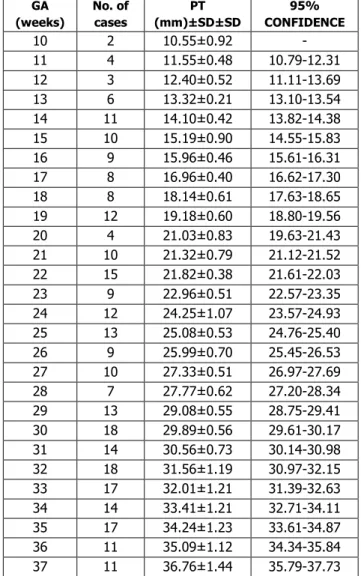
Placental thickness was measured for all cases using the described technique. The mean placental thickness along with its standard deviation (SD) and 95% confidence interval were calculated for different gestational ages as shown in Table 1.
It was observed that the placental thickness increased with increasing gestational age. The placental thickness gradually increased from an average of 9.9 mm at 10 weeks of gestation to 40 mm at 38 weeks of gestation. There was a fairly linear increase in the placental thickness with increasing gestational age between 10 to 38 weeks at the rate of 0.9mm per week.
The mean placental thickness (in mm) almost matched the gestational age (in weeks) between 10 weeks to 30 weeks. Beyond 30 weeks of gestation, the mean placental thickness was lower by 1mm and showed a wider range and variance as evident by increased standard deviation and widened 95% confidence interval. At no stage in pregnancy the placental thickness was greater than 40mm.
GA (weeks)
No. of cases
PT (mm)±SD±SD
95% CONFIDENCE
10 2 10.55±0.92 -
11 4 11.55±0.48 10.79-12.31
12 3 12.40±0.52 11.11-13.69
13 6 13.32±0.21 13.10-13.54
14 11 14.10±0.42 13.82-14.38
15 10 15.19±0.90 14.55-15.83
16 9 15.96±0.46 15.61-16.31
17 8 16.96±0.40 16.62-17.30
18 8 18.14±0.61 17.63-18.65
19 12 19.18±0.60 18.80-19.56
20 4 21.03±0.83 19.63-21.43
21 10 21.32±0.79 21.12-21.52
22 15 21.82±0.38 21.61-22.03
23 9 22.96±0.51 22.57-23.35
24 12 24.25±1.07 23.57-24.93
25 13 25.08±0.53 24.76-25.40
26 9 25.99±0.70 25.45-26.53
27 10 27.33±0.51 26.97-27.69
28 7 27.77±0.62 27.20-28.34
29 13 29.08±0.55 28.75-29.41
30 18 29.89±0.56 29.61-30.17
31 14 30.56±0.73 30.14-30.98
32 18 31.56±1.19 30.97-32.15
33 17 32.01±1.21 31.39-32.63
34 14 33.41±1.21 32.71-34.11
35 17 34.24±1.23 33.61-34.87
36 11 35.09±1.12 34.34-35.84
J. Evid. Based Med. Healthc., pISSN- 2349-2562, eISSN- 2349-2570/ Vol. 3/Issue 11/Feb. 08, 2016 Page 307
38 7 37.00±1.51 35.72-38.27
39 7 36.67±1.99 35.73-37.61
40 1 38.5 -
Table 1: Distribution of placental thickness according to gestational age
Fig. 2: Graphic representation showing linear relationship of placental thickness
with increasing gestational age
The above graph shows an almost linear increase in the placental thickness with increasing gestational age in our
study group. The Pearson’s correlation coefficient (r) for the
above data is 0.948 with a P value < 0.01.
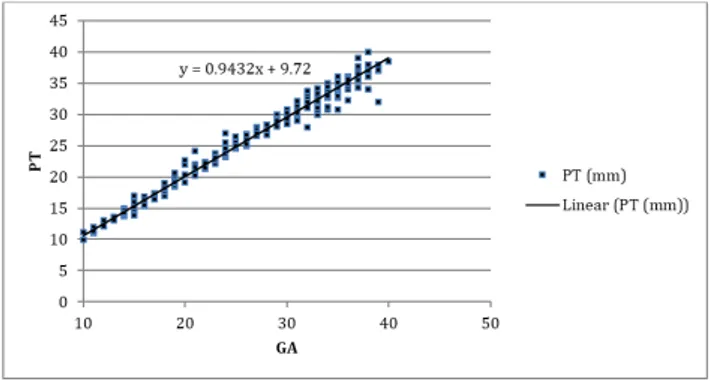
Fig. 3: Scatter graph representing placental thickness (in mm) of all cases between 10-40 weeks
of gestation with a linear trend line formation
The mean placental thickness in first trimester was 11.61±0.88mm, in the second trimester it was 20.86±4.50 and in the third trimester 32.78±2.81. The small sample size for 1st trimester was due to poor delineation of placental outline in early pregnancy. (Fig. 2 & 3).
It was observed that with every week of gestational age, there was an increase in placental thickness by 0.9432mm. A regression analysis yielded the following equation:
PT = 0.9432 (GA) + 9.723.
Where PT is placental thickness in mm and GA is gestational age in weeks.
We compared the relationship of GA and PT in each trimester based on the data as given in Table 1. Pearson’s correlation analysis revealed that there was a significant positive relationship between placental thickness and gestational age in all the three trimesters and it was observed that the correlation was strongest in the second trimester with the coefficient value being 0.98. (Table 2)
Trimester Sample
size
Correlation coefficient (r)
P value
T1 n=9 0.81 <0.01
T2 n=153 0.98 <0.01
T3 n=148 0.91 <0.01
Table 2: Pearson correlation coefficient between Placental Thickness and Gestational Age for each trimester (T)
Fig. 4: Nomogram depicting placental thickness for each week of gestation
A nomogram for placental thickness corresponding to each week of gestation (between 10-40 weeks) in normal singleton pregnancies was also obtained from our study as depicted in Fig. 4.
DISCUSSION: Placenta is a short-lived materno-fetal
organ that nourishes and protects the foetus. Since it is closely related to the foetus and the mother, it acts like a mirror reflecting the status of both the mother and the foetus. Until recently, sonography was used for placental localization and its morphological evaluation. Sonographic grading of placental maturity has also been well described in literature and is used as a descriptor of advancing gestational age during routine obstetric sonography.[13-15]
Thick and thin placentae have been associated with a number of foetal and maternal disease condition and increased perinatal morbidity.[16,17] Thus, placental measurement could play a potential role in screening for complications during pregnancy.
Before any pathological significance can be attached to abnormal placental dimensions, we need to establish what
is ‘normal’. Placental thickness is the easiest dimension to measure, but little is known about the normal placental thickness as measured by sonography during different stages of gestation.
Presently the most effective way to date pregnancy is by measurement of foetal parameters by sonography and these include crown-rump length, biparietal diameter, head circumference, femur length and abdominal circumference.[6-9,18] Sonographic measurements of placenta have been described previously in literature and it has been suggested that placental thickness measured at the level of umbilical cord insertion may be useful in assessment of foetal gestational age.[19-21]
J. Evid. Based Med. Healthc., pISSN- 2349-2562, eISSN- 2349-2570/ Vol. 3/Issue 11/Feb. 08, 2016 Page 308 and advancing gestational age. The present study was a
prospective cross sectional study that included 310 pregnant women at different stages of gestation. The majority of subjects belonged to 21 years to 25 years age group.
Earliest placental localization was possible at 10 weeks in our study. Before ten weeks of gestation we observed that the delineation of placental myometrial interface was usually poor and hence it was difficult to measure placental thickness accurately. Out of the 310 cases studied, majority of placentae were fundal in location (41.3%), followed by anterior (27%), posterior (25.5%) and lateral locations (6.2%).
We found that posteriorly located placentae were difficult to measure because of foetal acoustic shadowing and it was difficult also to identify the umbilical cord insertion site in posterior placentae especially in the third trimester. Fundal placentae were also difficult to measure accurately due to positional limitation in profiling them in true sagittal plane.
Cord insertion could be identified in 270 out of 310 cases. The cord was central in position in 258 cases and eccentric/marginal in 12 cases. Pretorius et al studied the variations in placental cord insertion during pre-natal sonography and observed that normal cord insertion could be visualized in 54% of cases only and it was more difficult to visualize at later gestational ages.[22] In our study cord insertion site could be identified in 87% of the cases. In the remaining cases, the placental thickness was measured at the thickest mid-placental location when viewed in a sagittal plane.
We calculated the gestational age for all cases using foetal biometry by measuring CRL, BPD, FL and AC for different periods of gestation. Along with routine foetal biometry, placental thickness was measured at the site of umbilical cord insertion for each case using the technique described before.
Mean placental thickness along with standard deviation and 95 % confidence interval for each week of gestation were calculated. In our study, the least placental thickness was 9.9mm at 10 weeks of gestation and highest 40 mm at 38 weeks of gestation. At no stage in pregnancy the thickness of placenta was greater than 40mm. The placental thickness was observed to increase linearly with advancing gestational age.
Earliest localization of placenta occurs at around 10-11 weeks as observed in previous studies also.[23] The cut-off of upper limit of normal placental thickness is 4 cm in previously published literature.[12] The maximum placental thickness noted in our study was 4 cm at 38 weeks of gestation.
We used correlation regression analysis to study the relationship between placental thickness and gestational age and found a P value of <0.01, which indicates statistical significance. Regression analysis yielded the following linear equation of relationship between gestational ages (GA) in weeks and placental thickness (PT) in mm.
PT = 0.943(GA) + 9.72 and GA = 1.063 (PT) - 10.34.
Where PT is Placental Thickness (in mm) and GA is Gestational Age (in weeks). The equation suggests that every week, the placental thickness increased by 0.943mm.
Pearson’s correlation coefficient (r=0.948) and P value (<0.01) for the study suggests significant relationship between placental thickness and gestational age.
We observed that the mean placental thickness (in mm) almost matched the gestational age (in weeks) between 10 weeks to 30 weeks. When the data was separately analyzed
for each trimester, we found that the Pearson’s correlation
coefficient (r) was highest for the second trimester thereby suggesting most significant correlation between placental thickness and gestational age in the second trimester.
Beyond 30 weeks of gestation the placental thickness was lower by 1mm and showed a wider range and variance with higher value of standard deviation. This may be in part due to difficult measurement of posterior placentae in the third trimester.
Nyberg and Finberg also observed that placental thickness in millimetre parallel gestational age in weeks.[24]
Hoddick et al reported a linear increase in placental thickness with advancing gestational age. Studies by Hoddick et al and La Torre et al also observed that the placental thickness in normal pregnancy was never more than 40mm.[12,25] Our observations regarding placental thickness are similar to those made in these studies.
Ohagwu et al have observed a higher placental thickness values at term in Nigerian population and they advise a cautious use of the well-accepted value of maximum thickness at term being 40 mm thereby suggesting a racial/gender factor determining the maximum placental thickness.[1]
Our findings are similar to the observations made by Anupama Jain et al who reported that the value of mean placental thickness increases with advancing gestational age.[26] The PT in mm in their study matched exactly with the GA in weeks between 27 and 33 weeks. Mittal et al reported that the placental thickness correlates well with gestational age from 22nd to 35th week.[27] However in our study population PT measurements in mm and GA in weeks matched closely between 10 and 35 weeks.
Tanawattanacharoen et al observed that the placental thickness increases steadily with time during pregnancy and also reported less variation in the placental thickness between the gestational ages of 18 and 41 weeks.[28]
We did not find any variation in mean placental thickness with different locations of the placentae. Consistent measurements were obtained irrespective of placental position. i.e. anterior, posterior, fundal or lateral.
J. Evid. Based Med. Healthc., pISSN- 2349-2562, eISSN- 2349-2570/ Vol. 3/Issue 11/Feb. 08, 2016 Page 309 0.872) linear equation of relationship between gestational
age (y) in weeks and placental thickness (PT) in mm.[1,31] Our study results show an even stronger relationship with a
higher value of Pearson’s correlation coefficient.
Karthikeyan et al have reported an increase in placental thickness by more than 2mm in a week in the first trimester by more than 4 mm in second trimester.[32] However, maximum placental thickness in their study group was 42.2 mm which is higher than that noted in our study (40mm).
Placental thickness is a parameter, which is easily measurable. Since this parameter may vary among different populations, the normal value of placental thickness must be defined for each week of gestational age by developing a population-specific nomogram. To the best of our knowledge, study is the first to develop a nomogram for placental thickness in Indian population. The high reliability of our data is based on the fact that all measurements were performed by the same examiner using the same equipment and gestational age for all cases was confirmed by sonographic dating.
CONCLUSIONS: From our study, it is evident that placental thickness has a linear relationship with gestational age. The addition of placental thickness to foetal biometry can increase the accuracy of gestational/foetal age estimation. An abnormal placental thickness for the corresponding gestational age should raise the suspicion of underlying foetal or maternal disease condition. The regression equation and normogram developed by us can be used to calculate the gestational with minimal error. It is therefore suggested that measurement of placental thickness should be carried out routinely during obstetric ultrasound scans.
REFERENCES:
1. Ohagwu CC, Oshiotse Abu P, Effiong Udoh B. Placental thickness: A sonographic indicator of gestational age in normal singleton pregnancies in Nigerian women. Internet Journal of Medical Update 2009;4(2):9-14. 2. Theera Tongsong, Pongrak Boonyanurak. “Placental
thickness in the first half of pregnancy.” J Clin Ultrasound 2004;32(5):231-234.
3. Jauniaux E. “Placental ultrasonographic measurements: What can we learn and is it worth
doing routinely?” Ultrasound Obstet Gynecol 1992;2:241-242.
4. Ghosh A, Tang MH, Lam YH, et al. “Ultrasound measurement of the placental thickness to detect pregnancies affected by homozygous alpha thalassemia-1.” Lancet 1994;344:988-989.
5. Hendricks CH. “Patterns of fetal and placental growth: In the second half of normal pregnancy.” Obstet Gynecol 1964;24(3):357-365.
6. Campbell S, Warsof SL, Little D, et al. Routine ultrasound screening for the prediction of gestational age. Obstet Gynecol 1985;65:613-20.
7. Robinson HP. Gestational age determination: First trimester. In Cherevenak FA, Isaacson GC, Campbell S, eds. Ultrasound Obstet Gynecol Boston: Little, Brown and Company, 1993;295-304.
8. Hadlock FP, Deter RL, Harrist RB, et al. Estimating fetal age: computer assisted analysis of multiple fetal growth parameters. Radiology 1984;152:497-501.
9. Campbell S, Newman GB. Growth of the fetal biparietal diameter during normal pregnancy. J Obstet Gynaecol Br Commonw 1971;78:513-9.
10. Bleker OP, Kloosterman GJ, Breur W, et al. “The volumetric growth of human placenta: A longitudinal ultrasonic study.” Am J Obstet Gynecol 1977;127:657-661.
11. Metzenbauer M, Hafner E, Hoefinger D. “Three dimensional ultrasound measurement of the placental volume in early pregnancy: Method and correlation with
biochemical placental parameters.” Placenta 2001;22:602-605.
12. Hoddick WK, Mahony BS, Callen PW, et al. Placental thickness. J Ultrasound Med 1985;4(9):479-82. 13. Granum PAT, Hobbins JC. “The placenta.” Radiol Clin
North Am 1982;20:353.
14. Granum PAT, Berkowitz RL, Hobbins JC. “The ultrasonic changes in the maturing placenta and their relation to
fetal pulmonic maturity.” Am J Obstet Gynecol 1979;133:915-922.
15. Hills D, Irwin GAL, Tuck S, et al. ”Distribution of
placental grades in high risk gravidas.” Am J Roentgenol 1984;143:1011-1013.
16. Hoogland HJ, de Haan J, Martin CB. “Placental size during early pregnancy and fetal outcome: A preliminary report of a sequential ultrasonographic
study.” Am J Obstet Gynecol 1980;138:441-443. 17. Tonsong T, Wanapirak C, Srisamboon J, et al.
“Antenatal sonographic features of 100 alpha -thalassemia hydrops fetalis foetuses.” J Clin Ultrasound 1996;24:73-7.
18. Hadlock FP, Shah YP, Kanon DJ, et al. “Fetal crown -rump length: Re-evaluation of relation to menstrual age
with high resolution real time ultrasound.” Radiology 1992;182:501-5.
19. Ezeokeke UO, Ohagwu CC, Abu PO, et al. Relationship between placental thickness and growth parameters in normal Nigerian fetuses. African Journal of Biotechnology 2009;8(2):133-38.
20. Wolf H, Oosting H, Treffers PE. “A longitudinal study of relationship between placental and fetal growth as
measured by ultrasonography.” Am J Obstet Gynecol 1989;161:1140-1145.
21. Kuhlmann RS, Warsof S. Ultrasound of the placenta. Clin Afr. Jou Obstet. Gynecol 1996;39:34.
22. Pretorius DH, Chau C, Poeltler DM, et al. Placental cord insertion visualization with prenatal ultrasonography. J Ultrasound Med 1996;15(8):585-93.
J. Evid. Based Med. Healthc., pISSN- 2349-2562, eISSN- 2349-2570/ Vol. 3/Issue 11/Feb. 08, 2016 Page 310 24. Nyberg DA, Finberg HJ. The placenta, placental
membranes and umbilical cord. In: Newburgh DA, Mahony BS, Pretorius DH, Eds. Diagnostic ultrasound of fetal anomalies. St. Louis, Mosby year book publishers. 1990;623-675.
25. La Torre R, Giovanni Nigro, Manuela Mazzocco M, et al. The ultrasonic changes in the maturing placenta. Am J Obstet and Gynecol 1979;42:915.
26. Anupama Jain, Ganesh Kumar, Agarwal U, et al.
“Placental thickness – a sonographic indicator of
gestational age.” Journal of obstetrics and gynaecology of India 2001;51(3):48-49.
27. Mital P, Hooja N, Mehndiratta. “Placental thickness – a sonographic parameter for estimating gestational age of
the fetus.” Ind J Radiol Imag2002;12(4):553-554. 28. Tanawattancharoen S, Manotaya S, Uerpairojkit B, et al.
“Ultrasound measurement of placental thickness in normal singleton pregnancy.” Thai J Obstet Gynecol 2000;10:73.
29. Lee AJ, Bethune M, Hiscock RJ. Placental thickness in the second trimester: a pilot study to determine the normal range. J Ultrasound Med 2012;31(2):213-8. 30. Durnwald C, Mercer B. Ultrasonographic estimation of
placental thickness with advancing gestational age [abstract]. Am J Obstet Gynecol 2004;191:S178. 31. V. Shanthi, G. Malathi. Thickness based
Characterization of Ultrasound Placenta Images using Regression Analysis. International Journal of Computer Applications (0975–8887), 2010;3(7):7-11.