A Systems Biology Approach Identifies a
Regulatory Network in Parotid Acinar Cell
Terminal Differentiation
Melissa A. Metzler1,2,3*, Srirangapatnam G. Venkatesh1,3, Jaganathan Lakshmanan1, Anne L. Carenbauer1, Sara M. Perez1, Sarah A. Andres2,3, Savitri Appana4, Guy N. Brock4, James L. Wittliff2,3, Douglas S. Darling1,2,3
1Department of Oral Immunology and Infectious Diseases, University of Louisville, Louisville, Kentucky, United States of America,2Department of Biochemistry & Molecular Biology, University of Louisville, Louisville, Kentucky, United States of America,3Institute for Molecular Diversity and Drug Design, University of Louisville, Louisville, Kentucky, United States of America and,4Department of Bioinformatics and Biostatistics, University of Louisville, Louisville, Kentucky, United States of America
Abstract
Objective
The transcription factor networks that drive parotid salivary gland progenitor cells to termi-nally differentiate, remain largely unknown and are vital to understanding the
regeneration process.
Methodology
A systems biology approach was taken to measure mRNA and microRNA expression in vivo across acinar cell terminal differentiation in the rat parotid salivary gland. Laser capture microdissection (LCM) was used to specifically isolate acinar cell RNA at times spanning the month-long period of parotid differentiation.
Results
Clustering of microarray measurements suggests that expression occurs in four stages. mRNA expression patterns suggest a novel role forPpargwhich is transiently increased during mid postnatal differentiation in concert with several target gene mRNAs. 79 micro-RNAs are significantly differentially expressed across time. Profiles of statistically significant changes of mRNA expression, combined with reciprocal correlations of microRNAs and their target mRNAs, suggest a putative network involvingKlf4, a differentiation inhibiting transcription factor, which decreases as several targeting microRNAs increase late in differ-entiation. The network suggests a molecular switch (involvingPrdm1,Sox11,Pax5, miR-200a, and miR-30a) progressively decreases repression ofXbp1gene transcription, in con-cert with decreased translational repression by miR-214.The transcription factor Xbp1 mRNA is initially low, increases progressively, and may be maintained by a positive feed-back loop withAtf6. Transfection studies show thatXbp1Mist1promoter. In addition,Xbp1
OPEN ACCESS
Citation:Metzler MA, Venkatesh SG, Lakshmanan J, Carenbauer AL, Perez SM, Andres SA, et al. (2015) A Systems Biology Approach Identifies a Regulatory Network in Parotid Acinar Cell Terminal
Differentiation. PLoS ONE 10(4): e0125153. doi:10.1371/journal.pone.0125153
Academic Editor:Francisco X. Real, Centro Nacional de Investigaciones Oncológicas (CNIO), SPAIN
Received:December 1, 2014
Accepted:March 16, 2015
Published:April 30, 2015
Copyright:© 2015 Metzler et al. This is an open access article distributed under the terms of the
Creative Commons Attribution License, which permits unrestricted use, distribution, and reproduction in any medium, provided the original author and source are credited.
Data Availability Statement:Raw data from both our microarray and qPCR array studies to the Gene Expression Omnibus (GEO) repository. They can be found under SuperSeries GSE65587 or individually at GSE65324 (qPCR array of microRNA expression) and GSE65586 (rat genome microarray) All these data have been released by GEO.
andMist1each activate the parotid secretory protein (Psp) gene, which encodes an abun-dant salivary protein, and is a marker of terminal differentiation.
Conclusion
This study identifies novel expression patterns ofPparg,Klf4, andSox11during parotid aci-nar cell differentiation, as well as numerous differentially expressed microRNAs. Network analysis identifies a novel stemness arm, a genetic switch involving transcription factors and microRNAs, and transition to anXbp1driven differentiation network. This proposed net-work suggests key regulatory interactions in parotid gland terminal differentiation.
Introduction
Salivary gland dysfunction affects millions across the nation, and results in complications that can lead to a decline in oral health as well as overall quality of life [1]. Whole saliva provides many functions in the oral cavity such as defense against pathogens, lubrication for speech and digestion, and regulation of pH [2]. Without functioning salivary glands, patients suffer chron-ic xerostomia (dry mouth). Along with discomfort and diffchron-iculty swallowing food, these pa-tients are at a high risk for chronic oral infections and dental caries [3]. Chronic xerostomia is a common complication for patients undergoing radiation therapy for head and neck cancer as salivary glands are especially sensitive to radiation damage [4]. Most treatment is palliative, as current treatment options that address the underlying gland dysfunction are limited [5]. The ability to regenerate or restore function to damaged glands would greatly increase patient health and quality of life [6,7].
Current work has made headway towards this goal by focusing on gland progenitor cells. In-sights from explant cultures have shown that parasympathetic nerves, which develop within the gland, are vital for maintaining epithelial progenitor cell populations during development [8]. Within the cells, up-regulation of the KIT pathway by FGFR2b signaling expands the KIT + progenitor cell population in the end buds and also regulates progenitor cells in the ducts, through interactions with the nerves [9]. Transplantation of c-Kit+ stem cells (derived either from bone marrow or the gland itself) into the glands of irradiated mice forms acini and im-proves tissue function [10]. However, while much work has focused on identifying genes in-volved in early development during morphogenesis of the salivary glands [11,12], regulation of the later stage of terminal differentiation remains relatively unstudied.
Differentiation of rat parotid salivary gland acinar cells occurs during the last week of gesta-tion and the first postnatal month [13]. Just before birth, parotid acinar cells are still poorly formed. Terminal clusters do not appear to have a lumen, and no electron dense granules are present in the cytoplasm. No secretions from these clusters have been seen at these early stages. Nuclei are centrally located and the endoplasmic reticulum (ER) and Golgi are small [13]. Aci-nar cells mature postnatally, gaining dense granules and increasing expression of salivary cargo proteins such as amylase, parotid secretory protein (Psp/ BPIFA2), and DNase I, and becoming polarized, until at around postnatal day 25 (P25) they are considered fully mature [14].
While regulatory pathways that drive terminal differentiation are unknown, studies in knockout mice have identified two relevant transcription factors. Deficiencies in either X-box binding protein 1 (Xbp1) or basic helix-loop-helix family, member a15 (Bhlha15, Mist1) impairs both salivary gland and exocrine pancreas development, and while each gland still de-velops in knockout mice, the acinar cells are either disorganized or poorly formed. Mist1 is a
and Craniofacial Research (http://www.nidcr.nih.gov/) to MAM. The funders had no role in study design, data collection and analysis, decision to publish, or preparation of the manuscript.
basic helix-loop-helix transcription factor that is specific to serous exocrine tissue [15–17]. Mist1knockout mice display disorganized acinar cells at two months of age that have lost their apical/basal polarity. Secretory granules in these mice are present but without clear localization, and nuclei are no longer basally located. Hence, in theMist1knockout mice the parotid gland develops, but the late stages of cellular differentiation are disrupted.Xbp1is an essential com-ponent of the ER stress response [18,19], as well as directing differentiation of immunoglobu-lin-secreting plasma cells, dendritic cells, osteoclasts and chondrocytes [20–22]. It is involved in the biogenesis and expansion of the ER to accommodate a higher protein load [23–25], and is highly expressed in exocrine tissue including the developing salivary glands [26]. The acini of submandibular salivary glands ofXbp1-/-; LivXbp1mice are smaller than their wild type coun-terparts and have lower expression of amylase [24]. However, the acinar cells still have abun-dant secretory granules and the impact of theXbp1knockout on submandibular development is much less profound than on the pancreas [20].Mist1andXbp1are apparently involved in acinar cell terminal differentiation. However, the regulatory network which drives differentia-tion, and how markers of terminal differentiation such as salivary proteins are activated, re-main unknown.
This project takes a systems biology approach to understanding parotid acinar tion by measuring both mRNA and microRNA expression changes across terminal differentia-tion. Using laser capture microdissection (LCM), acinar cells were isolated from developing glands at different times during differentiation. By measuring a large portion of the transcrip-tome over time, global patterns were identified as well as individual transcription factors appar-ently of importance to the process of differentiation.
Materials and Methods
Rat parotid laser capture microdissection
Parotid tissue was obtained from Sprague Dawley rats (Harlan laboratories) at 9 time points spanning development of the parotid gland, including embryonic day 18 (E18), E20, postnatal day 0 (P0; which is E22), P2, P5, P9, P15, P20, and P25.
Ethics Statement
This study was carried out in strict accordance with the recommendations in the Guide for the Care and Use of Laboratory Animals of the National Institutes of Health. The protocol was ap-proved by the Institutional Animal Care and Use Committee of the University of Louisville (Permit Number: 11059).
were dehydrated by washing in 100% ethanol and xylenes before being used for microdissection.
Laser capture microdissection (LCM) was performed on an Arcturus PixCellIIe LCM Sys-tem (Life Technologies/ Thermo Fisher Scientific) [27,28]. Caps containing CapSure transfer film carrier were applied to the tissue and cells were adhered to the cap using laser pulses. The cap was then checked under the microscope to ensure that contaminating cells were removed. Only caps containing pure populations of the cells of interest were used in subsequent experiments.
RNA isolation, microarrays, and qPCR arrays
RNA was isolated from the LCM caps using the RNaqueous micro kit (Ambion), per the man-ufacturer’s instructions. Briefly, once cells were isolated onto an LCM cap, lysis buffer was ap-plied immediately. Tubes were then incubated in a heat block at 42°C for 30 min. The lysates were either processed immediately or stored at -80°C. Lysates from multiple caps of the same sample, taken on the same day were combined before proceeding with isolation. At least three independent biological samples (from separate litters) were used for isolation of total RNA at each of the 9 time points. Quantity and quality of the total RNA was assessed using a 2100 Bioanalyzer (Agilent). Samples with a RIN value of at least 7 were used.
For analysis of mRNA expression, the Whole Transcriptome-Ovation Pico RNA amplifica-tion system (NuGen Technologies Inc.) was used to prepare amplified cDNA from total RNA for 9 time points of the developing parotid acinar cells. The biotin-cDNA was hybridized to 27 separate rat genome 230 2.0 Affymetrix GeneChips, having 31,099 probe sets. Results for each chip were analyzed using standard Robust Multi-array Average (RMA) method for back-ground correction, normalization and summary. Differential gene expression between time points (or between averaged stages of development) was determined by ANOVA or by using Linear Models for Microarray Data (LIMMA) software to test the false discovery rate (FDR)-adjusted significance of fits to several models (e.g., models with linear, quadratic, and cubic polynomials in time) [29]. Differentially expressed mRNAs were subsequently clustered using hierarchical clustering, and these clusters were analyzed for significant enrichment of biological processes (see description under Network Analysis below). Validation of the microarray data was performed using TaqMan Universal PCR Master Mix (Applied Biosystems; ABI) on an ABI 7500 Real-Time PCR System using TaqMan primers for the target mRNAs (Psp,Xbp1, andNupr1), and for controlRplp2mRNA. Data were analyzed with Sequence Detection Soft-ware v1.4 normalizing toRplp2expression between samples.
MicroRNA expression was measured by qRT-PCR at four time points during acinar differ-entiation: E20, P5, P15, and P25. A total of 372 primer pairs (miRCURY LNA, Exiqon) were used which amplify well annotated rodent microRNA sequences. Triplicate samples were run for each time point. Total RNA (1 ng) was used to synthesize cDNA (Exiqon’s Universal cDNA Synthesis Kit). The cDNA was then applied to microRNA Ready-to-Use PCR, Mou-se&Rat panel I, V1.M (Exiqon) per the manufacturer’s instructions. Briefly, each 20μl cDNA reaction was diluted 110x in nuclease free water and then combined 1:1 with 2x SYBR green master mix. The reactions were run on an ABI 7500 RT-PCR system. Missing replicates in the qRT-PCR data were imputed using the k-nearest neighbor algorithm, as described [30–32]
Metacore Analysis
Expression data for differentially expressed (DE) mRNAs were loaded into the knowledge-based program MetaCore (Thomson Reuters Inc., Carlsbad, CA). Statistically clustered sets of DE mRNAs were interrogated for enrichment of biological pathways using the using the Meta-core Gene Ontology enrichment analysis algorithm, with the Affymetrix Rat Genome 230 array as the background dataset. These clustered sets were also analyzed for significant enrich-ment of transcription factors to understand the active regulatory processes. Also, in order to identify regulatory pathways related to differentiation, a network was constructed initially based on the profiles of transcription factor mRNA expression over time. For example, an early increase of a transcription factor mRNA coincident or followed by an increased mRNA of a known target gene would suggest a possible network interaction. Possible interactions (edges) needed to be consistent with Metacore knowledge-based interactions, or supported by the pres-ence of an appropriate DNA-binding sequpres-ence in the target promoter. Interactions in initial networks were tested by transfections and‘pruned’as appropriate, and the network was ex-panded using Metacore's "expand" algorithm filtering for transcription regulatory interactions involving DE genes generated in this study. Targetscan [33–35] software was used to obtain predicted gene targets of DE microRNAs among the set of DE mRNAs. miRNAs predicted to target genes in the constructed network were added if their expression profiles had a statistical-ly significant inverse correlation. Metacore's Pathway Map Creator was used for visualization of the derived network.
Luciferase Reporter Transfections
Reporter assays were performed to experimentally test the predicted regulatory interactions (edges) of the network. Standard methods were used to clone the target gene promoters up-stream of luciferase in pGL4.10 vector. Expression plasmids for selected transcription factors were from Open Biosystems (Huntsville, AL) or Thermo Scientific (Waltham, MA) or were cloned by RT-PCR of rat genomic DNA into pCDNA4 (S1 Table). Luciferase reporter plasmids were transiently transfected into the rat parotid gland derived ParC5 cell line or the closely re-lated ParC10 [36,37] cells (obtained from Dr. Quissell's laboratory) plated on 6-well tissue cul-ture plates in DMEM/F12 media FBS and growth factors. Lipofectamine (Invitrogen) was used for luciferase promoter studies, following the manufacture’s guidelines. TheMist1 transcrip-tion factor expression clone was in pcDNA4 vector, and the splicedXbp1(Xbp1-S) expression vector was pFLAG.Xbp1p.CMV2 (Addgene; Cambridge, MA). In all experiments, pGL4.73-Re-nilla luciferase plasmid was co-transfected as an internal control for normalizing transfection efficiency. After 48 hours, cell extracts were prepared using Passive lysis buffer (Promega) and assayed for both firefly and Renilla luciferase activities using the Luciferase Assay and Renilla Luciferase Assay Systems from Promega with a Berthold Lumat LB9501 luminometer. The fold activation was calculated relative to cells transfected with the basal promoter-containing vec-tors alone. Each experiment was performed in triplicate, and repeated at least three times. Re-sults are given as means ±SEM.
Results
Gene expression changes during acinar cell differentiation
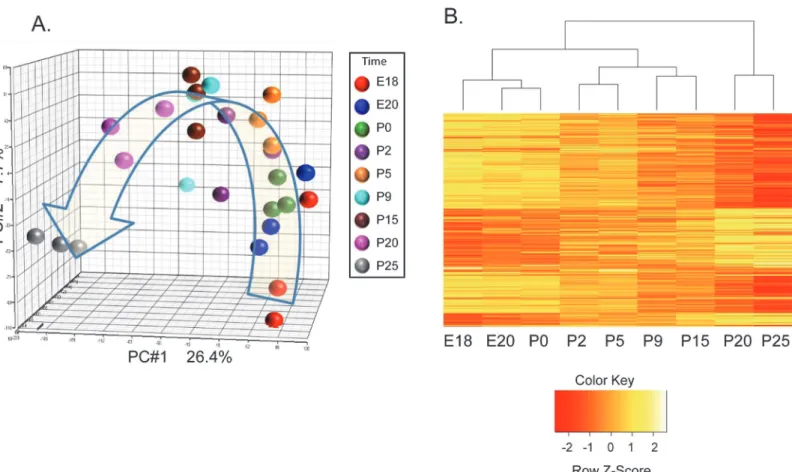
A unique aspect of this study is the application of laser capture microdissection (LCM) to pro-cure total RNA from populations of acinar cells across multiple time points. RNA from 9 time points from triplicate litters were collected across rat parotid gland development. These time points span pre-acinar terminal clusters, granule differentiation, and rapid maturation [13,14]. Populations of acinar cells were isolated from parotid tissue sections without appreciable con-tamination from surrounding ducts and connective tissue, as indicated by hematoxylin and eosin stained LCM sections (S1 Fig). Principal component analysis of results from 27 microar-rays showed appropriate grouping of the replicate samples, and indicates the major variability across the complete set of arrays is due to the different time points (Fig 1A). This supports the quality of the dataset. ANOVA of the entire dataset identified differential expression of 2656 mRNAs with FDR adjusted p-value of 0.05 or less. Hierarchical clustering of these 2656 mRNAs (Fig 1B) generated a dendrogram which suggests that the transcriptional profile entails four stages during parotid differentiation, e.g., embryonic (E18, E20, and P0), early postnatal (P2, and P5), middle postnatal (P9, and P15), and late postnatal (P20, and P25). The heat map indicates that relatively little change occurs in the prenatal period, but a large number of
Fig 1. Hierarchical Clustering Divides Parotid Acinar Cell Differentiation into Stages.(A) Principal component analysis (PCA) of the 27 microarrays of RNA samples taken in triplicate at nine time-points across acinar cell differentiation. The first three principal components are plotted on a three dimensional graph. Samples are largely clustered based on the replicate time points. (B) Hierarchical clustering of differentially expressed mRNAs displayed as a heatmap suggests the presence of 4 stages. 2656 genes were identified as differentially expressed by one-way ANOVA (FDR p<0.05). Image was generated using the heatmap.2 function in R and distance was calculated as dissimilarity = 1-r (correlation coefficient). Expression values are scaled (mean 0, std dev of 1) by rows.
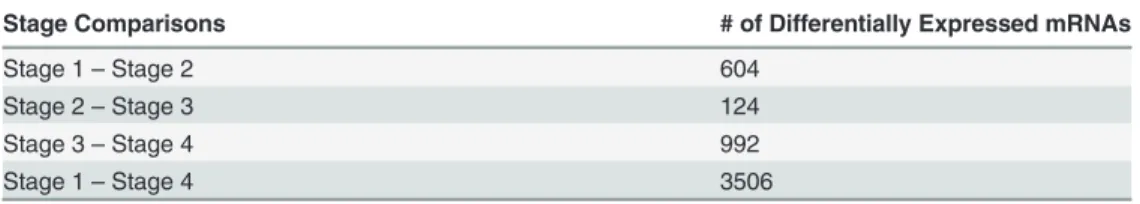
expression changes occur just after birth, and another large number of expression changes occur late in differentiation. This is consistent with previous reports based on expression of in-dividual proteins suggesting that terminal differentiation occurs in several stages [13,14]. In our study, direct comparison between adjacent stages identifies hundreds of significant changes of mRNA expression (Table 1). Similar statistical comparison between ages within a stage yields far fewer differentially expressed mRNAs (data not shown). In order to validate the mi-croarray data, a subset of genes was measured by qPCR. The expression patterns for 4 specific mRNAs (Psp,Xbp1, andNupr1) were tested by TaqMan qPCR with the same total RNA sam-ples, and yielded results similar to that of the microarrays (S2 Fig).
Clustering of Differentially Expressed mRNAs
All differentially expressed (DE) mRNAs were submitted to cluster analysis (Fig 2). Most mRNAs fell into progressively decreasing (DE cluster #1; 1635 mRNAs) or progressively in-creasing (DE cluster #2; 803 mRNAs) clusters. Metacore Gene Ontology (GO) enrichment analysis indicated that DE cluster #1 is significantly enriched for genes related to mitosis and the cell cycle. The top 6 processes and the top 4 pathway maps each involve cell cycle. All the significantly enriched processes and pathway maps are shown in supplementalS2 Table. Pro-gressively decreasing genes in DE cluster #1 includePCNA, cyclinD1/2, and cyclinB2, which are directly involved in regulation of cell cycle. In addition,Mcm 3,4,5,6,7,and 10, which are essential for the initiation of DNA synthesis each decrease across development. The observed gene enrichments are consistent with the parotid cells transitioning from actively dividing to terminally differentiated. In addition, this GO analysis suggested decreased expression of three signaling pathways which stimulate epithelial–mesenchymal transition (EMT) (Notch, TGFβ, hypoxia), consistent with the formation of the epithelium of the acini (S2 Table).
DE cluster #2 (genes with increasing expression) showed a completely different set of en-riched processes and pathways. This cluster is enen-riched in GO terms related to ion transport, lacrimal gland function, and the endoplasmic reticulum, such as ER-nucleus signaling and the unfolded protein response (S3 Table). As anticipated, this cluster includes increased expression of mRNAs related to parotid acinar cell function, e.g., secreted proteins (amylase, parotid secre-tory protein (Psp,Bpifa2e), lysozyme,Lbp, and lactoperoxidase) and multiple transmembrane transporters important to parotid function (Aquaporin 5,Orai1,Atp1a1,Nkcc1,Slc9a1, Slc41a2,Slc26a6,Slc39a2,Slc7a8,Kcc2,P2rx4). NKCC1 (Na+/K+/2Cl−cotransporter) protein is expressed specifically in the basolateral membrane of parotid acinar cells and knocking out its gene impairs salivation [39]. SLC9A1/Nhe1 (a Na+/H+ exchanger) is a major regulator of pH in parotid acinar cells [40]. This identifies genes related to parotid acinar cell function which show a progressive increase across differentiation. In order to understand factors impor-tant to gene regulation, the 803 genes in this cluster were tested for significant enrichment of targets of any transcription factors in the Metacore database. DE cluster #2 is significantly en-riched in targets of only 3 transcription factors,Mist1,Xbp1, and glucocorticoid receptor (S4 Table). BothMist1andXbp1are also members of this cluster. The increases seen in the Table 1. Gene Expression Comparisons between Developmental Stages.
Stage Comparisons # of Differentially Expressed mRNAs
Stage 1–Stage 2 604
Stage 2–Stage 3 124
Stage 3–Stage 4 992
Stage 1–Stage 4 3506
expression of mRNAs in this cluster support the utility of this dataset for modeling of parotid differentiation.
Interestingly, an additional cluster containing 106 differentially expressed mRNAs was identified having increased expression only in the mid-development stages (DE Cluster 4, Fig 2. Profiles of Differentially Expressed mRNAs during Differentiation.The time course microarray data were analyzed to identify differentially expressed mRNAs, which were clustered based on statistically significant similarities in the expression profiles. For visualization, the expression data for each gene was scaled to a mean of zero and standard deviation of 1 before plotting. The red line traces the average expression for the cluster.
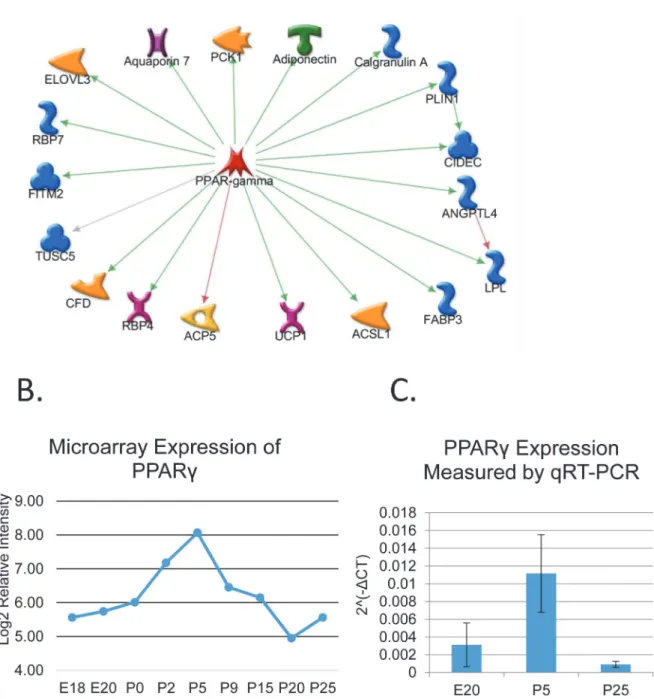
Fig 2). This cluster is highly enriched in genes involved in adipocyte differentiation and lipid metabolism, and includes transcription factorPparg(S5 Table). Transcription factor target analysis revealed a hub containingPpargand 18 known downstream targets (Fig 3A). qPCR of independent samples confirms transient up-regulation ofPpargmRNA expression around Fig 3. Transient Activation ofPpargduring Parotid Acinar Cell Differentiation.(A) Network showing transcription factorPpargand known downstream target genes found in DE Cluster 4 (Fig 2). DE Cluster 4 contains 106 genes (includingPparg) with a unique expression pattern; higher expression only in stages 2 and 3. The Metacore knowledge-base identifies 18 of these asPpargtarget genes. A green arrow indicates activation of transcription while red arrow indicates inhibition. A grey line means the interaction is uncharacterized. Although a red arrow connectsPpargandACP5, some publications list the interaction as activating [67,68] indicating it could be context dependent. (B) Log2 expression ofPpargfrom microarray data. (C) qPCR data confirming the expression profile ofPparg. RNA samples from independent animals were collected at three time points (E20, P5, and P25). Expression was normalized to Arbp, and data showed significant change in expression by ANOVA. n = 3.
postnatal day 5 (Fig 3C). This suggests a novel dimension of parotid differentiation involving Ppargregulation, yet. this agrees with the previous work of Mukunyadzi et al which found that adult parotid acinar cells do not expressPparg[41].Other statistical clusters derived from the DE mRNAs (Fig 2) had no significant GO enrichment.
Quadratic model mRNA clusters
To characterize gene expression patterns further, the microarray results were submitted to re-gression analysis to identify mRNAs significantly fitting either a quadratic or a cubic polynomi-al model (based on FDR-adjusted p vpolynomi-alues). Few (18 mRNAs) fit the cubic patterns and they were not investigated further (S4 Fig). However, after FDR correction, 430 mRNAs showed a significant match to quadratic trend models and were used for cluster analysis (Fig 4AandS3 Fig). The largest, Quadratic cluster #1, contained 118 mRNAs with high expression through most of differentiation and a strong decrease during the last stage. GO enrichment analysis identifies extracellular matrix and cell adhesion as relevant processes (S6 Table). This cluster contains collagens (Col1a1,Col5a2,Col1a2, and Collagen XIV) as well as other ECM proteins such as fibrillin-1, Tenascin C, and Laminin alpha 5. Tenascin C is typically expressed during organogenesis but not in adult tissues [42]. Apparently, these genes are involved in differentia-tion of the ECM and organogenesis, and decrease rapidly as the parotid gland completes devel-opment. Quadratic cluster #6 identifies an expression pattern which is reciprocal to #1; 49 mRNAs exhibited low expression throughout early and mid-development, but a strong in-crease was observed in the last stage (Fig 4B). Genes in this cluster includeChia, DNase1 and proline-rich protein 15 (Prp15) each of which are secreted salivary proteins.Fig 4B demon-strates that the full secretory repertoire is not established until the last stage of acinar cell differ-entiation. A separate cluster (Quadratic cluster #7,Fig 4A) independently identified a subset of those genes in DE cluster #4. This cluster also containsPpargand 4 of its target genes as de-scribed above, and as indicated by the GO enrichment analysis (S7 Table). Overall, cluster anal-yses of the results from the 27 microarrays supports the utility of this dataset by identifying patterns of mRNA expression which are consistent with our broad understanding of parotid development. Cluster analyses shows large changes in important salivary proteins even late in differentiation (Fig 4). In addition, this analysis suggests a novel role forPpargor closely related factors during the middle stages of parotid gland development.
MicroRNA expression changes during acinar cell differentiation
shown inFig 5B. The miRNA with the largest expression change, miR-375, increased more than 800-fold. This miRNA has been identified as being expressed in adult salivary glands. Its target gene,Plag1, is a transcription factor which stimulates proliferation, and the increase of miR-375 may therefore contribute to decreased proliferation during differentiation.Plag1is a proto-oncogene that is often up-regulated in pleomorphic adenomas of the salivary glands, a cancer that makes up 70% of parotid tumors. Expression of miR-375 is often down-regulated in salivary cancer cells [43].
Fig 4. mRNAs with a Quadratic Expression Pattern.Quadratic regression reveals late activation of acinar cell specific genes. (A) Quadratic regression analysis identified 430 genes having a significant quadratic trend (FDR<0.05), which were clustered into eight patterns. For visualization, the expression data for each gene was scaled to a mean of zero and standard deviation of 1 before plotting. The red line traces the average expression for the cluster. (B) Log2 plot of Quadratic Cluster 6 members with at least a 4-fold expression difference between P25 and E18. This shows late up-regulation of several genes known to produce salivary proteins (i.e.DNase I,Chitinase,Prp15,Sgp158/Prr21).
doi:10.1371/journal.pone.0125153.g004
Fig 5. miRNA Expression Changes in Parotid Acinar Cell Differentiation.Significant expression changes in miRNAs are seen across parotid acinar cell differentiation. (A) Heatmap of 79 miRNAs that are differentially expressed during parotid acinar differentiation, by one-way ANOVA (p<0.05). Heatmap was generated as inFig 1. (B) Log2 plots of miRNAs with large significant expression changes.
Transcription factor and microRNA regulatory network modeling
mRNA data were integrated with the microRNA array data to identify potential targets which could have biological significance during differentiation. Briefly, potential targets of the 64 DE miRNAs (identified by ANOVA and t-test) were generated in silico from the collection of 2656 mRNAs that changed significantly during differentiation. The computer algorithm Targetscan [44] was used to compile a list of predicted targets; a miRNA core sequence in a target mRNA 3’UTR was essential for inclusion in the model. Differentially expressed mRNAs were consid-ered as targets of interest, leading to the identification of 5184 potential target sites in 851 unique mRNAs (S8 Table). Interestingly, these genes are significantly enriched in DE cluster #1, and deficient in DE cluster #2 (Fig 2) (Fisher's exact test p-value<0.05) (S9 Table)
indicat-ing that miRNAs may have an important impact on overall gene expression trends durindicat-ing dif-ferentiation. Of the decreasing genes in DE cluster #1, 32% are predicted to be direct targets of microRNAs which increased expression.
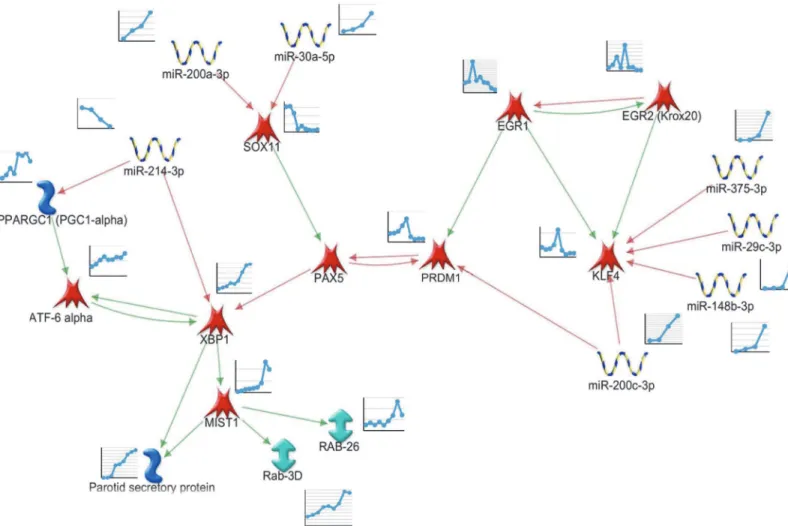
In order to identify regulatory pathways related to differentiation, all DE transcription fac-tor mRNAs, as well as predicted targeting miRNAs were used to generate putative regulafac-tory networks. The network was initially based on the profiles of transcription factor mRNA expres-sion over time, consistent with Metacore knowledge-based interactions, including potential links to markers of terminal differentiation (Psp, amylase, RABs). Nodes (mRNAs or miRNAs) or edges (predicted interactions) were only included where the predicted interactions matched the observed changes (increases or decreases) of the transcription factor target gene mRNA over time. miRNAs predicted to target mRNAs in the constructed network were only included if their expression profiles had a statistically significant inverse correlation. Initial networks were expanded using Metacore's "expand" algorithm, filtering for transcription regulatory in-teractions involving DE genes generated in this study. The derived network based on the ob-served changes of gene expression is depicted inFig 6, and was further investigated by transfection studies experimentally testing individual edges.
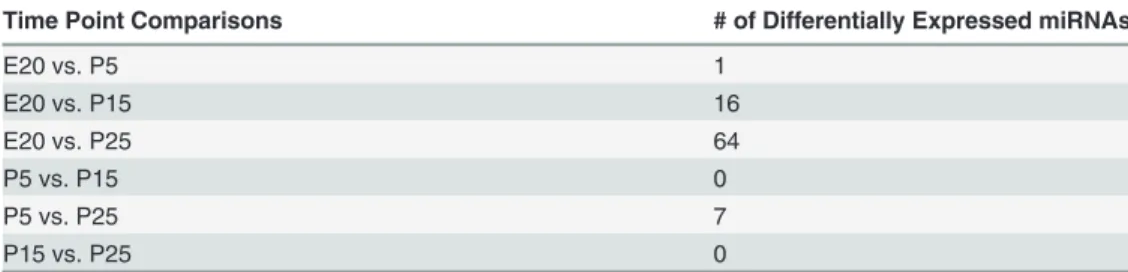
The hypothetical network (Fig 6) suggests that expression ofEgr1early in development maintains expression ofKlf4 [45].Similarly to the parotid,Egr1is highly expressed in hemato-poietic stem cells and decreases on differentiation [46].Klf4is involved in stem cell mainte-nance and inhibits terminal differentiation [47]. As development proceeds, the observed increases of miR-29c, miR-375, miR-148, and miR-200c may drive the observed decreased ex-pression ofKlf4mRNA.Sox11is initially strongly expressed, and is an activator of thePax5 gene, which is an inhibitor ofXbp1transcription factor gene expression [48]. Increasing ex-pression of miR-200a and miR-30a may combine to repress exex-pression ofSox11, thereby decreasing stimulation ofPax5.Prdm1(Blimp1) mRNA increases transiently during mid-dif-ferentiation, which may inhibitPax5. ThePrdm1-Pax5-Xbp1genes are reported to form a ge-netic switch which regulates the timing of differentiation of antibody secreting plasma B cells Table 2. MicroRNA Expression Changes between Time Points.
Time Point Comparisons # of Differentially Expressed miRNAs
E20 vs. P5 1
E20 vs. P15 16
E20 vs. P25 64
P5 vs. P15 0
P5 vs. P25 7
P15 vs. P25 0
[49,50]. This genetic switch has not previously been seen in parotid differentiation, and may contribute to the observed increase ofXbp1mRNA.
The observed decrease of miR-214 which may targetXbp1mRNA, combined with the posi-tive feedback loop betweenXbp1andAtf6alpha [51,52], would help maintain the observed el-evated expression ofXbp1. The observed increases in expression ofXbp1andMist1likely contribute to stimulating markers of terminal differentiation in the parotid gland such as sali-vary proteins and secretion-related proteins (as in Quad Cluster #6, above) and structural orga-nization of the acinar cell [15].
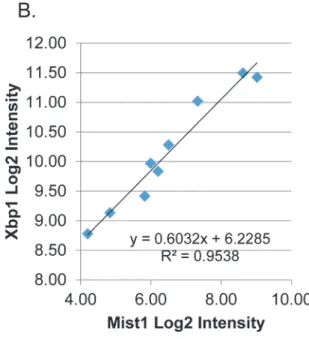
Eight of the proposed regulatory interactions (edges) of this network were directly tested by transfection experiments. According to the network,Xbp1is directly up-stream ofMist1 (Bhlha15) [53] [54].Mist1andXbp1in vivo expression increases 21-fold and 6.5-fold respec-tively between the earliest and latest time points (Fig 7A). Their expression pattern was signifi-cantly correlated across the time points measured (correlation coefficient = 0.97,
p-value = 1.410–5) (Fig 7B). Transfections of aMist1promoter (-500 - +15) luciferase construct
into immortalized rat parotid acinar cells (ParC5 cell line) confirmed direct activation of the Fig 6. Regulatory Network Driving Markers of Acinar Cell Differentiation.Genes and miRNAs were analyzed for either consistent or inverse expression changes during the time points measured. Selected genes were analyzed by Network Analysis (Metacore) to identify gene regulatory interactions, focusing particularly on parotid specific markers of terminal differentiation. A green line in the network indicates transcriptional activation, while a red line indicates inhibition. MicroRNA target genes were identified through Metacore and/or Targetscan and subsequently tested for inverse correlation.
Mist1promoter by the spliced (activated) form ofXbp1(Fig 7C). This experimentally supports the predicted interaction in this network.
Since our goal is to suggest a regulatory network relevant to parotid differentiation, an im-portant consideration was to anchor the predicted network to key parotid-specific proteins. Little is known regarding which transcription factors regulate major salivary proteins such as Pspor amylase.Pspexpression increases dramatically during acinar differentiation, particularly after birth. The tissue specific promoter region of this gene has been identified [55], but the transcription factors regulating its expression remain unidentified. Two CCACG boxes were identified -36 and -48 bp upstream of the transcription start site (S6 Fig). This sequence is part Fig 7.Xbp1RegulatesMist1Expression during Parotid Differentiation.(A) Log2 plot of microarray data forXbp1andMist1. (B) Expression ofXbp1and Mist1is highly correlated across parotid differentiation. Plot of Log2Xbp1vs. Log2Mist1shows a linear trend with R2= 0.9538. (C) Luciferase assay shows
activation ofMist1promoter byXbp1in ParC5 cells. Increasing amount ofXbp1-S (splicedXbp1) cDNA/well (0.25μg, 0.5μg, and 1μg) were co-transfected with a luciferase expression plasmid driven by aMist1promoter. Significant increase in luciferase expression was observed for all concentrations ofXbp1-S (p = 0.017, p = 0.01, and p = 0.05 respectively) (n = 3).
of the ER stress response element (ESRE) and is a consensus sequence forXbp1binding [51]. The spliced form ofXbp1(Xbp1-S) activated the 500 bp and 1kbPsppromoter in luciferase transfection experiments in ParC5 cells (Fig 8A). This supports that edge within the network, and indicates thatXbp1may directly contribute to the observed increase ofPspmRNA expres-sion during development.
Fig 8.Pspis Directly Regulated by bothXbp1andMist1.(A)Xbp1activates thePsppromoter. Increasing amounts ofXbp1-S cDNA was co-transfected into ParC5 cells along with a luciferase expression plasmid driven by either a 500 bp or 1 kb fragment of thePsppromoter region. Analysis was performed by t-test. Expression of luciferase driven by 1 kbPsppromoter increases significantly upon increasing transfection ofXbp1-S (p = 0.007, 0.02, and 0.005 respectively). The same is seen with the 500bpPsppromoter (p = 0.01, 0.01, and 0.003 respectively) (n = 3). (B)Mist1activates thePsppromoter through interactions with intronic sequences. Luciferase expression was driven by either a 1.5 kb fragment of thePsppromoter or the 1.5 kb fragment along with 1320 bp of intronic sequence flanking exon 3 that contains two E-boxes. Promoter plasmids were co-transfected withMist1andTcf3cDNA expression plasmids. Analysis was performed by t-test (p = 0.02) (n = 4).
Regulation of thePspgene by theMist1transcription factor was also investigated. Co-transfection ofMist1cDNA did not lead to activation of thePsp500 bp promoter (not shown), nor did it activate a 1.5 kbpPsppromoter construct even in the presence of theMist1 dimerization partnerTcf3/E2A [56](Fig 8B). Sequence analysis indicated the presence of two E-box sequences (CAGCTG) flanking exon 3 in the ratPspgene. Since these areMist1 consen-sus binding sites, a 1320 bp rat DNA fragment from the end of exon 2 through the start of exon 4 was cloned (S1 Table) into the 1.5 kbpPsppromoter-luciferase construct. This promoter +exon construct was activated 2.3-fold by co-transfection withMist1andTcf3cDNAs (p = 0.0227), whereas the 1.5 kbpPsppromoter was not activated (Fig 8B). NeitherTcf3nor Mist1alone significantly activated thePspreporter construct (not shown).Tcf3was included in these experiments as a heterodimerization partner withMist1. SinceTcf3mRNA was not dif-ferentially expressed (p = 0.25), it is not included in the proposed regulatory network, however, it is constitutively expressed throughout acinar cell differentiation. WhileTcf3is typically pres-ent in most cell types, it apparpres-ently has inadequate levels in the ParC5 cells used for transfec-tions. Overall, these experiments indicate that the increase ofMist1expression during acinar differentiation contributes to the increase ofPspgene expression through binding sites flanking exon 3.
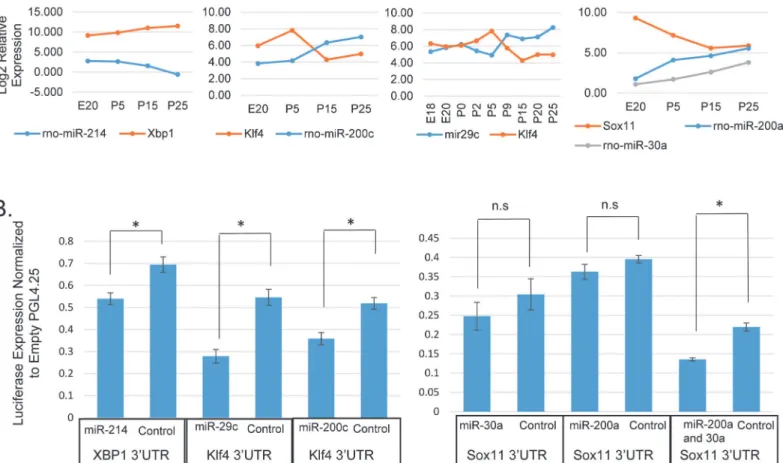
Seven miRNAs are included in the network through predicted target sites in five of the tran-scription factor mRNAs (Fig 6). Four miRNAs, which increased expression late in differentia-tion, are predicted to targetKlf4mRNA. This includes miR-29c, which has been shown to regulateKlf4expression in breast cancer cells. Loss of miR-29c in those cells results in dediffer-entiation due toKlf4, leading to a population of stem-like cells [57].Fig 9Ashows the Log2 rel-ative expression of miR-29c during acinar differentiation compared to that ofKlf4mRNA.Klf4 does not decrease in expression until late in postnatal development when miR-29c increases. Expression of these two genes are negatively correlated across acinar differentiation (Pearson’s r = -0.79; p = 0.011). In order to test potential miRNA target genes, HEK293 cells were co-transfected with a miRNA mimic and a luciferase expressing plasmid containing a 3'UTR of in-terest. Transfection experiments confirmed repression of ratKlf4by miR-29c (Fig 9B). Several other miRNAs are predicted to targetKlf4, among them miR-200c, which has relatively low ex-pression in the embryo and early postnatal gland but significantly increased in exex-pression by P15. It has been shown thatKlf4is targeted by miR-200c [57,58], and luciferase assays con-firmed this interaction in a parotid cell line (Fig 9B).
Xbp1mRNA increased expression 6.5-fold across differentiation, while its targeting miR-214 decreased more than 10-fold (Fig 9A).Xbp13'UTR contains a known miR-214 binding site in humans [59]. Although this sequence is not conserved in rats (S7 Fig), the rat 3'UTR contains an alternate miR-214 predicted binding site, which was cloned into a reporter, and co-transfection experiments demonstrate repression of ratXbp1by miR-214 (Fig 9B).
Sox11expression decreased significantly after birth, and it is predicted to be targeted by sev-eral differentially expressed miRNAs. Assays with miR-200a, and miR-30a did not show any repression of the reporter, however, a construct containing binding sites for both miR-200a and miR-30a was repressed when co-transfected with both miRNAs (Fig 9B), indicating that these miRNAs are acting cooperatively to repress expression. Taken together, these miRNA transfection experiments provide experimental support for five of the edges in the proposed network.
Discussion
process of parotid acinar cell differentiation. Based on these profiles, we have generated a regu-latory network which suggests transitions in gene expression driving parotid differentiation. The focus on acinar cell differentiation is supported by the use of laser-capture microdissection to isolate developing acinar cells at multiple time points. Incorporating time as a variable in this study allows comparison of the profile of expression of a transcription factor mRNA with the profile of a putative regulated gene. Co-variance supports inclusion of the transcription factor and its target gene in the regulatory network. Similarly, microRNAs were only included in the network when the profile of expression of the microRNA was inversely related to that of the target mRNA. This ensures that the network has both knowledge-based and expression level support which strengthens the results. This putative network provides a context for changes in transcription factors which regulate differentiation. The network identifies two main branches; initial expression of stemness factors (Sox11,Klf4,and EGR1,none of which have been describe before in parotid differentiation) which inhibit differentiation, and subse-quent switch to anXbp1pathway which drives and maintains markers of terminal differentia-tion. Our network suggests that Klf4 is initially regulated by Egr1 and, remarkably,
subsequently repressed by 4 different miRNAs which increase strongly in the late stages. We demonstrate that either miR-200c or miR-29c can down-regulate the expression ofKlf4. By Fig 9. miRNA Target Genes Involved in a Regulatory Network.(A) Log2 plots of microarray and qPCR expression profiles for miRNAs and their predicted target genes: miR-214, andXbp1; miR-29c, miR-200c andKlf4; and miR-30a, miR-200a, andSox11. (B) miRNAs repress expression of their target genes as shown by luciferase assay. 3'UTRs were cloned downstream of luciferase and co-transfected along with a miRNA mimic. Analysis was done by two-sample t-test as in Jacobs et al. [38] comparing the targeting miRNA with a control miRNA. (n = 3 for miR-29c, miR-200a, miR-200c, and miR-200a/30a) (n = 4 for miR-30a and miR-214) (p = 0.014, 0.012, 0.025, 0.28, 0.23, and 0.017 respectively).
affecting its expression, these miRNAs could be important drivers of terminal differentiation. This is one example of the broad observation that miRNAs have extensive roles driving parotid differentiation. Remarkably, 52 significantly increasing miRNAs target 524 significantly de-creasing mRNAs, potentially contributing to direct regulation of 32% of the DE cluster #1 mRNAs.
Sox11expression was elevated in embryonic stage acinar cells, decreasing dramatically im-mediately after birth apparently due to concerted action by both miR-200a and miR-30a. Sox11is important in neurogenesis and involved in stem cell survival [60], and its down-stream factor, Tead2, is involved in maintaining ES cell identity and inhibiting differentiation [61]. In our mRNA profiles,Tead2directly parallelsSox11expression across parotid differentiation. Hence, repressingSox11promotes differentiation and also diminishes a stemness program. Sox11directly activates transcription of thePax5gene [48].Sox11is not expressed in normal lymphoid progenitor cells, however, in mantle cell lymphoma tumors it activatesPax5thereby blocking differentiation [48]. WhilePax5probes were not present in the microarray used in the current experiments, we infer that its expression decreases downstream ofSox11expression changes. Pax5 is a transcriptional inhibitor ofXbp1, and decreasing its expression would con-tribute toXbp1activation. ThePrdm1-Pax5-Xbp1genetic switch is well characterized in differ-entiating immune plasma cells [49,50], and we suggest is active in parotid acinar cells, with the additional regulation bySox11.
Parotid acinar expression ofXbp1is apparently maintained low in the embryo by dual re-pression entailing both direct rere-pression by miR-214, and indirectly bySox11activating the Pax5 repressor. Studies ofXbp1knockout mice have underscored the requirement for this tran-scription factor in pancreatic acinar development [24]. Pancreatic acinar cells ofXbp1null mice have poorly organized and sparse ER, virtually no secretory granules and pancreatic amy-lase is almost undetectable. In contrast, the submandibular salivary gland is less profoundly af-fected showing abundant secretory granules (although smaller), and only a 50% reduction of salivary amylase [24]. While the parotid gland inXbp1-null mice was not described, based on the proposed regulatory network we would predict a dramatic impairment of parotid differen-tiation, more similar to the pancreas. Xbp1 and Mist1 likely work as 'scaling' factors, a concept developed by Mills et al. [62] which contributes to quantitative differentiation.
Downstream ofXbp1, the serous exocrine specific transcription factorMist1is up-regulated. We confirm direct regulation of theMist1promoter byXbp1in a parotid cell line (Fig 7C). Sev-eralMist1target genes (Rab3DandRab26) are also up-regulated, likely contributing to cell maturation [63]. We also used parotid secretory protein (Psp,Bpifa2) as a marker of terminal differentiation since it is almost exclusively expressed in parotid acinar cells and is one of the most abundant salivary proteins. PSP is a lipid and LPS-binding salivary protein with anti-in-flammatory and antimicrobial activity [64,65]. Transfection studies (Fig 8) demonstrate for the first time that eitherXbp1orMist1can directly activate expression of thePspgene, acting at binding sites either in the promoter (Xbp1) or in introns (Mist1). In theMist1knockout mice both pancreatic and parotid acinar cells are severely disorganized, although some secreto-ry granules are present andRab3DmRNA is expressed at 50% of normal [17]. Our observation that eitherXbp1orMist1can activatePspsuggests that the incomplete disruption of the acinar phenotype inMist1-null parotid may be due to the ability ofXbp1to‘work around’Mist1to ac-tivate terminal markers of differentiation. In this view,Xbp1andMist1act in concert, rather than sequentially, to drive differentiation.
differentiation, but its role in the salivary gland has not been investigated. According to our data, bothRxraandRaraare expressed throughout acinar cell development. Either of these genes could be available for dimerization withPparg. The cofactorPgc1α(also termedPpargc1) mRNA is strongly up-regulated following thePparg-related peak, potentially throughPparg and RXR binding sites within thePgc1αgene.Pgc1α/βdirects maturation of cardiac myocytes [66], and could contribute to maintaining ATF6αexpression during differentiation of the pa-rotid. However, the role of the transient expression ofPpargand related factors in parotid dif-ferentiation remains unknown.
We have used LCM to isolate developing parotid acinar cells in a nearly comprehensive ap-proach to identify profiles of mRNAs and miRNAs which drive terminal differentiation. Clus-ter analysis shows 4 stages of development with strongly increased expression of key parotid genes, including several secreted cargo proteins, in the final stage (Fig 6B). Data from 27 micro-arrays plus additional miRNA micro-arrays generated a transcription factor regulatory network which provides important context for transcriptional changes which drive parotid differentia-tion. We have validated 8 of the edges in the proposed network, and other edges are supported by interactions reported in other tissues. Future work is needed to expand this network to in-clude extracellular signaling pathways and epigenetic changes which are important for differ-entiation. Nonetheless, the genes identified in this network provide additional targets and markers for research into bioengineering or regeneration of salivary glands. Characterization of expression of these genes during radiation-induced destruction of salivary glands may con-tribute to a molecular understanding of the loss of salivary function.
Supporting Information
S1 Fig. LCM Cap Images.Using LCM, parotid acini were able to be isolated in both embryonic and postnatal tissue. (A) H&E stained cryosections (5μm) of rat parotid gland from embryonic day 20 (E20) and postnatal day 25 (P25). (B) Subsequent capture of cells on LCM cap, shows acinar cell isolation without appreciable contamination of ductal cells or connective tissue. (PDF)
S2 Fig. qPCR Validation of Microarray Measurements.Taqman qRT-PCR was run on tripli-cate RNA samples spanning nine time points of parotid acinar differentiation, using primers that amplifyPsp,Xbp1, andNupr1. Expression ofRplp2was used for normalization. The ex-pression profiles (plotted in Log base 10) replicate the increase in exex-pression seen in the microarrays.
(PDF)
S3 Fig. Heatmap of Genes with Quadratic Expression Pattern.Quadratic regression was used to identify mRNAs with expression profiles that significantly match a quadratic model.430 were identified as having a significant match (p-value = 0.05) and a heatmap was generated using a dissimilarity distance matrix.
(PDF)
S4 Fig. Cluster Analysis of Genes with Cubic Pattern.Genes with a significant cubic trend were clustered into the above 5 expression profiles. Only 18 genes were available for clustering and most clusters have only a few genes.
(PDF)
gray. The red line traces the average expression for the cluster. (PDF)
S6 Fig. Transcription Factor Binding Sites in the RatPspGene.(A) thePsppromoter con-tains two CCACG boxes which is a consensus sequence forXbp1binding. (B) Two E-boxes flank exon 3 in thePspgene which match the Mist1-binding consensus sequence.
(PDF)
S7 Fig. MiR-214 Target Sites in Rat Xbp1.(A) The human miR-214 binding site in the Xbp1 3'UTR is not conserved in rat (targetscan.org). (B) However the rat sequence contains a pre-dicted miR-214 binding site about 600 bp upstream.
(PDF)
S1 Table. Cloning Primers.Cloning primers used for luciferase based assays. (PDF)
S2 Table. Enrichment Analysis Cluster 1.GO enrichment analysis of DE cluster #1 (Fig 2). (XLSX)
S3 Table. Enrichment Analysis Cluster 2.GO enrichment analysis of DE cluster #2 (Fig 2). (XLSX)
S4 Table. Transcription Factor Enrichment Cluster 2.Enrichment of transcription factor tar-gets in DE cluster #2 (Fig 2).
(PDF)
S5 Table. Enrichment Analysis Cluster 4.GO enrichment analysis of DE cluster #4 (Fig 2). (XLSX)
S6 Table. Enrichment Analysis Quadratic Cluster 1.GO enrichment analysis of quadratic cluster #1 (Fig 4).
(XLSX)
S7 Table. Enrichment Analysis Quadratic Cluster 7.GO enrichment analysis of quadratic cluster #7 (Fig 4).
(XLSX)
S8 Table. Predicted miRNA Targets.Predicted target genes were generated in Targetscan for differentially expressed miRNAs.
(XLSX)
S9 Table. miRNA Target Enrichment.Target gene enrichment analysis. Enrichment of DE clusters in predicted miRNA target genes.
(XLSX)
Acknowledgments
This publication is dedicated to the memory of Srirangapatnam G. Venkatesh who passed away on November 1, 2013. His commitment to research made this project possible.
Author Contributions
References
1. Guchelaar HJ, Vermes A, Meerwaldt JH. Radiation-induced xerostomia: pathophysiology, clinical course and supportive treatment. Support Care Cancer. 1997; 5(4):281–8. PMID:9257424.
2. Amerongen AV, Veerman EC. Saliva—the defender of the oral cavity. Oral Dis. 2002; 8(1):12–22. PMID:11936451.
3. Guggenheimer J, Moore PA. Xerostomia: etiology, recognition and treatment. J Am Dent Assoc. 2003; 134(1):61–9; quiz 118–9. PMID:12555958.
4. Dirix P, Nuyts S, Van den Bogaert W. Radiation-induced xerostomia in patients with head and neck cancer: a literature review. Cancer. 2006; 107(11):2525–34. doi:10.1002/cncr.22302PMID: 17078052.
5. Jensen SB, Pedersen AM, Vissink A, Andersen E, Brown CG, Davies AN, et al. A systematic review of salivary gland hypofunction and xerostomia induced by cancer therapies: management strategies and economic impact. Support Care Cancer. 2010; 18(8):1061–79. doi:10.1007/s00520-010-0837-6 PMID:20333412.
6. Nanduri LS, Maimets M, Pringle SA, van der Zwaag M, van Os RP, Coppes RP. Regeneration of irradi-ated salivary glands with stem cell marker expressing cells. Radiother Oncol. 2011; 99(3):367–72. doi: 10.1016/j.radonc.2011.05.085PMID:21719134.
7. Chambers MS, Garden AS, Kies MS, Martin JW. Radiation-induced xerostomia in patients with head and neck cancer: pathogenesis, impact on quality of life, and management. Head Neck. 2004; 26 (9):796–807. doi:10.1002/hed.20045PMID:15350026.
8. Knox SM, Lombaert IM, Reed X, Vitale-Cross L, Gutkind JS, Hoffman MP. Parasympathetic innervation maintains epithelial progenitor cells during salivary organogenesis. Science. 2010; 329(5999):1645–7. doi:10.1126/science.1192046PMID:20929848; PubMed Central PMCID: PMC3376907.
9. Lombaert IM, Abrams SR, Li L, Eswarakumar VP, Sethi AJ, Witt RL, et al. Combined KIT and FGFR2b Signaling Regulates Epithelial Progenitor Expansion during Organogenesis. Stem cell reports. 2013; 1 (6):604–19. doi:10.1016/j.stemcr.2013.10.013PMID:24371813; PubMed Central PMCID:
PMC3871401.
10. Nanduri LS, Lombaert IM, van der Zwaag M, Faber H, Brunsting JF, van Os RP, et al. Salisphere de-rived c-Kit+ cell transplantation restores tissue homeostasis in irradiated salivary gland. Radiother Oncol. 2013; 108(3):458–63. doi:10.1016/j.radonc.2013.05.020PMID:23769181.
11. Musselmann K, Green J, Sone K, Hsu J, Bothwell I, Johnson S, et al. Salivary gland gene expression atlas identifies a new regulator of branching morphogenesis. Journal of dental research. 2011; 90 (9):1078–84. doi:10.1177/0022034511413131PMID:21709141
12. Rebustini IT, Hayashi T, Reynolds AD, Dillard ML, Carpenter EM, Hoffman MP. miR-200c regulates FGFR-dependent epithelial proliferation via Vldlr during submandibular gland branching morphogene-sis. Development. 2012; 139(1):191–202. doi:10.1242/dev.070151PMID:22115756
13. Redman RS, Sreebny LM. Morphologic and biochemical observations on the development of the rat parotid gland. Dev Biol. 1971; 25(2):248–79. PMID:5562853.
14. Sivakumar S, Mirels L, Miranda AJ, Hand AR. Secretory protein expression patterns during rat parotid gland development. Anat Rec. 1998; 252(3):485–97. PMID:9811227.
15. Pin CL, Rukstalis JM, Johnson C, Konieczny SF. The bHLH transcription factor Mist1 is required to maintain exocrine pancreas cell organization and acinar cell identity. J Cell Biol. 2001; 155(4):519–30. doi:10.1083/jcb.200105060PMID:11696558; PubMed Central PMCID: PMC2198859.
16. Lemercier C, To RQ, Swanson BJ, Lyons GE, Konieczny SF. Mist1: a novel basic helix-loop-helix tran-scription factor exhibits a developmentally regulated expression pattern. Dev Biol. 1997; 182(1):101– 13. doi:10.1006/dbio.1996.8454PMID:9073453.
17. Johnson CL, Kowalik AS, Rajakumar N, Pin CL. Mist1 is necessary for the establishment of granule or-ganization in serous exocrine cells of the gastrointestinal tract. Mechanisms of development. 2004; 121 (3):261–72. doi:10.1016/j.mod.2004.01.003PMID:15003629.
18. Yoshida H, Matsui T, Yamamoto A, Okada T, Mori K. XBP1 mRNA is induced by ATF6 and spliced by IRE1 in response to ER stress to produce a highly active transcription factor. Cell. 2001; 107(7):881– 91. PMID:11779464.
19. Shen X, Ellis RE, Lee K, Liu CY, Yang K, Solomon A, et al. Complementary signaling pathways regu-late the unfolded protein response and are required for C. elegans development. Cell. 2001; 107 (7):893–903. PMID:11779465.
21. Xu G, Liu K, Anderson J, Patrene K, Lentzsch S, Roodman GD, et al. Expression of XBP1s in bone marrow stromal cells is critical for myeloma cell growth and osteoclast formation. Blood. 2012; 119 (18):4205–14. doi:10.1182/blood-2011-05-353300PMID:22427205
22. Tsang KY, Chan D, Cheslett D, Chan WC, So CL, Melhado IG, et al. Surviving endoplasmic reticulum stress is coupled to altered chondrocyte differentiation and function. PLoS biology. 2007; 5(3):e44. PMID:17298185
23. Calfon M, Zeng H, Urano F, Till JH, Hubbard SR, Harding HP, et al. IRE1 couples endoplasmic reticu-lum load to secretory capacity by processing the XBP-1 mRNA. Nature. 2002; 415(6867):92–6. doi:10. 1038/415092aPMID:11780124.
24. Lee AH, Chu GC, Iwakoshi NN, Glimcher LH. XBP-1 is required for biogenesis of cellular secretory ma-chinery of exocrine glands. Embo J. 2005; 24(24):4368–80. doi:10.1038/sj.emboj.7600903PMID: 16362047; PubMed Central PMCID: PMC1356340.
25. Sriburi R, Jackowski S, Mori K, Brewer JW. XBP1: a link between the unfolded protein response, lipid biosynthesis, and biogenesis of the endoplasmic reticulum. J Cell Biol. 2004; 167(1):35–41. doi:10. 1083/jcb.200406136PMID:15466483; PubMed Central PMCID: PMC2172532.
26. Clauss IM, Gravallese EM, Darling JM, Shapiro F, Glimcher MJ, Glimcher LH. In situ hybridization stud-ies suggest a role for the basic region-leucine zipper protein hXBP-1 in exocrine gland and skeletal de-velopment during mouse embryogenesis. Dede-velopmental dynamics: an official publication of the American Association of Anatomists. 1993; 197(2):146–56. doi:10.1002/aja.1001970207PMID: 7693055.
27. Wittliff JL. Laser capture microdissection and its applications in genomics and proteomics. Techniques in Confocal Microscopy, ed by Conn PM ( Elsevier, Oxford, 2010). 2010:463–78.
28. Andres SA, Wittliff JL. Relationships of ESR1 and XBP1 expression in human breast carcinoma and stromal cells isolated by laser capture microdissection compared to intact breast cancer tissue. Endo-crine. 2011; 40(2):212–21. doi:10.1007/s12020-011-9522-xPMID:21858728
29. Smyth GK. Limma: linear models for microarray data. Bioinformatics and computational biology solu-tions using R and Bioconductor: Springer; 2005. p. 397–420.
30. Oh S, Kang DD, Brock GN, Tseng GC. Biological impact of missing-value imputation on downstream analyses of gene expression profiles. Bioinformatics. 2011; 27(1):78–86. doi:10.1093/bioinformatics/ btq613PMID:21045072
31. Warner DR, Mukhopadhyay P, Brock G, Webb CL, Michele Pisano M, Greene RM. MicroRNA expres-sion profiling of the developing murine upper lip. Development, growth & differentiation. 2014.
32. Troyanskaya O, Cantor M, Sherlock G, Brown P, Hastie T, Tibshirani R, et al. Missing value estimation methods for DNA microarrays. Bioinformatics. 2001; 17(6):520–5. PMID:11395428
33. Lewis BP, Burge CB, Bartel DP. Conserved seed pairing, often flanked by adenosines, indicates that thousands of human genes are microRNA targets. Cell. 2005; 120(1):15–20. PMID:15652477
34. Grimson A, Farh KK-H, Johnston WK, Garrett-Engele P, Lim LP, Bartel DP. MicroRNA targeting speci-ficity in mammals: determinants beyond seed pairing. Molecular cell. 2007; 27(1):91–105. PMID: 17612493
35. Friedman RC, Farh KK-H, Burge CB, Bartel DP. Most mammalian mRNAs are conserved targets of microRNAs. Genome research. 2009; 19(1):92–105. doi:10.1101/gr.082701.108PMID:18955434
36. Quissell DO, Barzen KA, Redman RS, Camden JM, Turner JT. Development and characterization of SV40 immortalized rat parotid acinar cell lines. In vitro cellular & developmental biology Animal. 1998; 34(1):58–67. doi:10.1007/s11626-998-0054-5PMID:9542637.
37. Quissell DO, Turner JT, Redman RS. Development and characterization of immortalized rat parotid and submandibular acinar cell lines. European journal of morphology. 1998; 36 Suppl:50–4. PMID: 9825893.
38. Jacobs JL, Dinman JD. Systematic analysis of bicistronic reporter assay data. Nucleic acids research. 2004; 32(20):e160. doi:10.1093/nar/gnh157PMID:15561995; PubMed Central PMCID: PMC534638.
39. Evans RL, Park K, Turner RJ, Watson GE, Nguyen HV, Dennett MR, et al. Severe impairment of saliva-tion in Na+/K+/2Cl- cotransporter (NKCC1)-deficient mice. J Biol Chem. 2000; 275(35):26720–6. doi: 10.1074/jbc.M003753200PMID:10831596.
40. Nguyen HV, Shull GE, Melvin JE. Muscarinic receptor-induced acidification in sublingual mucous aci-nar cells: loss of pH recovery in Na+-H+ exchanger-1 deficient mice. The Journal of physiology. 2000; 523 Pt 1:139–46. PMID:10673550; PubMed Central PMCID: PMC2269782.
42. Chiquet-Ehrismann R. Tenascins. The international journal of biochemistry & cell biology. 2004; 36 (6):986–90. doi:10.1016/j.biocel.2003.12.002PMID:15094113.
43. Zhang X, Cairns M, Rose B, O'Brien C, Shannon K, Clark J, et al. Alterations in miRNA processing and expression in pleomorphic adenomas of the salivary gland. Int J Cancer. 2009; 124(12):2855–63. doi: 10.1002/ijc.24298PMID:19347935.
44. Lewis BP, Shih IH, Jones-Rhoades MW, Bartel DP, Burge CB. Prediction of mammalian microRNA tar-gets. Cell. 2003; 115(7):787–98. PMID:14697198.
45. Lai J-K, Wu H-C, Shen Y-C, Hsieh H-Y, Yang S-Y, Chang C-C. Krüppel-like factor 4 is involved in cell scattering induced by hepatocyte growth factor. Journal of cell science. 2012; 125(20):4853–64. doi: 10.1242/jcs.108910PMID:22854048
46. Min IM, Pietramaggiori G, Kim FS, Passegue E, Stevenson KE, Wagers AJ. The transcription factor EGR1 controls both the proliferation and localization of hematopoietic stem cells. Cell stem cell. 2008; 2(4):380–91. doi:10.1016/j.stem.2008.01.015PMID:18397757.
47. Liu X, Huang J, Chen T, Wang Y, Xin S, Li J, et al. Yamanaka factors critically regulate the developmen-tal signaling network in mouse embryonic stem cells. Cell Res. 2008; 18(12):1177–89. doi:10.1038/cr. 2008.309PMID:19030024.
48. Vegliante MC, Palomero J, Pérez-Galán P, Roué G, Castellano G, Navarro A, et al. SOX11 regulates PAX5 expression and blocks terminal B-cell differentiation in aggressive mantle cell lymphoma. Blood. 2013; 121(12):2175–85. doi:10.1182/blood-2012-06-438937PMID:23321250
49. Shaffer AL, Shapiro-Shelef M, Iwakoshi NN, Lee AH, Qian SB, Zhao H, et al. XBP1, downstream of Blimp-1, expands the secretory apparatus and other organelles, and increases protein synthesis in plasma cell differentiation. Immunity. 2004; 21(1):81–93. doi:10.1016/j.immuni.2004.06.010PMID: 15345222.
50. Nera KP, Kohonen P, Narvi E, Peippo A, Mustonen L, Terho P, et al. Loss of Pax5 promotes plasma cell differentiation. Immunity. 2006; 24(3):283–93. doi:10.1016/j.immuni.2006.02.003PMID: 16546097.
51. Yamamoto K, Yoshida H, Kokame K, Kaufman RJ, Mori K. Differential contributions of ATF6 and XBP1 to the activation of endoplasmic reticulum stress-responsive cis-acting elements ERSE, UPRE and ERSE-II. Journal of biochemistry. 2004; 136(3):343–50. doi:10.1093/jb/mvh122PMID:15598891.
52. Lee AH, Iwakoshi NN, Glimcher LH. XBP-1 regulates a subset of endoplasmic reticulum resident chap-erone genes in the unfolded protein response. Mol Cell Biol. 2003; 23(21):7448–59. PMID:14559994; PubMed Central PMCID: PMC207643.
53. Huh WJ, Esen E, Geahlen JH, Bredemeyer AJ, Lee AH, Shi G, et al. XBP1 controls maturation of gas-tric zymogenic cells by induction of MIST1 and expansion of the rough endoplasmic reticulum. Gastro-enterology. 2010; 139(6):2038–49. doi:10.1053/j.gastro.2010.08.050PMID:20816838; PubMed Central PMCID: PMC2997137.
54. Acosta-Alvear D, Zhou Y, Blais A, Tsikitis M, Lents NH, Arias C, et al. XBP1 controls diverse cell type-and condition-specific transcriptional regulatory networks. Molecular cell. 2007; 27(1):53–66. doi:10. 1016/j.molcel.2007.06.011PMID:17612490.
55. Mikkelsen TR, Brandt J, Larsen HJ, Larsen BB, Poulsen K, Ingerslev J, et al. Tissue-specific expres-sion in the salivary glands of transgenic mice. Nucleic acids research. 1992; 20(9):2249–55. PMID: 1594444; PubMed Central PMCID: PMC312338.
56. Lemercier C, Brown A, Mamani M, Ripoche J, Reiffers J. The rat Mist1 gene: structure and promoter characterization. Gene. 2000; 242(1–2):209–18. PMID:10721714.
57. Cittelly DM, Finlay-Schultz J, Howe EN, Spoelstra NS, Axlund SD, Hendricks P, et al. Progestin sup-pression of miR-29 potentiates dedifferentiation of breast cancer cells via KLF4. Oncogene. 2013; 32 (20):2555–64. doi:10.1038/onc.2012.275PMID:22751119.
58. Wellner U, Schubert J, Burk UC, Schmalhofer O, Zhu F, Sonntag A, et al. The EMT-activator ZEB1 pro-motes tumorigenicity by repressing stemness-inhibiting microRNAs. Nature cell biology. 2009; 11 (12):1487–95. doi:10.1038/ncb1998PMID:19935649.
59. Duan Q, Wang X, Gong W, Ni L, Chen C, He X, et al. ER stress negatively modulates the expression of the miR-199a/214 cluster to regulates tumor survival and progression in human hepatocellular cancer. PloS one. 2012; 7(2):e31518. doi:10.1371/journal.pone.0031518PMID:22359598; PubMed Central PMCID: PMC3281082.
61. Tamm C, Böwer N, Annerén C. Regulation of mouse embryonic stem cell self-renewal by a Yes–YAP– TEAD2 signaling pathway downstream of LIF. Journal of cell science. 2011; 124(7):1136–44.
62. Mills JC, Taghert PH. Scaling factors: transcription factors regulating subcellular domains. Bioessays. 2012; 34(1):10–6. doi:10.1002/bies.201100089PMID:22028036
63. Tian X, Jin RU, Bredemeyer AJ, Oates EJ, Blazewska KM, McKenna CE, et al. RAB26 and RAB3D are direct transcriptional targets of MIST1 that regulate exocrine granule maturation. Mol Cell Biol. 2010; 30 (5):1269–84. doi:10.1128/MCB.01328-09PMID:20038531; PubMed Central PMCID: PMC2820885.
64. Abdolhosseini M, Sotsky JB, Shelar AP, Joyce PB, Gorr S-U. Human parotid secretory protein is a lipo-polysaccharide-binding protein: identification of an anti-inflammatory peptide domain. Molecular and cellular biochemistry. 2012; 359(1–2):1–8.
65. Venkatesh S, Goyal D, Carenbauer A, Darling D. Parotid secretory protein binds phosphatidylinositol (3, 4) bisphosphate. Journal of dental research. 2011; 90(9):1085–90. doi:10.1177/
0022034511410699PMID:21628641
66. Lai L, Leone TC, Zechner C, Schaeffer PJ, Kelly SM, Flanagan DP, et al. Transcriptional coactivators PGC-1αand PGC-lβcontrol overlapping programs required for perinatal maturation of the heart. Genes & development. 2008; 22(14):1948–61.
67. Wei W, Zeve D, Wang X, Du Y, Tang W, Dechow PC, et al. Osteoclast progenitors reside in the peroxi-some proliferator-activated receptorγ-expressing bone marrow cell population. Mol Cell Biol. 2011; 31 (23):4692–705. doi:10.1128/MCB.05979-11PMID:21947280