J. Min. Met. 39 (1 ‡ 2) B (2003)
369
ELECTROCHEMICAL STUDY OF THE
ELECTRODEPOSITION AND INTERCALATION OF
SODIUM INTO GRAPHITE FROM SODIUM
CHLORIDE AS THE FIRST STEP OF CARBON
NANO-TUBES FORMATION
N. Borisenko, J. Sytchev, G. Kaptay
Department of Physical Chemistry, University of Miskolc, Miskolc-Egyetemváros, Hungary, 3515
E-mail: [email protected]
Abstract
The mechanism of sodium reduction in sodium chloride melt at three different electrodes has been investigated by means of cyclic voltammetry. The definition of so-called ‘thermodynamic’ or ‘material balance’ reversibility has been introduced. It has been shown that the dissolution of sodium in the melt is an important factor in the overall process in the whole range of polariza-tion rates. The adsorppolariza-tion of sodium on glassy carbon and graphite plays an important role in the reduction of sodium at polarization rates below 1 V/s, and it makes the process reversibility higher compared to molybdenum. The intercalation of sodium into the graphite lattice decreases the overall reversibility of the process at low polarization rates.
Keywords:sodium chloride, sodium, deposition, intercalation, reversibility, carbon nano-tubes
1. Introduction
J. Min. Met. 39 (1 ‡ 2) B (2003)
370
of the cathode[2-8]. According to our present understanding, the deposited alkali (Li,
Na) or alkaline earth (Mg, Ca) metal atoms intercalate into the space between the graphite planes causing mechanical stress, and part of the depleting graphite planes appear to be in the form of carbon tubes [9-10]. The typical diameter of those tubes ranges from 2 nanometers to 20 micrometers with a length being much larger than the actual diameter.
According to our preliminary studies, LiCl, NaCl, MgCl2 and CaCl2 seem to be
suitable molten salts for nano-tube synthesis [11]. The reason for that is that by elec-trolyzing these salts (or their mixtures)Li,Na,MgorCaatoms, which are all capable of intercalating in between the graphite planes, can be deposited on a graphite cathode. The goal of this study is to gain some understanding on the mechanism of intercalation and thus nano-tube formation. For this series of experiments we have chosen the simplest possible system, pure sodium chloride. In order to ‘catch’ the electrochemical signature of the intercalation process, the comparative electrochemical analysis of the following three working electrodes was performed by cyclic voltammetry:
i. molybdenum, having practically zero mutual solubility and no compound
formation tendency withNa(or withNaCl), and thus serving as a ‘reference’ inert electrode;
ii. glassy carbon, providing carbon sites for the deposited sodium, but not allowing intercalation ofNainto its bulk – thus, the glassy carbon electrode can be considered as an ‘intermediate reference’ electrode between molybdenum and graphite electrodes;
iii. graphite electrode, being the target material of our investigation.
2. Experimental
Experiments were performed using a three-electrode electrochemical cell. The working electrodes (WE) were a molybdenum wire (0.9 mm diameter, 0.29 cm2of active
surface), glassy carbon rod (1.8 mm in diameter, 0.20 cm2of active surface) and graphite
rod (3 mm in diameter, 0.47 cm2 of active surface) in different experiments. The
reference electrode was a molybdenum wire (0.9 mm in diameter).
A glassy carbon crucible was used as container for the electrolyte and also as the auxiliary electrode. The electrochemical experiments were carried out in a water-cooled nickel super-alloy reactor, placed inside a vertical tube furnace.
J. Min. Met. 39 (1 ‡ 2) B (2003)
371
conducted by a computer-controlled potentiostat VoltaLab PGZ 301.
As sodium is known to dissolve in sodium chloride [12], special care was taken to obtain reproducible and comparable results on all electrodes. Voltammetric curves were started at +0.2 V, conducted to the break potential (it varied from 0 to –2.0 V in different CV runs) and then reversed back to +0.2 V. The range of polarization rates was from 0.01 to 20 V/s. Mathematical treatment of the curves obtained has been performed by means of the VoltaMaster 4 (version 5.1) software package.
3. Results and discussion
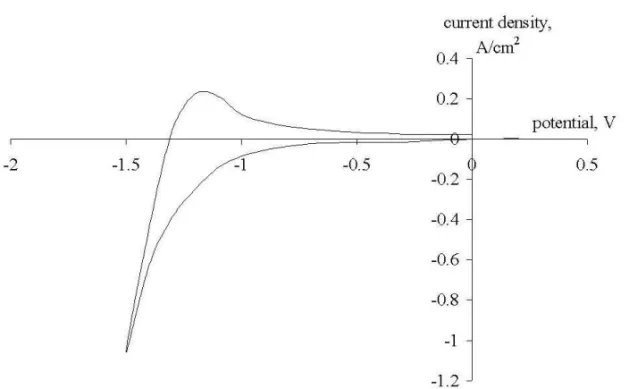
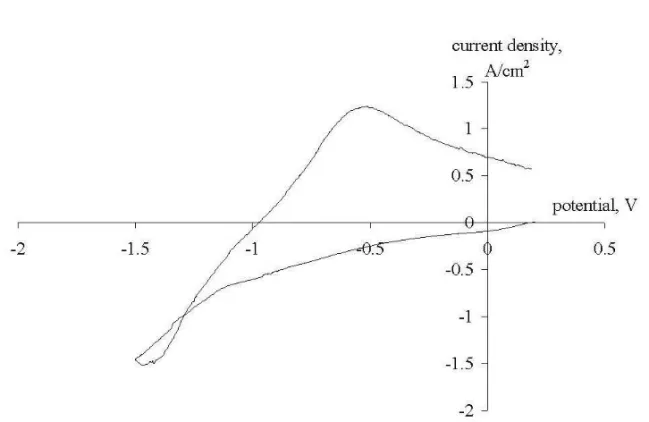
Some characteristic voltammograms recorded at polarization rates of 10 V/s, 1 V/s and 0.1 V/s on the 3 working electrodes at a break potential of –1.5 V are presented in Figures 1-9. For the first look at the voltamograms, it is obvious that the anodic charge transfer is much less than the cathodic charge transfer. In other words, part of the deposited metal is not oxidized back in the same amount in the anodic cycle. This can be due to the escape of metallic sodium from the cathode surface due to its diffusion to the bulk of the electrolyte or to the bulk of the cathode, i.e. due to its intercalation into graphite.
The “loop” in Fig. 3 (the current after potential reversal until approximately –1.3 V has more negative values than before potential reversal) may be due to the formation of a new phase (that is, sodium metal). This assumption is supported by quite a high value of the quantity of electricity (2.934 Coulomb) passed through the system when taking the curve.
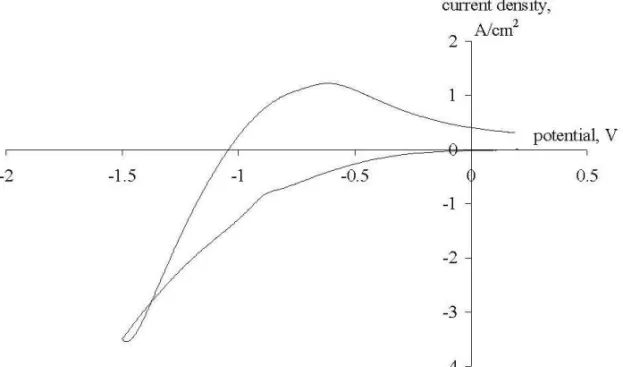
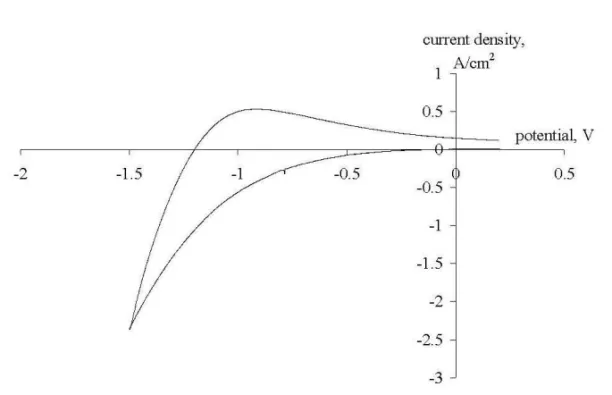
The loops in Figs. 4 and 7 can be explained in the following way. At high polariza-tion rates (1 V/s and higher) the system cannot follow the changes in the working electrode potential, which means that sodium ions cannot momentarily change the movement direction when the polarization is reversed. So for some time after the polar-ization is reversed we have increasing by absolute value flux of sodium ions, which causes the loop to appear. The higher is the polarization rate and the more negative is the break potential, the more pronounced this effect becomes.
The “wavy” appearance of the curve in Fig. 9 may be due to changes in the surface state of the working electrode because this curve was taken in the middle of the experiment and significant amounts of sodium might have adsorbed/desorbed on the electrode surface or, intercalated into the graphite lattice.
The reversibility of Nadeposition/dissolution in a thermodynamic sense is evaluated by us on a 100 % scale by comparing the areas under the anodic and cathodic waves according to the following equation:
(1) Re 50 1 anod ,%
J. Min. Met. 39 (1 ‡ 2) B (2003)
372
where Aanod and Acathod are areas measured under the anodic and cathodic waves of a
voltammogram (the area is negative in the cathodic part of the current and positive in the anodic part of the current).
The physical sense of Eq.(1) is clear from considering the following simple cases: i. when the cathodic and anodic waves are identical, i.e.Acathod=Aanode, i.e. none of
the deposited metal is oxidized back, thenRev= 0, meaning that the process is fully irreversible and that all the deposited metal is ‘lost’;
ii. when the total integral under the anodic wave is zero (i.e. half of it is in the cathodic, while half of it is in the anodic current interval),Rev= 50 %, meaning that half of the deposited metal is ‘lost’;
iii. when the anodic wave fully compensates the cathodic wave, i.e. Acathod= -Aanod,
Rev = 100 %, the process is fully reversible, meaning that all the deposited metal is oxidized back, i.e. there is no metal ‘loss’ at all.
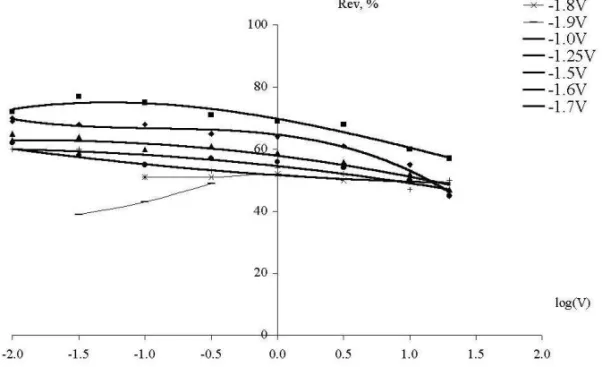
In Fig-s 10-12, the reversibility parameter Rev is shown based on the computer analysis of all the measured curves. From Fig-s 10-12 one can make the following conclusions:
i. for the Mo working electrode theRev – log v curves have an S-shape form. The majority of curves tend to aboutRev= 50 % atv> 1 V/s, and tend to aboutRev= 0 % atv< 0.1 V/s. This behavior can be explained by fast diffusion of depositedNainto bulk
NaCl. When the polarization rate is very slow, almost 100 % ofNais able to escape from the electrode surface, and almost none of the depositedNais oxidized back in the anodic cycle. However, when the rate of polarization is large, only the part of sodium deposited in the cathodic cycle is ‘lost’ by diffusion, and the part of sodium deposited in the beginning of the anodic cycle is actually oxidized back in the end of the anodic cycle.
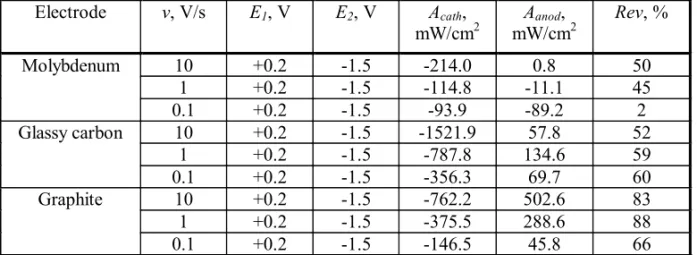
Table 1. Values of reversibility for the deposition/dissolution of Na in Fig-s 1-9, according to Eq.(1)
Electrode v, V/s E1, V E2, V Acath,
mW/cm2 mW/cmAanod,2 Rev, %
10 +0.2 -1.5 -214.0 0.8 50
1 +0.2 -1.5 -114.8 -11.1 45
Molybdenum
0.1 +0.2 -1.5 -93.9 -89.2 2
10 +0.2 -1.5 -1521.9 57.8 52
1 +0.2 -1.5 -787.8 134.6 59
Glassy carbon
0.1 +0.2 -1.5 -356.3 69.7 60
10 +0.2 -1.5 -762.2 502.6 83
1 +0.2 -1.5 -375.5 288.6 88
Graphite
0.1 +0.2 -1.5 -146.5 45.8 66
v - polarization rate,
J. Min. Met. 39 (1 ‡ 2) B (2003)
373
Fig. 1. Cyclic voltammogram recorded on a Mo electrode at a break potential of-1.5 V (Reference electrode - Mo). Polarization rate - 10 V/s, pure NaCl at 850oC.
J. Min. Met. 39 (1 ‡ 2) B (2003)
374
Fig. 3. Cyclic voltammogram recorded on a Mo electrode at a break potential of -1.5 V (Reference electrode - Mo). Polarization rate - 0.1 V/s, pure NaCl
at 850oC.
Fig. 4. Cyclic voltammogram recorded on a GC electrode at a break potential of -1.5 V (Reference electrode - Mo). Polarization rate - 10 V/s, pure NaCl at
J. Min. Met. 39 (1 ‡ 2) B (2003)
375
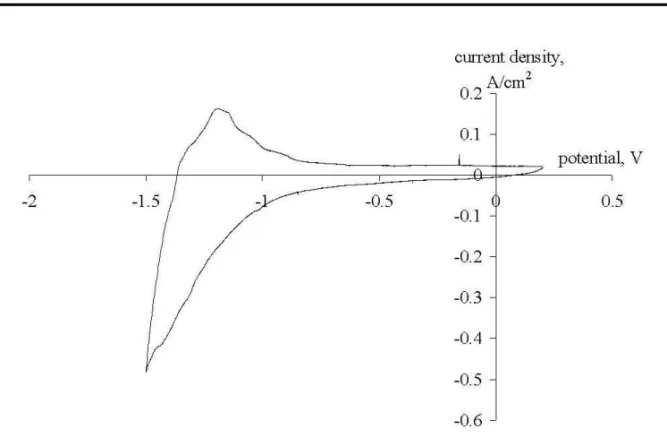
Fig. 5. Cyclic voltammogram recorded on a GC electrode at a break potential of-1.5 V (Reference electrode - Mo). Polarization rate - 1 V/s, pure NaCl at 850oC.
Fig. 6. Cyclic voltammogram recorded on a GC electrode at a break potential of -1.5 V (Reference electrode - Mo). Polarization rate - 0.1 V/s, pure NaCl
J. Min. Met. 39 (1 ‡ 2) B (2003)
376
Fig. 7. Cyclic voltammogram recorded on a graphite electrode at a break potential of -1.5 V (Reference electrode - Mo). Polarization rate - 10 V/s, pure NaCl at 850oC.
Fig. 8. Cyclic voltammogram recorded on a graphite electrode at a break potential of -1.5 V (Reference electrode - Mo). Polarization rate - 1 V/s, pure NaCl
J. Min. Met. 39 (1 ‡ 2) B (2003)
377
Fig. 9. Cyclic voltammogram recorded on a graphite electrode at a break potentialof -1.5 V (Reference electrode - Mo). Polarization rate - 0.1 V/s, pure NaCl at 850oC.
J. Min. Met. 39 (1 ‡ 2) B (2003)
378
ii. for the GC working electrode theRevvalues have approximately the same 50 %, or a bit higher (60 %) value at the largest rate of polarization (20 V/s). However, with decreasing the polarization rate, higher and higher portions of depositedNaare oxidized back, i.e. smaller and smaller amounts ofNaare lost into bulkNaClby diffusion. It is probably due to the adsorption ability ofNato carbon sites. In other words, some kind of a surfaceNaCxcompound is stable. However, the rate of adsorption is lower than the
rate of diffusion into bulkNaCl; that is why the stabilization of depositedNais enhanced at lower rates of polarization. This enhanced stabilization is clearer from Fig.13, being the difference of Fig-s 11 and 10.
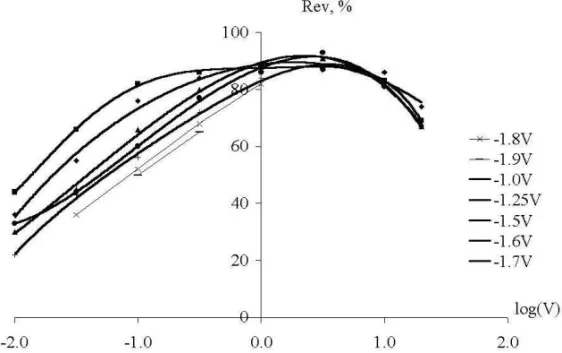
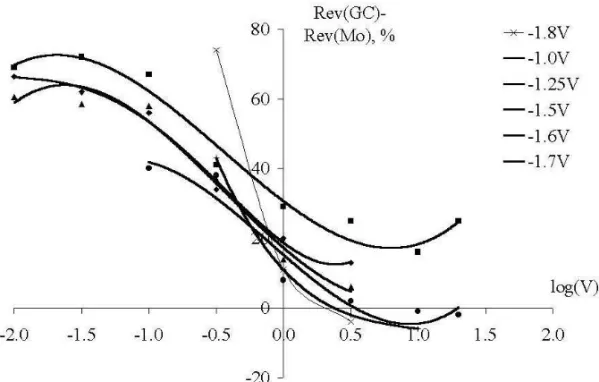
iii. for the graphite working electrode the Rev values have approximately the same (somewhat larger) values at the largest rate of polarization of 20 V/s, compared to the GC working electrode. Then, at about 3 V/s, the Rev parameter has a maximum value. At this point the Rev parameter on the graphite electrode is significantly larger than on the GC electrode. In other words, the graphite surface has a higher stabilizing ability for
Naatoms, compared to the GC surface. It is probably due to the higher roughness, i.e. higher specific surface area of the graphite compared to the GC, ensuring adsorption of the higher amount ofNaatoms. However, with decreasing the polarization rate, the Rev parameter on the graphite electrode sharply decreases towards 0 %, in contrary to what
J. Min. Met. 39 (1 ‡ 2) B (2003)
379
was observed for the glassy carbon electrode. This is obviously due to the diffusion of
Naatoms into the graphite phase, and to the stabilization ofNaatoms inside graphite by the formation of a stable intercalation compound. This feature is better seen from Fig.14, being the difference of Fig-s 12 and 11.
Our statements about adsorption and intercalation are supported by the shape and characteristics of the voltammograms shown. In Fig. 1 through 9 a tendency to broadening of the anodic peak as well as its shifting towards more positive values of potential is observed as we move from the molybdenum to the glassy carbon and then further to the graphite electrode. Usually such behavior takes place when adsorption/compound formation is involved in the reduction process. So the shape and parameters of the voltammetric curves presented may be evidence that adsorption in the case of glassy carbon and adsorption/intercalation in the case of graphite electrode play an important role in the reduction process of sodium.
From the comparison of Fig-s 10-14, one can conclude that the rates of the three competitive processes can be presented in the following order:
i. the fastest is the diffusion ofNaintoNaCl, probably due to the special electron-jump mechanism;
ii. adsorption ofNaon the carbon sites has an intermediate rate;
iii. the slowest is the diffusion of sodium into graphite with the formation of the inter calation compound.
J. Min. Met. 39 (1 ‡ 2) B (2003)
380
Fig. 13. The difference of reversibility parameters Rev between GC and Mo working electrodes (i.e. difference of Fig-s. 11 and 10).
J. Min. Met. 39 (1 ‡ 2) B (2003)
381
4. Conclusions
It has been shown that the process of sodium electroreduction on the three electrodes used is complicated by the dissolution of sodium in the melt in the whole range of polar-ization rates. The adsorption of sodium on glassy carbon and graphite plays an important role in the reduction of sodium at lower polarization rates (below 1 V/s). It makes the process reversibility higher compared to molybdenum. The intercalation of sodium into the graphite lattice decreases the overall reversibility of the process at low polarization rates (below 0.03 V/s).
In the future, we will attempt to develop a quantitative model of the above described processes, and thus to quantify the rates of diffusion and adsorption/desorption ofNa
including the rate of its intercalation into graphite. Also, we are going to perform a similar experimental program for theLiCl,MgCl2andCaCl2systems, and thus evaluate
the difference in intercalating abilities ofLi,Na,MgandCa.
5. Acknowledgements
The authors are grateful to European Office of Aerospace Research and Development (EOARD) for the financial support of this work (grant No.FA8655-02-M4076).
References:
1. S. Iijima, Nature, 354 (1991) 56.
2. W.K. Hsu, J.P. Hare, M. Terrones, H.W. Kroto, D.R.M. Walton, P.J.F. Harris, Nature, 377 (1995) 687.
3. W.K. Hsu, M. Terrones, J.P. Hare, H. Terrones, H.W. Kroto, D.R.M. Walton, Chem. Phys. Lett., 262 (1996) 161.
4. G.Z. Chen, X. Fan, A. Luget, M.S.P. Shaffer, D.J. Fray, A.H. Windle, J. Electroanal. Chem., 446 (1998) 1.
5. G.Z. Chen, I. Kinloch, M.S.P. Shaffer, D.J. Fray, A.H. Windle, in: Advances in Molten Salts – From Structural Aspects to Waste Processing, Edited by M. Gaune-Escard, Begell House, Inc., 1999, 97-107.
6. D.J. Fray, in: Advances in Molten Salts – From Structural Aspects to Waste Processing, Edited by M. Gaune-Escard, Begell House, Inc., 1999, 196-207. 7. G.Z. Chen, D.J. Fray, see this volume.
8. M.S. Yaghmaee, Zs. Demeter, see this volume.
9. G. Kaptay, I. Sytchev, M.S. Yaghmaee, A. Kovacs, E. Cserta, M. Ark, Proc. 6th
International Symposium on Molten Salt Chemistry and Technology, Shanghai, China, 2001, p. 168.
10. Q. Xu, C. Schwandt, G.Z. Chen, D.J. Fray, J. Electroanal. Chem., 530 (2002) 16. 11. G. Kaptay, J. Sytchev, J. Miklósi, P. Nagy, P. Póczik, K. Papp, E. Kálmán:
Progress in Molten Salt Chemistry, Elsevier, vol. 1, 2000, p. 257.