www.nat-hazards-earth-syst-sci.net/14/165/2014/ doi:10.5194/nhess-14-165-2014
© Author(s) 2014. CC Attribution 3.0 License.
Natural Hazards
and Earth System
Sciences
Lightning flash multiplicity in eastern Mediterranean
thunderstorms
Y. Yair1, S. Shalev2, Z. Erlich3, A. Agrachov4, E. Katz5, H. Saaroni2, C. Price4, and B. Ziv1
1Department of Life and Natural Sciences, The Open University of Israel, 43537 Ra’anana, Israel
2Department of Geography and the Human Environment, Tel-Aviv University, Ramat Aviv, 69978 Tel-Aviv, Israel 3Department of Math and Computer Science, The Open University of Israel, 43537 Ra’anana, Israel
4Department of Geophysical, Atmospheric and Planetary Sciences, Tel-Aviv University, Ramat Aviv, 69978 Tel-Aviv, Israel 5Israel Electric Corporation, Research Laboratories, Haifa, Israel
Correspondence to:Y. Yair ([email protected], [email protected])
Received: 2 June 2013 – Published in Nat. Hazards Earth Syst. Sci. Discuss.: 26 July 2013 Revised: 30 June 2013 – Accepted: 2 December 2013 – Published: 3 February 2014
Abstract.Cloud-to-ground lightning flashes usually consist of one or several strokes coming in very short temporal succession and close spatial proximity. A commonly used method for converting stroke data into flashes is using the National Lightning Detection Network (NLDN) thresholds of maximum temporal separation of 0.5 s and maximum lat-eral distance of 10 km radius between successive strokes. In the present study, we tested a location-based algorithm with several spatial and temporal ranges, and analyzed stroke data obtained by the Israel Lightning Location System (ILLS) during one year (1.8.2009–31.7.2010). We computed the multiplicity, the percentage of single stroke flashes and the geographical distribution of average multiplicity values for thunderstorms in the Eastern Mediterranean region. Results show that for the NLDN thresholds, the percentage of single stroke flashes in Israel was 37 % and the average multiplic-ity was 1.7. We reanalyzed the data with a spatial range that equals twice the ILLS location error and shorter times. For the new thresholds of maximum distance of 2.5 km and max-imum allowed temporal separation of 0.2 s we find that the mean multiplicity of negative CGs is lowered to 1.4 and find a percentage of 58 % of single stroke flashes. A unique se-vere storm from 30 October 2009 is analyzed and compared with the annual average of 2009/2010, showing that large de-viations from the mean values can occur in specific events.
1 Introduction
166 Y. Yair et al.: Lightning flash multiplicity in eastern Mediterranean thunderstorms
ground location equivalent to a stroke), they concluded that 85 % of CG flashes are composed of a single stroke. The mul-tiplicity was found to range between 1 and 10 with an average value of 1.2 fixes per flash.
Cummins et al. (1998a) mention that the average multi-plicity was generally thought to be between 3 and 4, as found by Thomson et al. (1984). The multiplicity values determined by the NLDN according to the two different methods (the pre- and post-upgrade algorithms) for two years after the upgrade were different. The result obtained using the new method was lower (1.9) than the result obtained for the same database by the previous method (2.7). Orville et al. (2002) analyzed three years of data from the NLDN and found that in most regions the mean negative multiplicity was lower than 2.6. In general, multiplicity increases with higher nega-tive peak currents (first stroke peak current). Analyzing 10 yr of lightning data from the NLDN (1989–1998), Orville and Huffins (2001) found that the negative multiplicity is slightly above 2.5 for the period 1989–1994, subsequently decreas-ing to slightly over 2.0 durdecreas-ing the period 1995–1998. They attribute the results to the multiplicity algorithm change in 1994. Rakov and Huffins (2003) summarize different stud-ies from Florida, New Mexico, Sri Lanka and Sweden, all of which found that less than 20 % are single-stroke flashes. The mean negative multiplicity reported by Orville et al. (2010) for the years 2001–2009 ranges between 2.2–2.6. The multi-plicity values are affected by improved detection ability as a result of some upgrades to the NLDN, which consist of 200 sensors (in 2010). For example, a higher negative multiplic-ity was reported for 2002 compared to 2001 and a 30 % in-crease in positive multiplicity from 2001 to 2004, following the 2002–2003 upgrade. The mean multiplicity for the Aus-trian Lightning Detection and Information System (ALDIS) was 2.21 and for the FM-Systemm=2.29 (Schulz and Di-endorfer, 2006). In Brazil, the average multiplicity of nega-tive CG flashes reported by BrasilDat was 1.9, but this may have been an underestimation due to the low stroke detec-tion efficiency of the network at that period of time (Pinto et al., 1999). Matsui and Hara (2011) analyzed lightning data in Japan and conducted a comparison of the NLDN criteria with those used by the JLDN. The mean negative multiplicity was found to be 2.13 and the positive multiplicity was 1.18. They found that the NLDN criteria tend to slightly overestimate the multiplicity values (2.23 and 1.19, respectively), because the NLDN assigns strokes into flashes in larger areas com-pared with the JLDN. The distribution of multiplicity values for the two algorithms is only marginally different (Figs. 3 and 4).
In Israel, the percentage of negative single-stroke flashes reported by ILLS for the period 2000 to 2007 was 38.5 % (Katz and Kalman, 2009). These results were based on the updated NLDN algorithm, which used thresholds of 0.5 s and 10 km. The mean value of the stroke-to-flash ratio was found to be 2.7 (this value was obtained by using a different av-eraging method that excludes flashes with only one stroke).
In order to convert this value to the standard multiplicity, we usem=(1–0.385)×2.7+0.385×1=2.05, which properly reflects the stroke-to-flash ratio for the entire data set.
If multiple strokes of a single cloud-to-ground (CG) flash indeed hit the same physical location in terms of geograph-ical coordinates, it would be loggeograph-ical for the algorithm for grouping strokes into a flash to consider strokes to be part of the same flash only if they successively hit at a distance equal to twice the location accuracy of that location system, within the predetermined time range. When keeping the temporal clustering criteria the same, two strokes within a distance less than twice the location uncertainty are then grouped in a single flash. The typical location accuracy achieved by the NLDN following the 1994 upgrade (as a result of the 106 sensors located over the continental United States in 1996) was 500 m (Cummins et al., 1998a). If multiple strokes in-deed hit the same location, and if the accuracy is 500 m, then the maximum spatial range for grouping two strokes into one flash should be 1 km. However, the NLDN, as part of the 1994 upgrade, adopted a new method for grouping individual strokes into one flash, using a spatial range of 10 km. Rakov and Huffins (2003) explained that in some optical studies of flash multiplicity, the occurrence of a new path between the cloud base and the ground was treated as the beginning of a new flash, regardless of the time elapsing from the preceding stroke and the likelihood of a common channel section inside the cloud. According to that work, this approach separates a single multi-grounded lightning discharge inappropriately into two or more flashes with one ground termination each.
they found (Saba et al., 2010) an inter-stroke time interval of 94 ms for+CG, which is about 1.5 times greater than the average inter-stroke interval in negative CG flashes (60 ms). Using a time limit of 500 ms, as used by the NLDN, pro-vides a higher reliability in the resulting flash data but may have erroneously lowered the total number of flashes. Bal-larotti et al. (2012) conducted an accurate stroke-count study using high-speed cameras (at 1000–8000 frames per second). They suggested using the new term NSTFto describe the
ra-tio between the average number of strokes per flash and the average number of ground contacts per flash. Based on their data of 833 negative CGs (out of 4041 strokes), the multi-plicity was 4.6 and the number of ground points per flash 1.7, resulting in NSTF=4.6/1.7=2.7. The percentage of single
stroke flashes was found to be 17 %.
The described differences in temporal and spatial thresh-olds between consecutive strokes used by various lightning location systems and researchers impair the establishment of common databases and accurate flash density maps, and ne-cessitate the use of realistic values. The present study aims to evaluate how the multiplicity and the stroke-to-flash ratio change when alternative parameters are used, and to suggest new thresholds for future studies of flash multiplicity.
2 Data
Lightning in the Eastern Mediterranean and Israel occurs pri-marily in winter, and concentrated in the months November– January. Summer months are completely devoid of thunder-storms and any electrical activity. In winter, lightning is most often found in cold fronts of Cyprus lows that are formed over the warm sea and move eastward toward Israel (Ziv et al., 2009). The clouds that generate lightning in these synop-tic conditions are compact cumulonimbus clouds with ver-tical dimensions of 5–7 km often embedded within a larger matrix of shallower convective precipitation regions. They exhibit intermittent electrical activity with low flash rates and resemble lightning activity over the Sea of Japan (Kitagawa and Michimoto, 1994), which is remarkably different from summer thunderstorms in the US and Europe and the tropi-cal activity in Brazil. Only in a few rare storms (1–2 per year) that occur when Red Sea trough conditions exist (in the fall months October–November) does lightning activity resemble that which is found in the tropics.
In the present study we used stroke data for the period 1.8.2009–31.7.2010 (later referred to as year 2009/2010) ob-tained by the Israel Lightning Location System (ILLS) op-erated by the Israel Electric Corporation (IEC). The ILLS during that period consisted of 8 sensors: 5 Lightning Posi-tion and Tracking System (LPATS), 2 IMProved Accuracy from Combined Technology (IMPACT) and one lightning sensor of type LS7000. Over the land area of Israel, where all 8 sensors are located, the stroke detection efficiency was estimated to be>80 % (Y. Katz, personal communication,
64
19 9 4
2 0.94 0.74 0.32 0.18 0.11 0.06 0.05 0.03 0.00 0.01 0.01 0
10 20 30 40 50 60 70
1 2 3 4 5 6 7 8 9 10 11 12 13 14 15 16
P
e
rcen
t of
f
la
sh
e
s
Strokes per flash
N=10,754 Mean=1.73
0 5 10 15 20 25
0 1 2 3 4 5 6 7 8 9 10
Fig. 1.The multiplicity distribution in thunderstorms in the study area.
2011), and it decreases with distance from the network cen-ter (Fig. 1). The flash detection efficiency is assumed to be more than 90 % above Israel’s central areas, though the ac-curate value is unknown. The median semi-major axis length of the 50 % statistical confidence area for locating the ground strike point in the abovementioned region is 1.3 km. The to-tal area investigated in the present research covers Israel and its neighboring region and is∼500 000 km2, of which 40 % are over the Mediterranean Sea. The spatio–temporal distri-bution of lightning over Israel and the neighboring area and a detailed description of the research methodology are de-scribed in Shalev et al. (2011).
3 Methodology and results
Based on the fact that the average time interval between suc-cessive return strokes in any flash is usually several tens of milliseconds, we try to assess if a value of 0.2 s may better represent the multiplicity compared with the nominal 0.5 s. Similarly, as most video-based studies of lightning strike lo-cations show a mean range of less than 2.5 km between two ground terminations of the same flash, a spatial range of 10 km may be too large and can potentially misclassify inde-pendent flashes as subsequent strokes of a single flash. Such broad clustering criteria may eventually lead to reporting of lower values of flash density than occur in reality.
In order to evaluate the sensitivity of the multiplicity val-ues to the chosen thresholds, we used different criteria from those commonly used by operational lightning detection networks. To compute the multiplicity of cloud-to-ground flashes in winter thunderstorms in Israel, we tested a revised location-based algorithm in order to group different succes-sive strokes into a single flash: (a) Inter-stroke time inter-val<0.2 s, (b) Location distance within 2.5 km and (c) No restriction on the maximum flash duration. The distance in kilometers between strokes was computed from the longi-tude and latilongi-tude reported by the ILLS, converted to radians using the spherical law of cosines formula, based on a spher-ical earth assumption (ignoring the ellipsoidal effect).
d=acos(sin(lat1)×sin(lat2)+cos(lat1) (1)
168 Y. Yair et al.: Lightning flash multiplicity in eastern Mediterranean thunderstorms
Table 1.Average multiplicity, maximum multiplicity and percentage of single-stroke flashes based on data from different lightning detection networks. Reproduced from Rakov and Huffins (2003)
Reference Geographical region Observation # negative Avg Max % of
period flashes mul. mul. single-stroke
flashes
Diendorfer et al. (1998) Austria 1996 46 420 2.7 15 40
Rakov and Huffins (2003) Florida 1995–2001 18 997 390 2.4 15 44
New Mexico 1995–2001 10 789 675 2.1 15 51
Contiguous US 1995–2001 165 074 265 2.2 15 49
This study E. Med (0.5 s, 10 km) 2009–2010 231 347 1.6 17 42
(0.5 s, 5 km) 1.4 17 52
(0.5 s, 2.5 km) 1.3 16 67
(0.2 s, 2.5 km) 1.2 16 71
Israel (0.5 s, 10 km) 2009–2010 18 611 1.7 17 37
(0.5 s, 5 km) 1.6 16 42
(0.5 s, 2.5 km) 1.5 16 52
(0.2 s, 2.5 km) 1.4 16 58
whered is the computed distance between two strokes, lat1, long1 and lat2, long2 are the location values of the two strokes being examined and R is the Earth’s radius. A Vi-sual Basic application was developed that can also be used for further studies.
3.1 Lightning parameters with NLDN criteria
Figure 1 shows the multiplicity distribution ofNt=10,754
negative CG strokes above Israel when using the NLDN parameters for grouping strokes into flashes (10 km, 0.5 s). The mean negative multiplicity was 1.73, with a long tail of higher values, with a maximum of 16 strokes in a single flash. The highest probability (64 %) is for single-stroke flashes, with 19 % having two strokes, 9 % having 3 strokes and much lower percentages with higher multiplicity values. The distri-bution is markedly different than reported in accurate stroke count studies in Brazil (Saba et al., 2006) and Arizona (Sara-iava et al., 2010), where the average multiplicity was 3.9. Fleenor et al. (2009) studied storms in the US mid-planes and reported a video multiplicity average of 2.83 with median 2 for 103 strokes. The percentage of single-stroke flashes re-ported by the NLDN is a factor of 2–3 higher than from the accurate-stroke-count studies in Florida and is a factor of 3– 4 higher in New Mexico. The ILLS results for 2009/10 are more similar to the distribution found by the NLDN for these same regions.
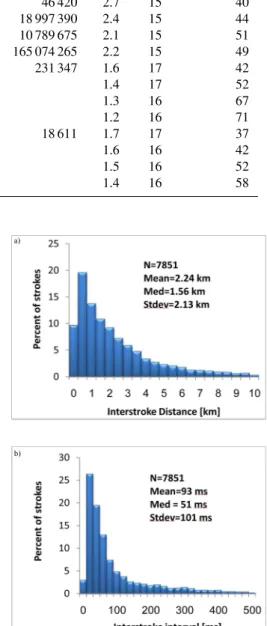
The distributions in Fig. 2a and b reflect the inter-stroke characteristic found for the study period. HereNsis the
num-ber of subsequent strokes. The mean inter-stroke distance between consecutive strokes is 2.24 km and the mean inter-stroke interval is 93 ms. These results are in good agreement with the results of Stall et al. (2009), who found a mean inter-stroke distance of 2.6 km and a mean inter-inter-stroke interval of 98 ms for strokes that used a preexisting channel and 84 ms
Fig. 2. (a)Distribution of inter-stroke distances in km.(b) Distribu-tion of the inter-stroke time interval in ms.
Y. Yair et al.: Lightning flash multiplicity in eastern Mediterranean thunderstorms 169
1.3 1.4 1.5 1.6 1.7 1.8 1.9 2
1 10 100 1000
A
v
e
.
Neg
.
M
u
lti
p
li
ci
ty
Spatial distance [km] 0.2 ms
0.5 ms
1 s
2 s
NLDN ranges
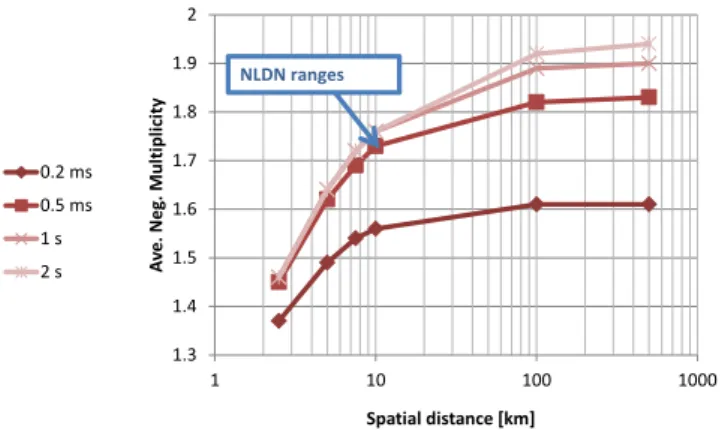
Fig. 3.Average multiplicity of negative cloud-to-ground flashes as a function of maximum stroke separation distance for a range of inter-stroke time intervals.
3.2 Mean multiplicity using different grouping criteria
The average multiplicity was recalculated for time differ-ences of 0.2 and 0.5 s and for distances of 2.5, 5, and 10 km between successive strokes (Fig. 3). Table 1 is reproduced from Rakov and Huffins (2006) with addition of our results for the annual lightning data of 2009/10 for the full ILLS coverage area (later referred to as “entire region”) and specif-ically for the land area of Israel, where a better location ac-curacy is stated. For the entire region, the average negative multiplicity is 1.6 based on the NLDN thresholds (10 km and 0.5 s). When excluding single-stroke flashes the multiplicity was found to bem=2.9. This calculation was performed in order to enable comparison with the value of 2.7 com-puted by Katz and Kalman (2009), who discounted single-stroke flashes from their statistics. We find that the percent-age of single-stroke flashes changes dramatically from 42– 67 % when using different range thresholds, and from 42– 71 % based on both different range and time thresholds. We also computed the values based on the data gathered from the entire region by the ILLS, which obviously includes re-gions where the detection efficiency as well as the location accuracy are lower. These regions are expected to experi-ence lower values of multiplicity, similar to the findings of Orville et al. (2010), who presented multiplicity maps for North America. For the land area of Israel, where detection efficiency is assumed to be >90 % and the median loca-tion accuracy is better than 1.3 km (Katz and Kalman, 2009), the mean negative multiplicity was found to be 1.73 for the NLDN thresholds, and 1.2 when using stricter ranges of 0.2 s and 2.5 km. Both values are lower than the values obtained for the entire region.
The geographical distributions of the mean negative mul-tiplicities for two different sets of thresholds are shown in Fig. 4. We show a multiplicity distribution map for the NLDN thresholds of 10 km, 0.5 s (Fig. 4a) and for 2.5 km and 0.2 s (Fig. 4b). The cell size for grouping lightning densities
(b) (a)
Fig. 4. (a)The negative ground flash multiplicity for thresholds
of 0.5 s and 10 km.(b)The negative ground flash multiplicity for
thresholds of 0.2 s and 2.5 km.
170 Y. Yair et al.: Lightning flash multiplicity in eastern Mediterranean thunderstorms
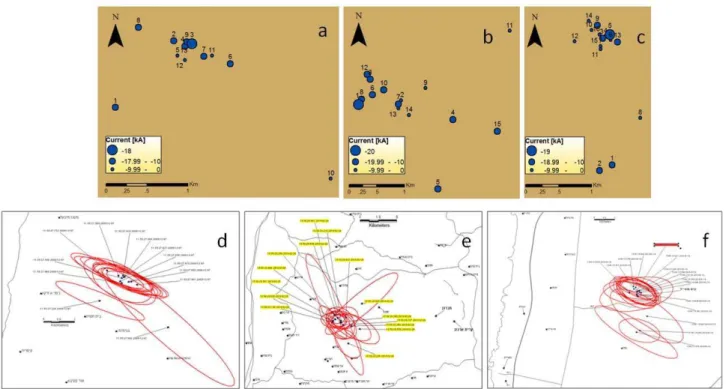
Fig. 5.Spatial distribution of successive strokes in 3 different lightning events with high multiplicity values, with the respective error ellipses.
(a)Event E3, 7.12.2009, 11:55 GMT,m=13.(b)Event E2, 26.2.2010, 15:50 GMT,m=15.(c)Event E1, 18.1.2010, 13:41 GMT,m=16.
(d),(e),(f)the respective error ellipses for the three events.
3.3 Number of ground contact points
Research shows that the number of contact points changes with the number of strokes, and increasing the stroke or-der leads to an increasing likelihood of more ground contact points. Valine and Krider (2002) imaged 386 CGs and found 558 different strike points, leading to an average number of 1.45 ground terminations per CG flash (their Fig. 7). Fleenor et al. (2009) reported a mean value of 1.56 contact points per flash, based on video studies of 103 flashes. Saraiava et al. (2010, Fig. 12) gave 1.7 contact points per flash based on 344 flashes. Analysis of flashes with the highest number of strokes in our data shows that although there is a large spread in inter-stroke distance (as evident in Fig. 2a), high multiplicity strokes have contact points that are distributed with an inter-stroke distance usually less than 2 km.
Three such events (named E1, E2 and E3) are shown in Fig. 5a–c. Event E1 from 18 January 2010 at 13:41 GMT had the highest number of strokes: 16. Event E2 from 26 Febru-ary 2010 at 15:50 GMT includes 15 strokes and event E3 from 7 December 2009 at 11:55 GMT includes 13 strokes. The numbers in Fig. 5 indicate the stroke order in the flash and the circle size is proportional to the stroke peak current as measured by the ILLS. Obviously the first return stroke does not always exhibit the highest peak current, similar to results reported by Fleenor et al. (2009, Fig. 5). It may be possible that strokes 1, 2 and 8 of event E1 and strokes 1
and 10 of event E3 are part of a separate flash. These values fall within 2.5 km, indicating a very tight grouping of con-secutive strokes in high multiplicity flashes, as shown by the respective error ellipses (Fig. 5e, f). The tight clustering of most of the strokes in all three events suggests that the flashes had more than one ground termination point, but it was still within less than 2.5 km from the main strike point.
3.4 The storm of 30 October 2009
(a)
(b)
1811 1950 2770
1509 1417 1180 1067
857
379
634 800 575 462 500 413 554 1551
681 673 913
0 0
500 1000 1500 2000 2500 3000
Stroke Temporal Distribution
Fig. 6. (a)The distribution of strokes for the storm of 30.10.2009.
(b)The temporal distribution of strokes along the day.
Figure 6b shows the temporal distribution of strokes along the day. When applying the NLDN criteria for grouping the strokes into flashes, the results for negative CGs show a multiplicity of 2.06 when considering all flashes. For these thresholds the maximum multiplicity ism=17. When us-ing tighter thresholds (0.2 s and 1 km) the multiplicity for all flashes drops to 1.15 and the maximum ism=11. Intermedi-ate values of 0.2 s and 10 km show that for all strokes the av-erage multiplicity is 1.83. These changes reflect the sensitiv-ity of the computed multiplicsensitiv-ity values to the chosen thresh-olds and the fact that occasional events may deviate signif-icantly from the annual average values. Figure 7 shows the distribution of the peak current (Ip) for single-stroke flashes and for higher values of multiplicity. Clearly, single-stroke flashes show a wider distribution of peak currents, while mul-tiple strokes show narrower distributions. Interestingly, the last strokes of flashes with m >2 converge to a common value of 14 kA. Similar distribution of peak current is found by Fleenor et al. (2009), with a mean value of 23.3 kA for the first stroke.
4 Conclusions
The mean negative multiplicity found for the stroke data over Israel recorded in the year 2009/10 using the NLDN
0 200 400 600 800 1000 1200
-100
-94 -88 -82 -76 -70 -64 -58 -52 46 - -40 -34 -28 -22 -16 -10 -4 2 8 14 20 26 More
N
u
m
b
e
r
o
f str
o
ke
s
Peak Current (KAmp) Stroke peak current (kA)
single 1st 2nd 3rd 4th 5th 6th 7th 8th 9th 10th more
Fig. 7. The distribution of peak current [kA] for single- and multiple-stroke flashes in the 30 October storm. “Single” refers to flashes with one stroke, and the different lines refer to the distribu-tion of peak current as a funcdistribu-tion of stroke order in events when
m≥2.
algorithm, including single-stroke flashes, is 1.73. This value is lower than what is reported in other studies for summer storms, and lower even when compared with Japan (2.13), which has similar lightning activity characteristics as Israel (Yair et al., 2009). The other multiplicity value for Israel that can be used for comparison is the one computed by the IEC for the years 2000–2007, which was 2.7 (Katz and Kalman, 2009). That value computed takes into account only flashes with two or more strokes (m≥2), and is corrected to 2.05.
In this study, we computed the mean multiplicity and per-centage of single-stroke flashes for negative cloud-to-ground flashes using an algorithm based on the spatial accuracy of the ILLS. The algorithm examined all strokes within a 2.5 km radius (twice the ILLS accuracy) from the location of the first stroke and difference temporal duration of 0.2 s. The multi-plicity in Israel, where flash detection efficiency is>90 % and location accuracy is better than 1.3 km, was found to be 1.4, lower than the NLDN-based value of 1.7. Both val-ues are lower than reported in most lightning climatology studies around the world (and see Table 1). This may be explained by the dominance of winter thunderstorms in the Eastern Mediterranean, which have different characteristics than summer or tropical convective storms that are most stud-ied globally (Cummins et al., 1998b; Schulz et al., 2005).
172 Y. Yair et al.: Lightning flash multiplicity in eastern Mediterranean thunderstorms
of a single flash. Most video-based studies show a separation range of less than 2.5 km between two ground termination points of the same flash. We therefore conclude that a spa-tial range of twice the stated average accuracy of the light-ning location system may be sufficient, especially for winter-type storms that exhibit small dimensions and tighter spatial distribution of ground termination points. This may lead to some multi-grounded flashes to be misclassified as separate flashes. Indeed, Valine and Krider (2002) showed that 35 % of video-recorded cloud-to-ground flashes strike in two or more places separated by tens of meters or more. Such sepa-ration falls within most lightning location systems’ accuracy and so our suggested threshold seems to be reasonable.
The estimated multiplicity of flashes is affected not only by the detection efficiency of the system, but also by the algo-rithm that groups strokes into flashes. Hence, it is somewhat difficult to compare published lightning climatologies – such as flash densities – from ground-based networks and satellite data or to conclude accurately that lightning characteristics vary between different regions and climates without a com-mon, standard, agreed upon benchmark. It is clear that stroke data together with the thresholds used for computing flash data will become an essential part of future lightning clima-tology studies. This would lead to a better basis for com-parison between the different regional and global data sets. Moreover, the multiplicity of flashes, together with the algo-rithm used for computing flashes out of the stroke data, are vital for any lightning climatology analysis aiming to moni-tor changes in global lightning patterns in view of future cli-mate changes (Price, 2009).
Acknowledgements. This study was supported by the Israeli Science Foundation (ISF, grant No. 108/10) and by the Open University Research Authority. The authors thank the Israeli Electrical Company (IEC) for providing the lightning data.
Edited by: G. Panegrossi
Reviewed by: two anonymous referees
References
Altaratz, O., Levin Z., and Yair, Y.: Winter thunderstorms in Is-rael – a study with lightning location systems and weather radar, Month. Weath. Rev, 129, 1259–1266, 2001.
Ballarotti, M. G., Medeiros, C., Saba, M. M. F., Schulz, W., and Pinto Jr., O.: Frequency distributions of some pa-rameters of negative downward lightning flashes based on accurate-stroke-count studies, J. Geophys. Res., 117, D06112, doi:10.1029/2011JD017135, 2012.
Cummins, K. L., Murphy, M. J., Bardo, E. A., Hiscox, W. L., Pyle, R. B., and Pifer, A. E.: A combined TOA/MDF technology up-grade of the U.S. National Lighting Detection Network, J. Geo-phys. Res., 103, 9035–9044, 1998a.
Cummins, K. L., Krider, E. P., and Malone, M. D.: The US Na-tional Lightning Detection Network and applications of
cloud-to-ground lightning data by Electric Power Utilities, IEEE trans-actions on electromagnetic compatibility, 40, 465–480, 1998b. Defer, E., Lagouvardos, K., and Kotroni, V.: Lightning activity
in the eastern Mediterranean region, J. Geophys. Res., 110, D24210, doi:10.1029/2004JD005710, 2005.
Fleenor, S. A., Biagi, C. J., Cummins, K. L., Krider, E. P., and Shao, X.-M.: Characteristics of cloud-to-ground lightning in warm-season thunderstorms in the Central Great Plains, Atmos. Res., 91, 333–352, 2009.
Katz, E., and Kalman, G.: The impact of environmental and geo-graphical conditions on lightning parameters derived from light-ning location system in Israel, in: X International Symposium on Lightning Protection, 9–13 November 2009, Inst. de Electrotéc. e Energia, Univ. de São Paulo, Curitiba, Brazil, 249–254, 2009. Kitagawa, N. and Michimoto, K.: Meteorological and electrical
aspects of winter thunderclouds, J. Geophys. Res., 99, 10713– 10721, 1994.
Matsui, M. and Hara, Y.: The number of strokes per flash measured by JLDN. In: Proceeding of 7th Asia-Pacific conference on light-ning, November 4-7, 2011, Chengdu, China, 248–253, 2011. Orville, R. E. and Huffines, G. R.: Cloud-to-Ground lightning in
the United States: NLDN results in the first decade, 1989–1998, Mon. Weather Rev., 129, 1179–1193, 2001.
Orville, R. E., Huffines, G. R., Burrows, W. R., Holler, R. L., and Cummins, K. L.: The North American Lightning Detection Net-work (NALDN) – First Results: 1998–2000, Mon. Weather Rev., 130, 2098–2109, 2002.
Orville, R. E., Huffins, G. R., Burrows, W. R., and Cummins, K. L.: The North American Lightning Detection Network (NALDN) – Analysis of Flash Data: 2001–2009, Mon. Weather Rev., 139, 1305–1322, 2010.
Pinto, I. R. C. A., Pinto Jr., O., Rocha, R. M. L., Diniz, J. H., Car-valho, A. M., and Filho, A. C.: Cloud-to-ground lightning in southeastern Brazil in 1993 2. Time variations and flash char-acteristics, J. Geophys. Res., 104, 31381–31387, 1999.
Price, C.: Will a drier climate result in more lightning?, Atmos. Res., 91, 479–484, 2009.
Rakov, V. A. and Huffines, G. R.: Return stroke multiplicity of neg-ative cloud-to-ground lightning flashes, J. Appl. Meteorol., 42, 1455–1462, 2003.
Saba, M. M. F., Ballarotti, M. G., and Pinto Jr., O.:
Neg-ative cloud-to-ground lightning properties from
high-speed video observations, J. Geophys. Res., 111, D03101, doi:10.1029/2005JD006415, 2006.
Saba, M. M. F., Schulz, W., Warner, T. A., Campos, L. Z. S., Schu-mann, C., Krider, E. P., Cummins, K. L., and Orville, R. E.: High speed video observations of positive lightning flashes to ground, J. Geophys. Res., 115, D24201, doi:10.1029/2010JD014330, 2010.
Saraiva, A. C. V., Saba, M. M. F., Pinto Jr., O., Cummins, K. L., Krider, E. P., and Campos, L. Z. S.: A compara-tive study of negacompara-tive cloud-to-ground lightning characteristics in São Paulo (Brazil) and Arizona (United States) based on high-speed video observations, J. Geophys. Res., 115, D11102, doi:10.1029/2009JD012604, 2010.
Schulz, W., Cummins, K., Diendorfer, G., and Doringer, M.: Cloud-to-ground lightning in Austria: A 10-year study using data from a lightning location system, J. Geophys. Res., 110, D09101, doi:10.1029/2004JD005332, 2005.
Shalev, S., Saaroni, H., Izsak, T., Yair, Y., and Ziv, B.: The spatio-temporal distribution of lightning over Israel and the neighboring area and its relation to regional synoptic systems, Nat. Hazards Earth Syst. Sci., 11, 2125–2135, 2011.
Stall, C. A., Cummins, K. L., Krider, E. P., and Cramer, J. A.: De-tecting Multiple Ground Contacts in Cloud-to-Ground Lightning Flashes, J. Atmos. Oceanic Technol., 26, 2392–2402, 2009. Thomson, E. M., Galib, M. A., Uman, M. A., Beasley, W. H., and
Master, M. J.: Some Features of Stroke Occurrence in Florida Lightning Flashes, J. Geophys. Res., 89, 4910–4916, 1984.
Thottappillil, R., Rakov, V. A., Uman, M. A., Beasley, W. H., Mas-ter, M. J., and Shelukhin, D. V.: Lightning subsequent stroke electric field peak greater than the first stroke peak and multiple ground terminations, J. Geophys. Res., 97, 77503–77509, 1992. Valine, W. C. and Krider, E. P.: Statistics and charachteristics
of cloud-to-ground lightning with multi[ple ground contacts, J. Geophys. Res., 107, 4441, doi:10.1029/2001JD001360, 2002. Yair, Y., Price, C., Ganot, M., Greenberg, E., Yaniv, R., Ziv, B.,
Sherez, Y., Devir, A., Bór, J., and Sátori, G.: Optical observa-tions of transient luminous events associated with winter thun-derstorms near the coast of Israel, Atmos. Res., 91, 529–537, 2009.