Assessment of Model Based (Input)
Impedance, Pulse Wave Velocity, and Wave
Reflection in the Asklepios Cohort
Bernhard Hametner1☯, Stephanie Parragh1,2, Christopher Mayer1, Thomas Weber3,
Luc Van Bortel4, Marc De Buyzere4, Patrick Segers5, Ernst Rietzschel6, Siegfried Wassertheurer1,2☯
*
1Health & Environment Department, AIT Austrian Institute of Technology, Vienna, Austria,2Department of Analysis & Scientific Computing, Vienna University of Technology, Vienna, Austria,3Cardiology
Department, Klinikum Wels-Grieskirchen, Wels, Austria,4Department of Pharmacology, Ghent University, Ghent, Belgium,5Institute of Biomedical Technology, iMinds Medical IT, Ghent University, Ghent, Belgium, 6Department of Internal Medicine, Ghent University, Ghent, Belgium
☯These authors contributed equally to this work. *[email protected]
Abstract
Objectives
Arterial stiffness and wave reflection parameters assessed from both invasive and non-invasive pressure and flow readings are used as surrogates for ventricular and vascular load. They have been reported to predict adverse cardiovascular events, but clinical assessment is laborious and may limit widespread use. This study aims to investigate mea-sures of arterial stiffness and central hemodynamics provided by arterial tonometry alone and in combination with aortic root flows derived by echocardiography against surrogates derived by a mathematical pressure and flow model in a healthy middle-aged cohort.
Methods
Measurements of carotid artery tonometry and echocardiography were performed on 2226 ASKLEPIOS study participants and parameters of systemic hemodynamics, arterial stiff-ness and wave reflection based on pressure and flow were measured. In a second step, the analysis was repeated but echocardiography derived flows were substituted by flows pro-vided by a novel mathematical model. This was followed by a quantitative method comparison.
Results
All investigated parameters showed a significant association between the methods. Overall agreement was acceptable for all parameters (mean differences: -0.0102 (0.033 SD) mmHg*s/ml for characteristic impedance, 0.36 (4.21 SD) mmHg for forward pressure ampli-tude, 2.26 (3.51 SD) mmHg for backward pressure amplitude and 0.717 (1.25 SD) m/s for pulse wave velocity).
OPEN ACCESS
Citation:Hametner B, Parragh S, Mayer C, Weber T, Van Bortel L, De Buyzere M, et al. (2015)
Assessment of Model Based (Input) Impedance, Pulse Wave Velocity, and Wave Reflection in the Asklepios Cohort. PLoS ONE 10(10): e0141656. doi:10.1371/journal.pone.0141656
Editor:Daniel Schneditz, Medical University of Graz, AUSTRIA
Received:June 23, 2015
Accepted:October 12, 2015
Published:October 29, 2015
Copyright:© 2015 Hametner et al. This is an open access article distributed under the terms of the
Creative Commons Attribution License, which permits unrestricted use, distribution, and reproduction in any medium, provided the original author and source are credited.
Data Availability Statement:The data comprises sensitive health data and cannot be publicly accessible. Interested researchers may request access to the data by contacting Dr. Patrick Segers ([email protected]).
Conclusion
The results indicate that the use of model-based surrogates in a healthy middle aged cohort is feasible and deserves further attention.
Introduction
The consequences of arterial stiffening on aortic hemodynamics and left ventricular load are actually considered to be major determinants of cardiovascular risk beyond established risk
fac-tors [1,2]. Starting from the late 1960’s, methods were established to quantify arterial stiffness
and wave reflection at the proximal aorta under different conditions based on the concept of
vas-cular impedance [3,4]. Research was mainly driven by invasive data assessment in the early days,
but the technical development of non-invasive sensor systems like Doppler ultrasound and
vas-cular tonometry of superficial arteries facilitated non-invasive data capturing [5]. For example,
carotid to femoral pulse wave velocity measurement evolved using these techniques and proofed
its clinical usefulness [6,7]. Nevertheless, the acquisition of pulse waves or left ventricular outflow
remains time consuming and requires skilled operators as well as dedicated devices. Subse-quently, mathematical methods were investigated to substitute measured flow waveforms by
approximate or model-predicted alternatives [8,9]. Based on this simplification, new research
applications became feasible and parameters based on non-invasively assessed pressure alone turned out to predict cardiovascular events in different cohorts independent of established risk
factors [10–12]. Such mathematical models potentially allow the calculation of surrogates of
characteristic impedance (Zc) [9,13,14]. Zc is a descriptor of combined geometrical and
mechani-cal arterial wall properties, a major determinant of pulse wave velocity, and directly linked to
vas-cular load [15–17]. A recently introduced model-based approach, which is grounded on a
modified Windkessel system, aims to allow the calculation of input as well as characteristic
impedance, pulse wave velocity and wave reflections from pressure waveforms alone [18]. The
aim of this work is the comparison of Windkessel derived parameters against directly measured
values in an independent large cohort (from the ASKLEPIOS study [19,20]).
Methods
Study population
All data was selected from the ASKLEPIOS study which is a prospective longitudinal study intended to investigate the development of cardiovascular disease in the general population. The actual study population used here includes 1163 women and 1063 men within an age range from 35 to 56 years. The study was conducted on-site in Erpe Mere, Belgium, with approval of the ethics committee of the Ghent University Hospital. All subjects agreed to join the study by written informed consent. Rationale, design, methods and baseline characteristics
of the ASKLEPIOS study have been extensively published elsewhere [19]. Therefore, only a
very brief methods summary will be given in the following paragraph and basic characteristics
in Table A inS1 File. All parameters assessed by the methods described in the ASKLEPIOS
study outline will be referred to as“Asklepios”throughout the manuscript.
Data assessment
Aortic flow waveforms were captured by Echo-Doppler measurements and stroke volume subse-quently from the cross sectional area of the left ventricular outflow tract by a Vivid7 ultrasound Competing Interests:SW and CM are the inventors
machine (GE Vingmed Ultrasound). Carotid pulse waveform readings were performed by vascu-lar tonometry of the left common carotid artery. Absolute pressure calibration was done by
bra-chial mean and diastolic pressure as described in [21]. All measurements were performed
consecutively by a single, well trained operator (E.R.). Input impedance was calculated following Fourier decomposition of an averaged pressure and flow waveform, and defined as the ratio of corresponding harmonics of pressure and flow. Zc was assessed in the frequency domain and
cal-culated as the average of harmonics 3 to 10 with exclusion of outliers [20]. Carotid pulse
wave-forms (Pc) were separated into their forward (Pf) and backward (Pb) traveling components using wave separation analysis (WSA). The reflection magnitude (RM) is calculated as the ratio of backward and forward wave amplitudes. Systemic vascular resistance (SVR) was set equal to the 0 Hz frequency of input impedance (ratio of mean pressure and flow). Aortic stiffness was assessed by means of carotid-femoral pulse wave velocity (Asklepios cfPWV).
ARCSolver
The ARCSolver (AIT Austrian Institute of Technology, Vienna, Austria) method is intended to mathematically describe left ventricular outflow during systole according to a given pressure wave. The model combines a modified 3-element like Windkessel system and transmission line theory. This approach allows the estimation of static hemodynamic parameters like stroke vol-ume (SV) or systemic vascular resistance (SVR) as well as measures of pulsatile hemodynamics, like Pf or Pb by means of wave separation analysis and PWV as a derivative of Zc. A detailed
technical description and validation in the initial cohort [9,18,22–24] as well as data on its
pre-dictive value is given elsewhere [11,25].Fig 1illustrates the basic principle of the method.
Basi-cally, the algorithms were designed for the use with aortic waveforms but in this study we utilized carotid waveforms as a surrogate for the first time. To be able to process carotid wave-forms of the ASKLEPIOPS cohort we were obliged to slightly adapt the existing modelling approach: To identify the parameters in the Windkessel model, an optimization routine based
on the minimization of left ventricular work is used [18]. Here, we modified the initial values
for the parameter estimation process, but left the model, all other parameter settings and
algo-rithms unchanged. Compared to known static flow waveform models [26], the Windkessel
based ARCSolver aortic flow wave changes depending on arterial compliance and SVR, as
shown inFig 1. No additional anthropometric inputs are needed for the mathematical model
for stroke volume and blood flow wave shape, although information on age and sex are used
for signal pre- and post-processing as described earlier [18,22].
Fig 1. Changes in the shape of the modeled flow wave and the resulting stroke volume SV (ml) for a given heart rate HR and blood pressure level depending on arterial compliance Ca (ml/mmHg) and systemic vascular resistance SVR (mmHg*s/ml).Left: real scale, right: normalized to a height of 1 arbitrary unit (AU). Parameter values for A (Ca = 0.8, SVR = 1.0, SV = 99), B (Ca = 1.0, SVR = 1.4, SV = 71) and C (Ca = 1.2, SVR 1.8, SV = 55).
Statistics
Unless stated otherwise, results are expressed as mean and standard deviation (SD) in the sta-tistical analysis. Data of the comparisons were analyzed using the method of Bland-Altman
[27]. The correlation between variables was calculated using Pearson’s correlation coefficient.
To analyze determinants of estimated and measured data, regression analysis was applied. If not stated otherwise, a level of significance of p = 0.05 was used in all tests. Analyses were per-formed using MedCalc 12.3 (MedCalc software, Mariakerke, Belgium).
Results
Results for the whole study population and for men and women separately are presented in
Table 1. Detailed results of subgroup analysis according to age and sex are given in Table B in
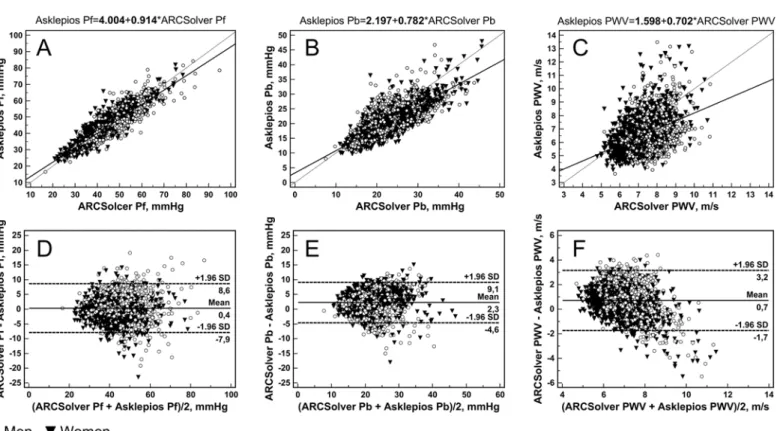
S1 File. All investigated parameters showed a significant association between the methods. In detail, mean amplitudes of separated forward pressure waves (Pf) are 43.0 (9.48 SD) mmHg and 42.6 (9.28 SD) mmHg for ARCSolver and Asklepios method, respectively, with a mean
dif-ference of 0.356 (4.21 SD) mmHg. Correlation is close with Pearson R = 0.90, compareFig 2A.
Mean amplitudes of the backward pressure waves (Pb) are 22.4 (5.44 SD) mmHg and 20.1 (5.22 SD) mmHg with a mean difference of 2.26 (3.51 SD) mmHg. For Pb, correlation is
R = 0.78 (Fig 2B). A Bland-Altman analysis for both parameters is shown inFig 2D and 2E. In
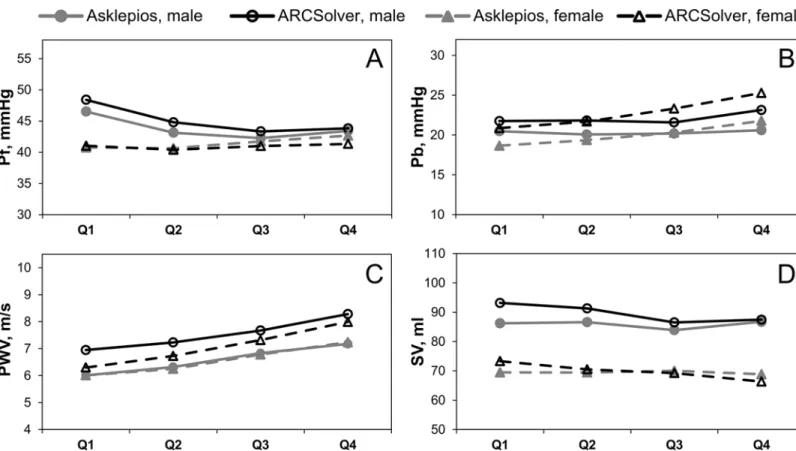
a subgroup analysis, similar trends over age for both methods can be seen except for a slight
offset in Pb, compareFig 3A and 3B. The mean ratio or reflection magnitude (RM) of Pb and
Pf is 0.529 (0.103 SD) and 0.477 (0.0872 SD) for Windkessel and Doppler based methods respectively with a significant correlation of R = 0.63.
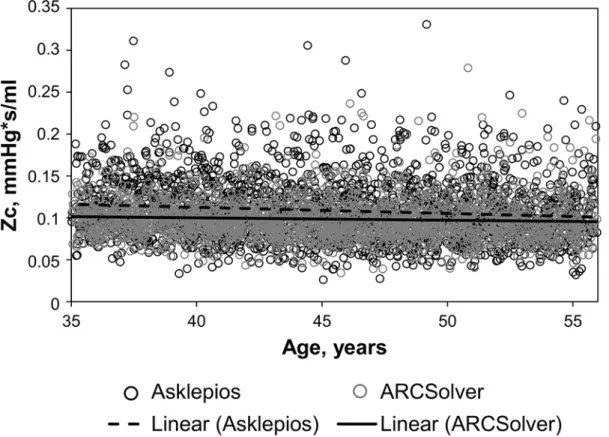
Mean Zc estimated by the model was 0.0986 (0.0248 SD) mmHgs/ml compared to 0.109
(0.0377 SD) derived from echocardiography with a mean difference of -0.0102 (0.0330 SD) and a correlation coefficient of R = 0.51. Similar effects for both approaches could be observed for the correlation to age as they were slightly negative (R = -0.07 for ARCSolver, R = -0.12 for
Asklepios) as shown inFig 4. In addition, the negative association was stronger in the male
subgroup for both methods (men: R = -0.14 vs. R = -0.16; women: R = -0.02 vs. R = -0.09,
ARC-Solver vs. Asklepios).Table 2shows the determinants of characteristic impedance for both
approaches as well as for their difference.
Estimated pulse wave velocity within the cohort was 7.28 (0.93 SD) m/s and carotid to femo-ral PWV was 6.56 (1.31 SD) m/s with a mean difference of 0.717 (1.25 SD) m/s and R = 0.42.
Scatter and Bland-Altman plot analysis (Fig 2C and 2F) shows only a slight although
signifi-cant trend. Beyond a gender-specific offset, both methods show a similar behavior with regard
to age as illustrated inFig 3C.
Mean stroke volume is 79.4 (14.3 SD) ml for the mathematical model and 77.3 (18.0 SD) ml measured by echocardiography. Derived systemic vascular resistance (SVR) is therefore 1.21
(0.232 SD) mmHgs/ml for modeled blood flow and 1.28 (0.310 SD) mmHgs/ml for measured
blood flow, respectively.
Discussion
The aim of this work was the comparison between measured surrogates of arterial stiffness and wave reflections and estimated ones derived from a model based approach in the ASKLEPIOS cohort. As indicated by previous work, calculation of wave separation parameters (WSA)
seems to be very robust due to their independence of absolute values with regard to Zc [8]. The
is designed to work with aortic waveforms which show a less steep upstroke in early systole in contrast to the carotid waveforms used in this study. This offset also caused a systematic over-estimation of the reflection magnitude RM by the ARCSolver method compared to the Doppler flow. Thus, a potential correction of Pb will also affect RM positively and further investigations are therefore indicated. Nevertheless, the results already strengthen data on outcome published
earlier for model-based methods [10–12].
While WSA parameters are supposed to serve as surrogates of pulsatile hemodynamics,
car-diac output and systemic vascular resistance are seen to represent the‘steady’cardiovascular
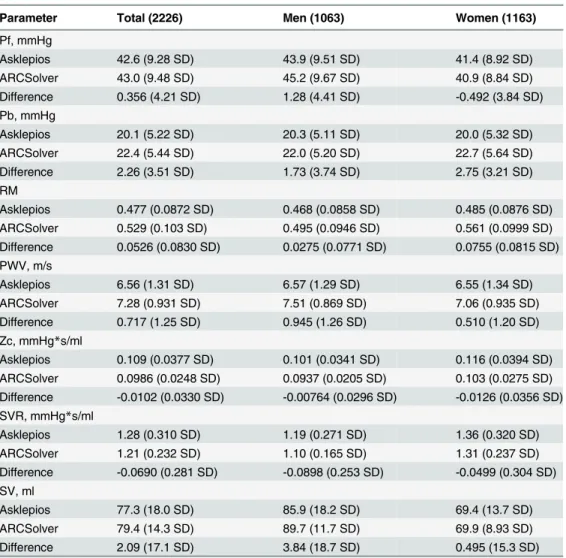
properties due to their relation to mean arterial pressure. The systemic vascular resistance Table 1. Comparison of hemodynamic parameters in the total study population and per gender group.
Parameter Total (2226) Men (1063) Women (1163)
Pf, mmHg
Asklepios 42.6 (9.28 SD) 43.9 (9.51 SD) 41.4 (8.92 SD)
ARCSolver 43.0 (9.48 SD) 45.2 (9.67 SD) 40.9 (8.84 SD)
Difference 0.356 (4.21 SD) 1.28 (4.41 SD) -0.492 (3.84 SD)
Pb, mmHg
Asklepios 20.1 (5.22 SD) 20.3 (5.11 SD) 20.0 (5.32 SD)
ARCSolver 22.4 (5.44 SD) 22.0 (5.20 SD) 22.7 (5.64 SD)
Difference 2.26 (3.51 SD) 1.73 (3.74 SD) 2.75 (3.21 SD)
RM
Asklepios 0.477 (0.0872 SD) 0.468 (0.0858 SD) 0.485 (0.0876 SD) ARCSolver 0.529 (0.103 SD) 0.495 (0.0946 SD) 0.561 (0.0999 SD) Difference 0.0526 (0.0830 SD) 0.0275 (0.0771 SD) 0.0755 (0.0815 SD) PWV, m/s
Asklepios 6.56 (1.31 SD) 6.57 (1.29 SD) 6.55 (1.34 SD)
ARCSolver 7.28 (0.931 SD) 7.51 (0.869 SD) 7.06 (0.935 SD)
Difference 0.717 (1.25 SD) 0.945 (1.26 SD) 0.510 (1.20 SD)
Zc, mmHg*s/ml
Asklepios 0.109 (0.0377 SD) 0.101 (0.0341 SD) 0.116 (0.0394 SD) ARCSolver 0.0986 (0.0248 SD) 0.0937 (0.0205 SD) 0.103 (0.0275 SD) Difference -0.0102 (0.0330 SD) -0.00764 (0.0296 SD) -0.0126 (0.0356 SD) SVR, mmHg*s/ml
Asklepios 1.28 (0.310 SD) 1.19 (0.271 SD) 1.36 (0.320 SD)
ARCSolver 1.21 (0.232 SD) 1.10 (0.165 SD) 1.31 (0.237 SD)
Difference -0.0690 (0.281 SD) -0.0898 (0.253 SD) -0.0499 (0.304 SD) SV, ml
Asklepios 77.3 (18.0 SD) 85.9 (18.2 SD) 69.4 (13.7 SD)
ARCSolver 79.4 (14.3 SD) 89.7 (11.7 SD) 69.9 (8.93 SD)
Difference 2.09 (17.1 SD) 3.84 (18.7 SD) 0.495 (15.3 SD)
Difference, ARCSolver-Asklepios
Pf (Pb), amplitude of the forward (backward) traveling pressure wave RM, reflection magnitude
PWV, pulse wave velocity Zc, characteristic impedance SVR, systemic vascular resistance
SV stroke volume. Results are given as mean (SD).
shows similar trends over age for both methods. In more detail, the increase in SVR with age is more pronounced in women than in men for both methods. This increase over age is slightly more pronounced for the ARCSolver method. SVR is directly linked to stroke volume via mean arterial pressure and heart rate and therefore stroke volume shows a similar behavior in
a mirrored way, seeFig 3D. Nevertheless, absolute values of stroke volume remain a challenge
for currently available noninvasive measurement techniques.
Characteristic impedance represents the influence of the arterial wall and subsequently the link between pressure and flow. Zc is linked to arterial stiffness, vascular load and anthropo-metric measures. The direct comparison shows again acceptable agreement. The analysis of determinants for Zc showed similar contribution of carotid pulse pressure, sex and age for both methods but, in contrast to the Doppler based method, no significant influence of body mass index on the model based approach. The influence of height on Zc in both models is only modest and should be interpreted with caution, because the effects of body size are already partly covered by the gender variable. Similar effects were found in a recent study on untreated
hypertensive subjects [17], where ARCSolver Zc was not related to BMI or body surface area.
However Zc was significantly correlated with relative wall thickness and the left ventricular mass index. Furthermore, a slightly negative correlation with age was observed for Zc for both methods, which was more pronounced in male subjects. Such behavior has also been observed
in other cohorts [28,29]. This seems to be a paradox phenomenon at a first glance but may be
explained by a potential increase of aortic diameter with age in combination with a more
pro-nounced stiffening of elastic arteries in women than in men in this age range [30–32].
Fig 2. Scatter plots with regression lines and Bland Altman plots comparing the amplitudes of the forward (A, D) and backward (B, E) traveling pressure waves obtained with the ARCSolver method and the Doppler-ultrasound flow, as well as the estimated ARCSolver pulse wave velocity and the measured Asklepios carotid-femoral PWV (C, F).Bold letters in the regression equations indicate P<0.001.
Carotid to femoral pulse wave velocity is the actual non-invasive gold standard for the
esti-mation of aortic pulse wave velocity (PWV) [7]. In a recently published meta-analysis PWV
could demonstrate its additional predictive value beyond established risk scores for several
tar-get groups [6]. To spread its useful application, simplified acquisition approaches may help.
The Windkessel based aortic PWV estimation method has already been compared in other
cohorts with cfPWV and invasive aortic measurements [22,23,33,34]. Observed results were
similar with those in this community and rating according to the ARTERY Society
recommen-dations [35] turned out to be equal. In these recommendations, a mean difference<1m/sec
(with a SD of<1.5 m/sec)–as observed in our study—between the gold standard and the
com-parator is classified as acceptable. However, further work may be beneficial to verify this agree-ment over the whole age range. The narrow age window might also explain the moderate correlation between cfPWV and ARCSolver PWV observed in this study, as age is the most important determinant of PWV. In a recent study, ARCSolver PWV from aortic pressure
curves was closely related to cfPWV and especially invasive PWV over a wide age range [33].
Furthermore, prospective longitudinal outcome data of a chronic kidney disease stage 2–4
pop-ulation was published supporting the predictive value associated with single point estimation
of PWV by the ARCSolver method [25]. Upcoming assessment of adverse cardiovascular
events in this cohort will help to provide further prospective evidence.Fig 3reveals that
cf-PWV in the Asklepios cohort develops similarly over age for men and women, while for ARC-Solver PWV higher values for men but a more rapid increase for women can be seen. It remains unclear which progressions reflect true aortic PWV. Vermeersch et al. extensively
investigated local and global stiffness behavior in the Asklepios cohort [32]. They found a
Fig 3. Amplitude of the forward Pf and backward Pb traveling pressure wave (A, B) and pulse wave velocity (C) as functions of sex and age.Q1, 35–40 years, 277/300 (m/w); Q2, 41–45 years, 274/303 (m/w); Q3, 46–50 years 265/281 (m/w); Q4, 51–56 years, 247/279 (m/w).
steeper increase for women compared to men over age for local carotid PWV and higher values in local femoral PWV in men over all age groups. In several studies looking at pulse wave velocity development over age for both sexes (carotid-femoral as well as brachial-ankle PWV), the effect of a lower PWV in women at younger ages but a steeper increase leading to similar or higher PWV in older ages can be seen. These progressions are differently pronounced,
depend-ing on the specific study and cohort [36–39]. They show sometimes small but sometimes also
significant differences.
Limitations
In this study carotid pulse waves were applied to the ARCSolver algorithms instead of central aortic pulse waves for the first time. Therefore, slight adaptions in the signal processing chain were necessary although no modifications in the model as well as the algorithms themselves were performed. Nevertheless, the modifications possibly influence the current findings. Con-firmation in other cohorts may be seen as useful. Furthermore, the study population consisted of middle-aged, healthy subjects only, thus results may not be generalizable to other cohorts. Because of the narrow age-range, this may be especially true for PWV.
Conclusion
Overall, we observed acceptable agreement for all studied parameters. The results therefore indicate that the use of model-based surrogates in a healthy middle aged cohort is feasible and deserves further attention. Furthermore, this comparison implicitly also allowed a cross-valida-tion of a potential operator dependent bias with regard to age and sex on cohort level for which Fig 4. Characteristic impedance Zc over age.
no evidence could be found. For both methods, the parameters of arterial function compared here showed their predictive power already in prospective trials and independent cohorts. The presented results show consistency and strengthen previous findings.
Supporting Information
S1 File. Supporting Information.
(DOCX)
Author Contributions
Conceived and designed the experiments: LVB MDB PS ER. Performed the experiments: ER. Analyzed the data: BH SP PS SW. Wrote the paper: BH SP CM TW PS SW.
References
1. Mancia G, Fagard R, Narkiewicz K, Redón J, Zanchetti A, Böhm M, et al. 2013 ESH/ESC Guidelines for the management of arterial hypertension: The Task Force for the management of arterial hyperten-sion of the European Society of Hypertenhyperten-sion (ESH) and of the European Society of Cardiology (ESC). Eur Heart J. 2013; 34:2159–2219. doi:10.1093/eurheartj/eht151PMID:23771844
2. Laurent S, Cockcroft J, Van Bortel L, Boutouyrie P, Giannattasio C, Hayoz D, et al. Expert consensus document on arterial stiffness: methodological issues and clinical applications. Eur Heart J. 2006; 27:2588–2605. PMID:17000623
Table 2. Analysis of determinants for characteristic impedance for both methods by a linear regression model (stepwise, enter if P<0.05, remove if P>0.1).
Variables Coefficient Standard Error P Value R partial
Model for Asklepios Zc, adjusted R2= 0.2093
Gender 0.00691 0.00206 0.0008 0.07
Age, years -0.00121 0.000128 <0.0001 -0.20
Height, cm -0.000358 0.000116 0.0021 -0.07
BMI, kg/m^2 -0.00116 0.000179 <0.0001 -0.14
HR, bpm - - -
-PP carotid, mmHg 0.00129 0.0000638 <0.0001 0.39
Model for ARCSolver Zc, adjusted R2= 0.3508
Gender 0.0109 0.00121 <0.0001 0.19
Age, years -0.000738 0.0000756 <0.0001 -0.20
Height, cm 0.000214 0.0000691 0.0020 0.07
BMI, kg/m^2 - - -
-HR, bpm - - -
-PP carotid, mmHg 0.00125 0.0000381 <0.0001 0.57
Model for ARCSolver Zc–Asklepios Zc, adjusted R2= 0.0360
Gender - - -
-Age, years 0.000435 0.000120 0.0003 0.08
Height, cm 0.000417 0.0000784 <0.0001 0.11
BMI, kg/m^2 0.00104 0.000171 <0.0001 0.13
HR, bpm - - -
-PP carotid, mmHg - - -
-PP, pulse pressure BMI, body mass index
HR, heart rate; gender, male = 1, female = 2.
3. Westerhof N, Sipkema P, van den Bos GC, Elzinga G. Forward and backward waves in the arterial sys-tem. Cardiovasc Res. 1972; 6:648–656. PMID:4656472
4. Murgo JP, Westerhof N, Giolma JP, Altobelli SA. Aortic input impedance in normal man: relationship to pressure wave forms. Circulation. 1980; 62:105–116. PMID:7379273
5. Nichols WW, O'Rourke MF, Vlachopoulos C. McDonald's Blood Flow in Arteries. 6th ed. London, UK: Hodder Arnold; 2011.
6. Ben-Shlomo Y, Spears M, Boustred C, May M, Anderson SG, Benjamin EJ, et al. Aortic Pulse Wave Velocity Improves Cardiovascular Event Prediction: An Individual Participant Meta-Analysis of Pro-spective Observational Data From 17,635 Subjects. J Am Coll Cardiol. 2014; 63:636–646. doi:10. 1016/j.jacc.2013.09.063PMID:24239664
7. Van Bortel LM, Laurent S, Boutouyrie P, Chowienczyk P, Cruickshank J, De Backer T, et al. Expert con-sensus document on the measurement of aortic stiffness in daily practice using carotid-femoral pulse wave velocity. J Hypertens. 2012; 30:445–448. doi:10.1097/HJH.0b013e32834fa8b0PMID: 22278144
8. Westerhof BE, Guelen I, Westerhof N, Karemaker JM, Avolio A. Quantification of Wave Reflection in the Human Aorta From Pressure Alone: A Proof of Principle. Hypertension. 2006; 48:595–601. PMID: 16940207
9. Hametner B, Wassertheurer S, Kropf J, Mayer C, Holzinger A, Eber B, Weber T. Wave reflection quanti-fication based on pressure waveforms alone—Methods, comparison, and clinical covariates. Comput
Meth Prog Bio. 2013; 109:250–259.
10. Wang K-L, Cheng H-M, Sung S-H, Chuang S-Y, Li C-H, Spurgeon HA, et al. Wave Reflection and Arte-rial Stiffness in the Prediction of 15-Year All-Cause and Cardiovascular Mortalities: A Community-Based Study. Hypertension. 2010; 55:799–805. doi:10.1161/HYPERTENSIONAHA.109.139964
PMID:20065155
11. Weber T, Wassertheurer S, Rammer M, Haiden A, Hametner B, Eber B. Wave Reflections, Assessed With a Novel Method for Pulse Wave Separation, Are Associated With End-Organ Damage and Clinical Outcomes. Hypertension. 2012; 60:534–541. doi:10.1161/HYPERTENSIONAHA.112.194571PMID: 22585948
12. Chirinos JA, Kips JG, Jacobs DR, Brumback L, Duprez DA, Kronmal R, et al. Arterial Wave Reflections and Incident Cardiovascular Events and Heart Failure: The Multiethnic Study of Atherosclerosis. J Am Coll Cardiol. 2012; 60:2170–2177. doi:10.1016/j.jacc.2012.07.054PMID:23103044
13. Hametner B, Weber T, Mayer C, Kropf J, Wassertheurer S. Calculation of arterial characteristic imped-ance: a comparison using different blood flow models. Math Comput Model Dyn Syst. 2013; 19:319–
330.
14. Butlin M, Avolio A. Noninvasive characterization of the effect of aortic impedance on left ventricular structure: a question of utility. J Hypertens. 2015; 33:63–65. doi:10.1097/HJH.0000000000000389
PMID:25470120
15. Chirinos J, Segers P. Noninvasive Evaluation of Left Ventricular Afterload Part 1: Pressure and Flow Measurements and Basic Principles of Wave Conduction and Reflection. Hypertension. 2010; 56:555–
562. doi:10.1161/HYPERTENSIONAHA.110.157321PMID:20733089
16. Chirinos J, Segers P. Noninvasive Evaluation of Left Ventricular Afterload Part 2: Arterial Pressure-Flow and Pressure-Volume Relations in Humans. Hypertension. 2010; 56:563–570. doi:10.1161/ HYPERTENSIONAHA.110.157339PMID:20733088
17. Pucci G, Hametner B, Battista F, Wassertheurer S, Schillaci G. Pressure-independent relationship of aortic characteristic impedance with left ventricular mass and geometry in untreated hypertension. J Hypertens. 2015; 33:153–160. doi:10.1097/HJH.0000000000000354PMID:25269017
18. Wassertheurer S, Mayer C, Breitenecker F. Modeling arterial and left ventricular coupling for non-inva-sive measurements. Simul Model Pract Th. 2008; 16:988–997.
19. Rietzschel ER, De Buyzere ML, Bekaert S, Segers P, De Bacquer D, Cooman L, et al. Rationale, design, methods and baseline characteristics of the Asklepios Study. Eur J Cardiovasc Prev Rehabil. 2007; 14:179–191. PMID:17446795
20. Segers P, Rietzschel ER, De Buyzere ML, Vermeersch SJ, De Bacquer D, Van Bortel LM, et al., on behalf of the Asklepios investigators. Noninvasive (Input) Impedance, Pulse Wave Velocity, and Wave Reflection in Healthy Middle-Aged Men and Women. Hypertension. 2007; 49:1248–1255. PMID: 17404183
22. Hametner B, Wassertheurer S, Kropf J, Mayer C, Eber B, Weber T. Oscillometric estimation of aortic pulse wave velocity: comparison with intra-aortic catheter measurements. Blood Press Monit. 2013; 18:173–176. doi:10.1097/MBP.0b013e3283614168PMID:23571229
23. Luzardo L, Lujambio I, Sottolano M, da Rosa A, Thijs L, Noboa O, et al. 24-h ambulatory recording of aortic pulse wave velocity and central systolic augmentation: a feasibility study. Hypertens Res. 2012; 35:980–987. doi:10.1038/hr.2012.78PMID:22622282
24. Parragh S, Hametner B, Bachler M, Weber T, Eber B, Wassertheurer S. Non-invasive wave reflection quantification in patients with reduced ejection fraction. Physiol. Meas. 2015; 36:179–190. doi:10. 1088/0967-3334/36/2/179PMID:25571922
25. Baumann M, Wassertheurer S, Suttmann Y, Burkhardt K, Heemann U. Aortic pulse wave velocity pre-dicts mortality in chronic kidney disease stages 2–4. J Hypertens. 2014; 32:899–903. doi:10.1097/ HJH.0000000000000113PMID:24609217
26. Kips JG, Rietzschel ER, De Buyzere ML, Westerhof BE, Gillebert TC, Van Bortel LM, Segers P. Evalua-tion of Noninvasive Methods to Assess Wave ReflecEvalua-tion and Pulse Transit Time From the Pressure Waveform Alone. Hypertension. 2009; 53:142–149. doi:10.1161/HYPERTENSIONAHA.108.123109
PMID:19075098
27. Bland JM, Altman DG. Statistical methods for assessing agreement between two methods of clinical measurement. Lancet. 1986; 327:307–310.
28. Mitchell GF, Wang N, Palmisano JN, Larson MG, Hamburg NM, Vita JA, et al. Hemodynamic Corre-lates of Blood Pressure Across the Adult Age Spectrum: Noninvasive Evaluation in the Framingham Heart Study. Circulation. 2010; 122:1379–1386. doi:10.1161/CIRCULATIONAHA.109.914507PMID: 20855656
29. Waddell TK, Dart AM, Gatzka CD, Cameron JD, Kingwell BA. Women exhibit a greater age-related increase in proximal aortic stiffness than men. J Hypertens. 2001; 19:2205–2212. PMID:11725165
30. Segers P, De Backer J, Devos D, Rabben SI, Gillebert TC, Van Bortel LM, et al. Aortic reflection coeffi-cients and their association with global indexes of wave reflection in healthy controls and patients with Marfan's syndrome. Am J Physiol Heart Circ Physiol. 2006; 290:H2385–2392. PMID:16399860
31. Devos DG, Rietzschel E, Heyse C, Vandemaele P, Van Bortel L, Babin D, et al. MR pulse wave velocity increases with age faster in the thoracic aorta than in the abdominal aorta. J Magn Reson Imaging. 2015; 41(3):765–772. doi:10.1002/jmri.24592PMID:24615998
32. Vermeersch SJ, Rietzschel ER, De Buyzere ML, De Bacquer D, De Backer G, Van Bortel LM, et al., on behalf of the Asklepios investigators. Age and gender related patterns in carotid-femoral PWV and carotid and femoral stiffness in a large healthy, middle-aged population. J Hypertens. 2008; 26:1411–
1419. doi:10.1097/HJH.0b013e3282ffac00PMID:18551018
33. Weber T, Wassertheurer S, Hametner B, Parragh S, Eber B. Non-invasive methods to assess pulse wave velocity: Comparison with the invasive gold-standard and relationship with organ damage. J Hypertens. 2015; 33(5):1023–31. doi:10.1097/HJH.0000000000000518PMID:25668350
34. Feistritzer H-J, Reinstadler SJ, Klug G, Kremser C, Seidner B, Esterhammer R, et al. Comparison of an Oscillometric Method with Cardiac Magnetic Resonance for the Analysis of Aortic Pulse Wave Velocity. PLoS ONE. 2015; 10(1):e0116862. doi:10.1371/journal.pone.0116862PMID:25612307
35. Wilkinson IB, McEniery CM, Schillaci G, Boutouyrie P, Segers P, Donald A, Chowienczyk PJ. ARTERY Society guidelines for validation of non-invasive haemodynamic measurement devices: Part 1, arterial pulse wave velocity. Art Res. 2010; 4:34–40.
36. Mitchell GF, Parise H, Benjamin EJ, Larson MG, Keyes MJ, Vita JA, et al. Changes in Arterial Stiffness and Wave Reflection With Advancing Age in Healthy Men and Women: The Framingham Heart Study. Hypertension. 2004; 43:1239–1245. PMID:15123572
37. McEniery CM, Yasmin, Hall IR, Qasem A, Wilkinson IB, Cockroft JR. Normal Vascular Aging: Differen-tial Effects on Wave Reflection and Aortic Pulse Wave Velocity. J Am Coll Cardiol. 2005; 46:1753–
1760. PMID:16256881
38. Smulyan H, Asmar RG, Rudnicki A, London GM, Safar ME. Comparative Effects of Aging in Men and Women on the Properties of the Arterial Tree. J Am Coll Cardiol. 2001; 37:1374–1380. PMID: 11300449
39. Tomiyama H, Yamashina A, Arai T, Hirose K, Koji Y, Chikamori T, et al. Influences of age and gender on results of noninvasive brachial-ankle pulse wave velocity measurement—a survey of 12517