Série Zoologia
Fundação Zoobotânica do Rio Grande do Sul Museu de Ciências Naturais
www.scielo.br/isz e-ISSN 1678-4766
Iheringia
Iheringia
Accessing camera trap survey feasibility for estimating
Blastocerus
dichotomus
(Cetartiodactyla, Cervidae) demographic parameters
Pedro Henrique F. Peres, Maxihilian S. Polverini, Márcio L. Oliveira & José Maurício B. Duarte
Núcleo de Pesquisa e Conservação de Cervídeos (NUPECCE), Universidade Estadual Paulista (Unesp), Faculdade de Ciências Agrárias e Veterinárias (FCAV) Via de Acesso Paulo Donato Castellane, s/n, 14884-900, Jaboticabal, São Paulo, Brazil. ([email protected])
Received 29 August 2017 Accepted 26 September 2017
DOI: 10.1590/1678-4766e2017041
ABSTRACT. Demographic information is the basis for evaluating and planning conservation strategies for an endangered species. However, in numerous situations there are methodological or financial limitations to obtain such information for some species. The marsh deer, an endangered Neotropical cervid, is a challenging species to obtain biological information. To help achieve such aims, the study evaluated the applicability of camera traps to obtain demographic information on the marsh deer compared to the traditional aerial census method. Fourteen camera traps were installed for three months on the Capão da Cruz floodplain, in state of São Paulo, and ten helicopter flyovers were made along a 13-kilometer trajectory to detect resident marsh deer. In addition to counting deer, the study aimed to identify the sex, age group and individual identification of the antlered males recorded. Population estimates were performed using the capture-mark-recapture method with the camera trap data and by the distance sampling method for aerial observation data. The costs and field efforts expended for both methodologies were calculated and compared. Twenty independent photographic records and 42 sightings were obtained and generated estimates of 0.98 and 1.06 ind/km², respectively. In contrast to the aerial census, camera traps allowed us to individually identify branch-antlered males, determine the sex ratio and detect fawns in the population. The cost of camera traps was 78% lower but required 20 times more field effort. Our analysis indicates that camera traps present a superior cost-benefit ratio compared to aerial surveys, since they are more informative, cheaper and offer simpler logistics. Their application extends the possibilities of studying a greater number of populations in a long-term monitoring.
KEYWORDS. Aerial survey, capture-recapture, distance sampling,population estimate, sex ratio.
RESUMO.Avaliação da viabilidade do uso de armadilhas fotográficas para estimar parâmetros demográficos de Blastocerus dichotomus
(Cetartiodactyla, Cervidae). Informações demográficas constituem a base para a avaliação e planejamento de estratégias de conservação de uma espécie ameaçada. No entanto, em muitas situações existem limitações metodológicas ou financeiras para a obtenção de tais informações para algumas espécies. O cervo-do-pantanal, um cervídeo neotropical ameaçado de extinção, é uma espécie desafiadora para obtenção de informações biológicas. Para suprir essa demanda, o presente trabalho avaliou a aplicabilidade das armadilhas fotográficas para obtenção de informações demográficas de cervo-do-pantanal em comparação com o tradicional método de censo aéreo. Na várzea Capão da Cruz, Estado de São Paulo,foram instaladas 14 armadilhas fotográficas durante três meses e realizados dez sobrevoos de helicóptero num trajeto de 13 km para detecção dos cervos-do-pantanal ali residentes. Além da contagem dos animais, objetivou-se identificar o sexo, a faixa etária e a identificação individual dos machos galhados registrados. As estimativas populacionais foram realizadas pelo método de captura-marcação-recaptura com os dados de armadilhas fotográficas e pelo método de amostragem por distâncias para os dados de observação aérea. Foram contabilizados e ponderados os custos e esforços de campo despendidos para ambas metodologias. Obteve-se 20 registros fotográficos independentes e 42 visualizações que geraram estimativas de 0,98 e 1,06 ind./km² respectivamente. Ao contrário do censo aéreo, as armadilhas fotográficas permitiram a identificação individual dos machos galhados, a proporção sexual e a detecção de filhotes na população. O custo das armadilhas fotográficas foi 78% menor, porém demandou um esforço de campo 20 vezes maior. Avaliamos que as armadilhas fotográficas apresentaram uma relação custo-benefício superiores em relação aos levantamentos aéreos, por ser mais informativa e barata e com uma logística mais simples. Sua aplicação abre a possibilidade para o estudo de um número maior de populações e o monitoramento contínuo e de longo prazo.
PALAVRAS-CHAVE.Contagem aérea, captura-recaptura, amostragem por distância,estimativa populacional, razão sexual.
Demographic parameters play a central role in wildlife conservation management. Thus, population surveys are auxiliary tools in defining the purposes of management of wild populations and allow for adequate management of
small or declining populations.
The marsh deer Blastocerus dichotomus Illiger,
1815 (Cervidae) is the largest deer in the Neotropical region, with individuals weighing up to 150 kg (Pinder &
Grosse, 1991). Adult males possess robust antlers with a
dichotomous pattern that normally have 10 points (Hofmann
et al., 1976; Duarte, 1996) and are about 60 cm in length
(Cabrera, 1961). The cycle of antler shedding is apparently
individual, and individuals with antlers are found in nature
at any time of year (H. G. C. Ramos, unpubl. data). An inhabitant of wetlands and marshes, the marsh deer has
interdigital membranes, markedly elongated hooves and relatively long limbs, denoting adaptation of the species to these environments. Historically, this species occurred over a large area, in the center of the Neotropical region
Accessing camera trap survey feasibility for estimating Blastocerus dichotomus ... PERESet al.
from the headwaters of the southern Amazon basin to the
Paraná River delta. Currently, the distribution of the marsh deer is greatly reduced and fragmented, consisting mostly of relictual populations (Duarte et al., 2016). The highest
concentrations of this species can be observed in the Brazilian
Pantanal, in the region of Bananal Island, the Araguaia River, the Guaporé River and the floodplain remnants of the Paraná River, and three regions in Argentina (Duarteet al., 2012).
In the last century, an intense decline in population
occurred and led to the disappearance of several populations.
This reduction was due to four main factors: the advancement of agricultural and urban frontiers, diseases introduced by domestic cattle, predatory hunting activities and, more recently, the construction of large hydroelectric power plants (Pinder, 1996; Duarte et al., 2012; Andrioloet al., 2013). In view of this situation, the International Union
for Conservation of Nature (IUCN) Red List now lists the status of the marsh deer as Vulnerable (VU A4cde) (Duarte
et al., 2016).
Among the methods for estimating deer populations,
aerial surveys have been used worldwide (Caughley, 1977; Koerth et al., 1997; Andriolo et al., 2005), and applied
for the marsh deer since 1976 (Schaller & Vasconcelos,
1978). Studies involving aerial surveys estimated a density of 0.54 ind/km² in the Paraná River basin (Pinder, 1996), 0.32 ind/km² in the Brazilian Pantanal (Mourãoet al.,
2000), 0.57 ind/km² in Rio Negro State Park (Tomaset al.,
1997) and 0.35 ind/km² in Porto Primavera (Andrioloet al., 2005). The use of airplanes and helicopters, together
with the linear transect technique, offers certain advantages, since the species occurs in areas of open floodplain that facilitate sightings (Andrioloet al., 2005), while being
difficult to access by land. However, this method may be infeasible for brief surveys of small populations, given the high cost of aircraft flights and the need for long journeys
to access remote areas.
In comparison, camera traps have been one of the most efficient and dynamic tools for evaluating and monitoring fauna (Ridout & Linkie, 2009; Rovero & Marshall,
2009). The use of this tool has proven to be efficient for studying species with relatively wide dispersion that occur at minimal densities, are solitary or live in very small groups (Carbone et al., 2001). Moreover, camera traps combined with the use of capture recapture models have been the main
method used to estimate populations of felines, since they
have natural spots, stripes and rosettes that can individualize
the animals based on different body markings (Karanth &
Nichols, 1998; Karanthet al., 2004).
The main limitation of using camera traps for population estimates is the difficulty in identifying individual animals that usually do not have natural markings. However, some studies have shown that scars, subtle marks, differences in coat colors and body structure afford a reliable individual
recognition from camera trap records, including cases such as
tapirs (Nosset al., 2003; Trolleet al., 2008), maned wolves
(Trolleet al., 2006) or cougars (Kellyet al., 2008) in South
America. Although the use of capture-recapture method in
these cases had its reliabitily criticized due to the ability of ambiguous identifications and small proportion of correct identifications in the sampled individuals could impact the results (Foster & Harmsen, 2012). Regarding cervids, some
Neotropical species possess branched antlers (Odocoileus,
Blastocerus, Ozotoceros and Hippocamelus), thus distinct
morphology can be used for individual identification. One example is the pioneering study by Jacobson et al.
(1997), who conducted population surveys of white-tailed
deer [Odocoileus virginianus (Zimmermann, 1780)] using
camera traps. This protocol has been used to estimate cervid
populations from camera traps, together with the capture–
mark–recapture method (DeYoung, 2011).
The direct cost-benefit comparison of aerial and camera trap surveys to estimate density was only assessed
once and brought a constructive perspective to encourage
camera trap studies in deer populations in the United States (Koerthet al., 1997). Therefore, the purpose of this study
was to assess the viability of camera traps for estimating population parameters (density, sex ratio, and age proportion) compared to the aerial survey method for the first time in the Neotropical context applied to the marsh deer.
MATERIAL AND METHODS
Study area and focal population. The study was
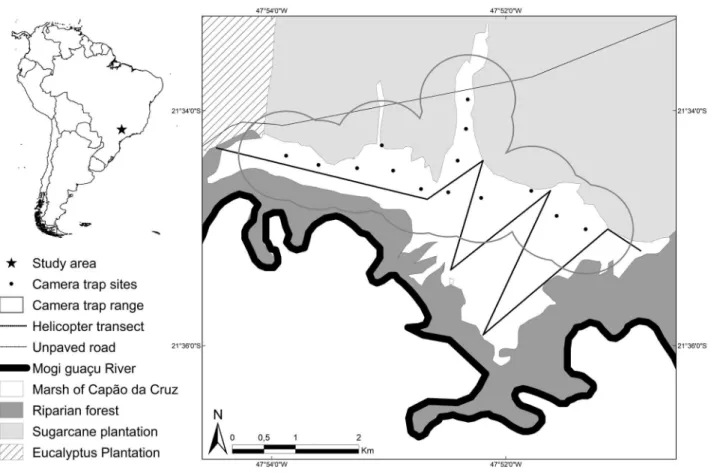
conducted on the Capão da Cruz floodplain (21°34’44.5”S 47°52’00.1”W), a wetland area of 1,512 ha along the banks of the Mogi-Guaçu River. This area is delimited to the south by the Moji-Guaçu River, to the north by a sugar cane plantation, to the west by a eucalyptus plantation, and to the east by a semideciduous seasonal forest that forms part of the Estação Ecológica do Jataí. The region is located in the Cerrado biome and within the municipality of Luís Antônio in the State of São Paulo, Brazil (Fig. 1).
The populations of marsh deer that inhabited the floodplains of the Mogi-Guaçu River were extinct in the early twentieth century (Junqueira, 1940). An ex situ and a reintroduction conservation program of the marsh deer
were initiated once the construction of the “Engenheiro Sérgio Motta” Hydroelectric Plant, in the Paraná River, was finished and vanished most of the local population of the species. One of the targets of the reintroduction program was the Capão da Cruz floodplain, where eight marsh deer (3 males, 5 females) were reintroduced between 1998 and 2001. Figueiraet al. (2005) studied the patterns of the
space use of the reintroduced deer using radio-telemetry, and reported that the home ranges of the deer varied between 0.48 to 4.06 km². In a subsequent work was estimated the home range of reintroduced deer and those born in the Estação Ecológica do Jataí, reporting mean home range of 1.17 km2
in the rainy season and 1.40 km2 in the dry season (M. A.
A. Perin, unpubl. data).
Fig. 1. Map outlining the aerial and camera trap surveys conducted at the Jataí Ecological Station, state of São Paulo, Brazil in order to obtain marsh deer demographic parameters.
temperatures and rainfall from May to August (São Paulo,
2013). Surveys were conducted in different years but both in the same season to mitigate seasonal effects on movement and density patterns. In both sampling periods (August-November) the environment was dry and the water level of the floodplain and the Mogi Guaçú River was low because of the final phase of the dry season. In this context, marsh deer present larger home ranges and low density levels due to higher habitat availability but lower food availability (M. A. A. Perin, unpubl. data).
Camera trap survey. Fourteen Tigrinus Digital 6.3D
traps were installed on artificial wooden supports in the marsh land. The traps operated 24h per day for 68 days, from September to November, 2013. The total sampling effort comprised 952 camera trap days. However, some camera traps did not work full time due to malfunction. Thus the exact effort accounted was 13,104 hours. Locations that presented indirect traces of the marsh deer, such as trails, tracks, beds and feces, were chosen when installing the equipment. The camera traps were checked every two weeks to replace batteries and memory cards. We considered that each camera trap would have a high probability of detecting resident deer within a radius of at least 700 m from the point of installation. This measurement is based on the method denominated “half mean maximum distance moved” (Wilson & Anderson,
1985; Karanthet al., 2004) and the calculation took account
the diameters of the home range of the marsh deer studied
in the dry season on the Capão da Cruz floodplain (M. A. A. Perin, unpubl. data). Given the extreme difficulties in
accessing regions with deeper waters, camera traps were not installed in these locations, but were restricted to the
outer edges of the floodplain. This design does not affect
sampling, as previous reports show that the species use
the entire floodplain gradient, from the river to its edges (Figueira et al., 2005; M. A. A. Perin, unpubl. data), and
avoid environments where water is more than 60 cm deep (Schaller & Vasconcelos, 1978).
Estimating the population parameters (density, sex ratio and age proportions) was based on the work of Jacobsonet al. (1997), who used capture–mark–recapture
models to estimate the number of branch-antlered males and extrapolated this data to the rest of the population based on
the proportions of the remaining groups in the records. For this purpose, the population was divided into four groups in accordance with Jacobsonet al. (1997)’s subdivisions:
Accessing camera trap survey feasibility for estimating Blastocerus dichotomus ... PERESet al.
so males with this configuration were considered a different group. This group is mainly composed of young bucks who typically had simple spiked antlers in their first antler cycle (H. G. C. Ramos, unpubl. data). The third group is composed
of adult females and the fourth one by fawns, identified only in their first year when they still follow their mothers closely.
Branch-antlered males were identified individually after studying antler morphology and configuration (number of points, length and direction of branches). Based on this group, population estimation by capture–mark–recapture
was performed using the Schumacher & Eschmeyer
(1943) method, implemented using the software Ecological Methodology 5.1 (Kenney & Krebs, 1998). Because of the
short study period, the population was considered closed once deaths, births and migrations are unlikely. Photographs captured at intervals of less than 15 min between shots were
discarded to ensure the independence of the recordings.
The cost of conducting the camera trap survey took into account the market price of the equipment used, adjusted according to its useful life and the period of use during the study. From personal experience and that of colleagues, we considered a useful life of three years. The cost of purchasing memory cards and batteries was added to this figure (which include the field transport and batteries costs basically). Determining the field efforts required to execute this methodology involved the time spent by two field technicians strictly to install and check the equipment on the Capão da Cruz floodplain.
Aerial survey. The aerial survey was conducted
during ten flyovers, one per day, between August and September 2015. These flyovers began around 9 AM and used a Robinson R44 helicopter, with the rear doors removed, which flew a 13 km transect (Fig. 1) at a mean velocity of 26 km/h and an altitude of 50 m above the ground. The
technical team consisted of a pilot and a crewmember who recorded the sightings, both seated at the front of the aircraft, and two observers, one on each side seated at the rear. After
sighting the deer, the observers defined their angulation in relation to the horizon by means of a manual clinometer. The angle was used to calculate the distance the deer was in relation to the transect flown by the helicopter. Whenever possible, the sex and age of individual deer were recorded. We do not estimate a specific age for individuals but only
recorded whether it was a fawn, in the case of small sized
deer following their mothers, or a juvenile male, in the case of spike-antlered males. Marsh deer fawns are known to follow their mothers for at least for 6 months during lactation and early development and hard spiked antlers are characteristic of the first antler cycles in juveniles (Piovezanet al., 2010;
Pereira, 2010).
The distances of the individual deer sighted in relation to the transect flown were used as a database for distance sampling analysis in the Distance 6.2 software (Thomaset al., 2010). To estimate the detectability, different models
were tested–uniform, half-normal and hazard-rate key–, with cosine and Hermite polynomial adjustments. The best fit function was determined by the Akaike information criterion
(AIC) index (Akaike, 1985), as implemented by Laakeet al. (1993).
The cost of conducting the aerial survey took into account the market price of the helicopter rental only during the flyovers of the transect. The cost of traveling from the heliport to the study area and back were excluded, as this can vary depending on the location of the study. The time required to execute this methodology involved the time spent by the three technicians strictly during the flight along the transect over the Capão da Cruz floodplain.
RESULTS
Sampling using camera traps recorded 62 occurrences of marsh deer, of which 20 were considered independent and valid for subsequent analyzes. Among these, 11 were antlered males, two were males with unbranched antlers, six were females and one was a fawn. The ratios between the groups were calculated based on these recordings: the proportion of branch-antlered males to spike-antlered males was 5.5:1; spike-antlered males to females was 1:3; and females to fawns was 6:1. Six males were identified individually, with five recaptures (Figs 2-5). These records determined a capture– mark–recapture estimate of 7.8 (95%CI, 5.5–13.4) branch-antlered males in the study area. Applying the proportions
calculated for each group of the population results in a total of
14.8 (10.5-25.5) individuals and a density of 0.98 (0.69–1.66) ind/km² on the Capão da Cruz floodplain (Tab. I).
The total cost of the camera traps was US$ 6,020 (US$ 430 per unit), which adjusted for the useful life of the equipment and time used in the survey resulted in US$ 495 (US$ 35.36 per unit). The cost of maintenance and changing batteries was US$ 155, so the total cost for camera trap sampling was US$ 650. The field effort was estimated at 150 h of work performed by two people.
The aerial survey resulted in 42 sightings of marsh deer. Deer only showed a reaction in response to the helicopter
on three occasions. All the sightings were of adult deer, on
most occasions it was not possible to identify the presence
or absence of antlers, though nine sightings of antlered males
were recorded. When performing analyses with Distance
software, the function that best adapted to the data was
Uniform with cosine adjustment, resulting in a density of 1.06 (0.58–1.9) ind/km² (Tab. I). This density applied to the area of the Capão da Cruz floodplain results in an estimate of 16 (8,76 – 28,72) marsh deer.
The estimated cost for the aerial survey was US$ 3000 (US$ 600/h), with a field effort of 5 h performed by a
team of three people.
DISCUSSION
The individual identification of antlered males has
been applied to other deer species, including the mule deer
(Shieldset al., 2012), sika deer (Dougherty & Bowman,
2012) and white-tailed deer (Jacobson et al., 1997),
Tab. I. Marsh deer demographic parameters results and costs of camera trap and aerial surveys conducted at the Jataí Ecological Station, state of São Paulo. Brazil. Density (individual/kilometer2), number of individuals
(n), males (M) and females (F).
Camera trap Aerial Survey Density (ind/km2)
(95%CI) (0.69 – 1.66)0.98 (0.58 – 1.90)1.06
Adult/fawn (n) 19/1 42/0
Sex ratio (M/F) 13/6
Cost (US$) 650 3000
Effort (h/person) 300 15
Figs 2-5. Individual discrimination of marsh deer males (Blastocerus dichotomus Illiger, 1815) using antler morphology: a spike-antlered male (2) and two different branched antlers (3 and 4). The arrows indicate the different horn tips. Marsh deer female accompanied by a fawn (5).
antler morphology to a Neotropical deer species. Our results confirm the veracity of this technique for the differentiation of branch-antlered marsh deer males. Despite the fact that no males with velvet antlers were recorded in this survey, special attention must be given to those records if they appear, due to the ongoing growth of velvet antlers. Similarly, survey
duration should not be neglected and short term sampling is
the best choice because males can shed their antlers anytime of the year and young males tend do it more frequently (Pereira, 2010; H. G. C. Ramos, unpubl. data)
The density determined by the camera trap method was similar to that estimated by the traditional methodology of sampling by distances obtained during the aerial survey. Although these methods presented wide confidence intervals, they were similar and compatible with the range of density values reported for the species, which vary from 0.32 to 0.99 ind/km², though in some regions they can reach 1.8 ind/km2.
(Mourão & Campos, 1995; Pinder, 1996; Mourão et al.,
2000; Tomas et al., 2001; Andriolo et al., 2005; Tiepolo
et al., 2010). Due to the propensity of seasonal changes to
influence distribution and movement patterns in the species (Tomas et al., 2001), it is necessary to highlight that densities
decribed here were observed at the end of the dry season, at which it is expected that the animals would occupy the whole area of the floodplain in a more distributed way (M. A. A. Perin, unpubl. data).
Increasing the sampling effort would contribute to a larger number of records and, consequently, increases the accuracy of the population estimate. Research on the white-tailed deer assessed trap density and verified that increasing the density resulted in better estimates (Jacobsonet al.,
Accessing camera trap survey feasibility for estimating Blastocerus dichotomus ... PERESet al.
concentration of one camera trap for every 33 ha. In this work, a sample effort of one camera trap for every 106 ha was
used, respecting the minimum spacing that would guarantee
the “capture” of the largest number of different deer. Unlike white-tailed deer, the marsh deer is a predominantly solitary species, with larger home ranges, and is not attracted by baits (Pinder, 1996; Piovezanet al., 2010). Using greater
trap density to increase the success of captures and reduce the sampling time could be an interesting way to increase the cost-benefit of the technique. Another alternative is to
increase the number of cameras per sampling site to increase
detectability (Peaseet al., 2016).
Other demographic parameters, such as sex ratio and age proportions are of equal importance in supporting the management of ungulate species (Bender, 2006; Pohleret al., 2014). However, aerial surveys of the marsh deer do not
provide these data (Mourão & Campos, 1995; Mourão et al., 2000; Tomaset al., 2001; Tiepoloet al., 2010), and it
has been reported that sexual identification is not possible in 74% of sightings (Andrioloet al., 2005). Our aerial
sampling allowed us to identify nine antlered males (not individualized), but verifying the sex ratio was not possible. In addition to the possibility of males without antlers, the
speed of the helicopter and rapid sightings hinder correct
identification. The use of camera traps is therefore important
to obtain more detailed information about the animals
observed. In our camera trap sampling, sex identification was evident, which allowed us to estimate the sex ratio of
the population studied.
The difference in detectability between the sexes is a factor that could skew the sex ratio obtained using camera trap data and bias the overall density estimate as well (Weckelet al., 2011). This difference could be related to differences in
movement, in home range sizes and in reproductive seasons
(Jacobson et al., 1997; Weckelet al., 2011). Animals with
higher movement rates tend to be more easily detectable, which could have biased the observed ratio (Sollmannet al., 2011). A deviation to a male-biased sex ratio, when the
proportion is actually equal, could underestimate the overall density obtained with a camera trap survey (Moore et al.,
2013). Despite the fact that white-tailed deer males can travel twice as far as females in a day (Webb et al., 2010)
no bias was observed in detectability by sex or recapture rates for males and females (Roberts et al., 2006; Watts et al., 2008). McCoyet al. (2011), highlighting that the main
reason for sexual bias corresponds to different responses to bait attraction. Studies that do not use bait have determined sex ratios using camera traps without further discussion (Shields et al., 2012; Ikedaet al., 2013). Weckel et al.
(2011) approached this issue proposing a standardized rather
than raw photographic ratio to correctly adress the sex ratio.
Considering this, future studies with more robust numbers of independent records should consider this approach.
Though marsh deer males have home ranges that are almost double the size of females’, it is not known if males move with greater intensity (Piovezanet al., 2010).
The sex ratio observed in this work indicates that males are
twice as common as females in the population, which is
not an expected situation in deer with a polygynus maiting system. Pinder (1996) estimated the proportion of females of a marsh deer population on the Paraná River, finding a 2:1 female/male proportion, but indicated a bias due to incorrect identification of young males without antlers. A real
male-biased proportion could be related to environmental stress
(low resource availability), inducing a biased sex ratio on birth (Hewison & Gaillard, 1996). This is not a negligible
hypothesis in the view of the number of individuals living in such a small area. Nevertheless, the importance of obtaining fine scale movement patterns of marsh deer is clear in this context in order to better understand detectability differences
among individual classes.
Similarly to sex ratios information, determining age proportions or detecting the frequency of fawns in a population
are essential to understanding population recruitment and to
infer about population dynamics (Bender, 2006; Pohler
et al., 2014). In this regard, once again the camera traps
were more informative. They allowed for observation of a very young fawn accompanying and feeding on its mother, and the identification of a male with a simple spiked antler. Both these cases are practically infeasible by aerial survey, and only Andrioloet al. (2005) and Pinder (1996) have
reported the occasional sighting of a fawn and mother.
For a population survey technique to be useful, having good accuracy is not enough, its costs must be consistent with the reality where it will be applied. Aerial surveying is a technique that is consecrated precisely because of its cost benefit when covering large areas (Caughley & Grigg,
1981). However, its use in small areas may be infeasible (Koerthet al., 1997). Changing methodologies from aerial
survey to the use of camera traps in the management of white-tailed deer populations in the United States represented a
more feasible approach for smaller, suburban populations or
those living in denser habitats (Roberts et al., 2006; Curtis
et al., 2009). The current perspective of habitat loss and
fragmentation of many species, such as the marsh deer, into
small relictual populations represents a condition where the
use of aerial surveys may be impractical. Our study clarifies
that to obtain similar results, the use of camera traps cost
21.7% of the aerial survey.
We opted to adjust the equipment costs to their useful life, as proposed by Koerthet al. (1997), on the
understanding that this better represents the operational
costs of the sampling method. This makes sense in a context
where the use of camera traps has become widespread and
diffuse (Rowcliffe & Carbone, 2008). Our relative cost
expressed in relation to the studied area was US$ 0.43/ha, which would be US$ 4.08/ha in the absence of any adjustment to the useful life of the equipment. This is similar to that reported by a recent study in the USA, which also used digital cameras and estimated an expenditure of US$ 5.56/ha without considering the period they were used for (Dougherty &
Bowman, 2012).
presented a far greater field effort that should be taken into account. Our work indicated that the difference could be 20 times greater than in an aerial count, in field effort alone. This did not include the effort expended in subsequent analysis
of the data obtained, which could be important in studies
applying intensive camera trap monitoring (Dougherty &
Bowman, 2012). Those aspects demonstrated that, in some cases, the lower financial costs of camera trap surveys do not compensate for the greater expenditure of effort required to perform studies using this technique.
On the other hand, the logistics of using a small aircraft is also an aspect that should be accounted for. The lack of availability of aircraft close to the area to be sampled is a known difficulty (Caughley & Grigg, 1981) and could
be a major problem in the Neotropical region, where large urban centers are generally far from natural areas. Although not costed in this work, the movement of the aircraft from its base to the study area can considerably increase the working costs, or make it infeasible. This cost will depend directly on the sampling protocol (number of repetitions and days of flight) or the availability of the aircraft to remain at the study area throughout the sampling season. The choice of
aircraft is also an important factor since a helicopter can
cost five times more than a small airplane. However, given their navigability (speed and maneuverability), a helicopter becomes essential when working with populations restricted
in small areas. Again, particular factors such as area format
and vegetation composition (all open grasslands or forest/ open mosaic) are important in the decision.
In view of the presented aspects, not only the size of the study area but multiple factors are related to the price and the decision of which methodology to choose. Size and shape of the area, vegetation composition and visibility, accessibility in the field, distance from an airbase and availability of the aircraft should be taken into account. Similarly, DeYoung (2011) argues that the existence of multiple factors makes evaluation dependent on the local context in the decision
process regarding the population management of deers in
the USA without a general recommendation that fulfills all
possibilities.
Considering the scarcity of resources for studying and monitoring wildlife in developing countries, expensive forms of monitoring could be prohibitive. This is evident when considering that only seven studies have involved aerial surveys in 40 years of work on the marsh deer (Schaller
& Vasconcelos, 1978; Mourão & Campos, 1995; Pinder,
1996; Mourão et al., 2000; Tomas et al., 2001; Andriolo
et al., 2005; Tiepoloet al., 2010). Our study shows the
possibilities of applying camera traps to identify
branch-antlered males and determine demographic parameters, such
as density, sex ratio and the frequency of young males and fawns. Despite requiring a much greater field effort, this methodology has a much higher cost-benefit compared to aerial surveys, because it is more informative, cheaper and the logistics are simpler. Irrespective of the need to more clearly understand the difference in detectability between population
groups and to optimize sampling through trap density, the repeated application of single sampling surveys like ours extends the possibilities for studying larger numbers of
populations or even a single population in a continuous
monitoring framework. Such long-term approaches are
essential to understanding the demographic patterns and
trends yet to be defined for the endangered marsh deer.
Acknowledgments.Field work for this study was supported
by Funbio in the context of Tropical Forest Conservation Act grant and the authors PHFP and MLO receives a scholarship from FAPESP. We thank FUNEP and NUPECCE for logistical support, the Instituto Florestal de São Paulo (COTEC SMA: 260108-004.556/2013) and the Instituto Chico Mendes de Conservação da Biodiversidade (SISBIO 38267-2) for permission to conduct research in the study site. Finally we sincerely thank Jonathan Hill for English review of the manuscript.
REFERENCES
Akaike, H. 1985. Prediction and entropy. In: Atkinson, A. C. & Fienberg, S.E. eds. A Celebration of Statistics. Berlin, Springer-Verlag, p. 1-24. Andriolo, A.; Piovezan, U.; Costa, M. J. R. P.; Laake, J. & Duarte, J.
M. B. 2005. Aerial line transect survey to estimate abundance of marsh deer (Blastocerus dichotomus) (Illiger, 1815). Brazilian Archives of Biology and Technology 48:807-814.
Andriolo, A.; Piovezan, U.; Costa, M. J. R.; Torres, H. A.; Vogliotti, A.; Zerbini, A. N. & Duarte, J. M. B. 2013. Severe population decline of marsh deer, Blastocerus dichotomus (Cetartiodactyla: Cervidae), a threatened species, caused by flooding related to a hydroelectric power plant. Zoologia30:630-638.
Bender, L. C. 2006. Uses of herd composition and age ratios in ungulate management. Wildlife Society Bulletin34:1225-1230.
Cabrera, A. 1961. Catálogo de los mamíferos de América del Sur. Revista
del Museo Argentino de Ciencias Naturales “Bernardino Rivadavia” 4:309-732.
Carbone, C.; Christie, S.; Conforti, K.; Coulson, T.; Franklin, N.; Ginsberg, J. R.; Griffiths, M.; Holden, J.; Kawanishi, K.; Kinnaird, M.; Laidlaw, R.; Lynam, A.; Macdounal, D.W.; Martyr, D.; McDougal, C.; Nath, L.; O’Brien, T.; Seidensticker, J.; Smith, D. J. L.; Sunquist, M.; Tilson, R. & Wan Shahruddin, W. N. 2001. The use of photographic rates to estimate densities of tigers and other cryptic mammals. Animal Conservation 4:75-79.
Caughley, G. 1977. Sampling in aerial survey. Journal of Wildlife Management 41:605-615.
Caughley, G. & Grigg, G. C. 1981. Surveys of the distribution and density of kangaroos in the pastoral zone of south Australia, and their bearing on the feasibility of aerial survey in large remote areas. Australian Wildlife Research 8:1-11.
Curtis, P. D.; Boldgiv, B.; Mattison, P. M. & Boulanger, J. R. 2009. Estimating deer abundance in suburban areas with infrared-triggered cameras. Human–Wildlife Interaction 3:116-128.
DeYoung, C. A. 2011. Population dynamics. In: Hewitt, D. G. ed. Biology and management of white-tailed deer. Boca Raton, CRC Press, p. 147-180.
Dougherty, S. Q. & Bowman, J. L. 2012. Estimating sika deer abundance using camera surveys. Population Ecology 54:357-365.
Duarte, J. M. B. 1996. Guia de identificação de cervídeos brasileiros. Jaboticabal, FUNEP.16p.
Duarte, J. M. B.; Piovezan, U.; Zanetti, E. S.; Ramos, H. G. C.; Tiepolo, L. M.; Vogliotti, A.; Oliveira, M. L.; Rodrigues, L. F. & Almeida, L. B. 2012. Avaliação do risco de extinção do cervo-do-pantanal Blastocerus dichotomus Illiger, 1815, no Brasil. Biodiversidade Brasileira 2:3-14.
Accessing camera trap survey feasibility for estimating Blastocerus dichotomus ... PERESet al.
Figueira, C. J. M.; Pires, J. S. R.; Andriolo, A.; Costa, M. J. R. P. & Duarte, J. M. B. 2005. Marsh deer (Blastocerus dichotomus) reintroduction in the jatai ecological station (Luis Antonio, SP): Spatial preferences. Brazilian Journal of Biology 65:263-270.
Foster, R. J. & Harmsen, B. J. 2012. A critique of density estimation from camera-trap data. The Journal of Wildlife Management76:224-236. Hewison, A. M. & Gaillard, J. M. 1996. Birth-sex ratios and local resource competition in roe deer, Capreolus capreolus. Behavioral Ecology
7(4):461-464.
Hofmann, R. K.; Prado, C. F. P. & Otte, K. C. 1976. Registro de dos nuevas especies de mamíferos para el Perú, Odocoileus dichotomus (Illiger - 1811) y Chrysocyon brachyurus (Illiger - 1811), con cotas sobre su habitat. Revista Forestal del Perú 6:1-25.
Ikeda, T.; Takahashi, H.; Yoshida, T.; Igota, H. & Kaji, K. 2013. Evaluation of camera trap surveys for estimation of sika deer herd composition. Mammal Study 38:29-33.
Jacobson, H. A.; Kroll, J. C.; Browning, R.W.; Koerth, B. H. & Conway, M. H. 1997. Infrared-triggered cameras for censuring white-tailed deer. Wildlife Society Bulletin 25:547-556.
Junqueira, J. F. D. 1940. Veados do Brasil: O cervo. Chácaras e Quintais 62:330-331.
Karanth, K. U. & Nichols, J. D. 1998. Estimation of tiger densities in India using photographic captures and recaptures. Ecology 79:2852-2862. Karanth, K. U.; Nichols, J. D. & Kumar, N. S. 2004. Photographic sampling of elusive mammals in tropical forests. In: Thompson, W. L. ed. Sampling Rare or Elusive Species. Washington, Island Press, p.229-247.
Kelly, M. J.; Noss, A. J.; Di Bitetti, M. S.; Maffei, L.; Arispe, R.; Paviolo, A.; De Angelo, C. D. & Di Blanco, Y. E. 2008. Estimating puma densities from camera trapping across three study sites: Bolivia, Argentina, Belize. Journal of Mammalogy89:408-418.
Kenney, A. J. & Krebs, C. J. 1998. Programs for Ecological Methodology. Version 5.2. Available at: <http://www.zoology.ubc.ca>.
Koerth, B. H.; Mckown, C. D. & Kroll, J. C. 1997. Infrared-triggered camera vesus helicopter counts of white-tailed deer. Wildlife Society Bulletin 25: 557-562.
Laake, J. L.; Buckland, S. T.; Anderson, D. R. & Burnham, K. P. 1993. Distance user’s guide. Fort Collins, Colorado Cooperative Fish and Wildlife Research Unit, Colorado State University. 72p.
McCoy, J. C.; Ditchkoff, S. S. & Steury, T. D. 2011. Bias associated with baited camera sites for assessing population characteristics of deer. Journal of Wildlife Management 75:472-477.
Moore, M. T.; Foley, A. M.; DeYoung, C. A.; Hewitt, D. G.; Fulbright, T. E. & Draeger, D. A. 2013. Evaluation of population estimates of white-tailed deer from camera survey. Journal of the Southeastern Association of Fish and Wildlife Agencies1:127-132.
Mourão, G. & Campos, Z. 1995. Survey of broad-snouted caiman Caiman latirostris, marsh deer Blastocerus dichotomus and capybara Hydrochaeris hydrochaeris in the area to be inundated by Porto Primavera Dam, Brazil. Biological Conservation 73:27-31. Mourão, G.; Coutinho, M.; Mauro, R.; Campos, Z.; Tomás, W. &
Magnusson, W. 2000. Aerial surveys of caiman, marsh deer and pampas deer in the Pantanal Wetland of Brazil. Biological Conservation 92:175-183.
Noss, A. J.; Cuéllar, R. L.; Barrientos, J.; Maffei, L.; Cuéllar, E.; Arispe, R.; Rumiz, D. I. & Rivero, K. 2003. A camera trapping and radio telemetry study of Tapirus terrestris in Bolivian dry forests. Tapir Conservation12:24-32.
Pease, B. S.; Nielsen, C. K. & Holzmueller, E. J. 2016. Single-camera trap survey designs miss detections: impacts on estimates of occupancy and community metrics. PloS One 11(11): e0166689.
Pereira, R. J. G. 2010. Male Reproduction. In: Duarte, J. M. B. & González, S. eds. Neotropical Cervidology: Biology and Medicine of Latin American Deer. Jaboticabal, Funep/IUCN. 394p. Pinder, L. 1996. Marsh deer Blastocerus dichotomus population estimate
in the Paraná River, Brazil. Biological Conservation 75:87-91. Pinder, L. & Grosse, A. P. 1991. Blastocerus dichotomus. Mammalian
Species Archive 380:1-4.
Piovezan, U.; Tiepolo, L. M.; Tomas, W. M.; Duarte, J. M. B.; Varela, D. & Marinho-Filho, J. S. 2010. Marsh Deer Blastocerus dichotomus
(Illiger, 1815), p. 66-76. In: Duarte, J.M.B. & González, S. eds. Neotropical Cervidology: Biology and Medicine of Latin American
Deer. Jaboticabal, Funep/IUCN. 394p.
Pohler, P. S.; Harveson, L. A. & Harveson, P. M. 2014. Demographic characteristics of elk in the Glass Mountains, Texas. Wildlife Society Bulletin 38:466-472.
Ridout, M. S. & Linkie, M. 2009. Estimating overlap of daily activity patterns from camera trap data. Journal of Agricultural, Biological, and Environmental Statistics 14:322-337.
Roberts, C. W.; Pierce, B. L.; Braden, A. W.; Lopez, R. R.; Silvy, N. J.; Frank, P. A. & Ransom, D. 2006. Comparison of camera and road survey estimates for white-tailed deer. Journal of Wildlife Management 70:263-267.
Rovero, F. & Marshall, A. R. 2009. Camera trapping photographic rate as an index of density in forest ungulates. Journal of Applied Ecology 46:1011-1017.
Rowcliffe, J. M. & Carbone, C. 2008. Surveys using camera traps: Are we looking to a brighter future? Animal Conservation 11:185-186. São Paulo. 2013. Plano de Manejo da Estação Ecológica de Jataí. São
Paulo, Secretaria do Meio Ambiente, Fundação Florestal. 302p. Schaller, G. B. & Vasconcelos, J. M. C. 1978. A Marsh Deer Census
in Brazil. Oryx 14:345-351.
Schumacher, F. X. & Eschmeyer, R. W. 1943. The estimation of fish population in lakes and ponds. Journal of the Tennessee Academic Science18:228-249.
Shields, A. V.; Larsen, R. T. & Whiting, J. C. 2012. Summer watering patterns of mule deer in the Great Basin Desert, USA: implications of differential use by individuals and the sexes for management of water resources. The Scientific World Journal 2012:1-9.
Sollmann, R.; Furtado, M. M.; Gardner, B.; Hofer, H.; Jácomo, A. T.; Tôrres, N. M. & Silveira, L. 2011. Improving density estimates for elusive carnivores: accounting for sex-specific detection and movements using spatial capture–recapture models for jaguars in central Brazil. Biological Conservation144(3):1017-1024.
Thomas, L.; Buckland, S. T.; Rexstad, E. A.; Laake, J. L.; Strindberg, S.; Hedley, S. L.; Bishop, J. R. B.; Marques, T. A. & Burnham, K. P. 2010. Distance software: Design and analysis of distance sampling surveys for estimating population size. Journal of Applied Ecology 47:5-14.
Tiepolo, L. M.; Tomas, W. M. & Lima-Borges, P. A. 2010. Levantamento populacional do cervo-do-pantanal Blastocerus dichotomus (Mammalia, Cervidae) no Parque Nacional de Ilha Grande e entorno: implicações para a conservação. Iheringia, Série Zoologia 100:111-115. Tomas, W. M.; Beccaceci, M. D. & Pinder, L. 1997. Cervo-do-Pantanal.
In: Duarte, J. M. B. ed. Biologia e Conservação de cervídeos sul-americanos: Blastocerus, Ozotocerus e Mazama. Jaboticabal, FUNEP, p. 24-40.
Tomas, W. M.; Salis, S. M.; Silva, M. P.;Mourão, G. M. 2001. Marsh deer (Blastocerus dichotomus) distribution as a function of floods in the pantanal wetland, Brazil. Studies on Neotropical Fauna and Environment 36:9-13.
Trolle, M.; Noss, A. J.; Cordeiro, J. L. P. & Oliveira, L. F. B. 2008. Brazilian tapir density in the Pantanal: A comparison of systematic camera trapping and line transect surveys. Biotropica 40:211-217. Trolle, M.; Noss, A. J.; Lima, E. S. & Dalponte, J. C. 2006.
Camera-trap studies of maned wolf density in the Cerrado and the Pantanal of Brazil. Biodiversity and Conservation 10:1197-1204.
Watts, D. E.; Parker, I. D.; Lopez, R. R.; Silvy, N. J. & Davis, D. S. 2008. Distribution and abundance of endangered Florida Key deer on outer islands. Journal of Wildlife Management72(2):360-366.
Webb, S. L.; Gee, K. L.; Strickland, B. K.; Demarais, S. & DeYoung, R. W. 2010. Measuring fine-scale white-tailed deer movements and environmental influences using GPS collars. International Journal of Ecology2010: 459610. doi: 10.1155/2010/459610
Weckel, M.; Rockwell, R. F. & Secret, F. 2011. A modification of Jacobson et al.’s (1997) individual branch-antlered male method for censusing white-tailed deer. Wildlife Society Bulletin 35:445-451. Wilson, K. R. & Anderson, D. R. 1985. Evaluation of two density estimators