Identification and characterization of polymorphisms at the HSA
α
1-acid
glycoprotein
(
ORM*
) gene locus in Caucasians
Catherine M. Owczarek
1, Aleksander L. Owczarek
2and Philip G. Board
31
Centre for Functional Genomics and Human Disease, Monash Institute of Reproduction and Development,
Monash University, Melbourne, Australia.
2Department of Mathematics and Statistics, University of Melbourne, Parkville, Australia.
3Molecular Genetics Group, John Curtin School of Medical Research, Australia.
Abstract
Humanα1-acid glycoprotein (AGP) or orosomucoid (ORM) is a major acute phase protein that is thought to play a crucial role in maintaining homeostasis. Human AGP is the product of a cluster of at least two adjacent genes located on HSA chromosome 9. Using a range of restriction endonucleases we have investigated DNA variation at the locus encoding theAGP genes in a panel of healthy Caucasians. Polymorphisms were identified using BamHI, EcoRI, BglII, PvuII, HindIII, TaqI and MspI. Non-random associations were found between the BamHI, EcoRI, BglII RFLPs. The RFLPs detected withPvuII, TaqI and MspI were all located in exon 6 of both AGP genes. The duplication of an AGP gene was observed in 11% of the indiviuals studied and was in linkage disequilibrium with the TaqI RFLP. The identification and characterization of these polymorphisms will prove useful for other population and forensic studies.
Key words: Humanα1-acid glycoprotein, RFLP, linkage disequilibrium.
Received: March 5, 2002; accepted: March 25, 2002.
Introduction
HSA α1-acid glycoprotein (AGP, orosomucoid,
ORM) is an abundantly expressed plasma protein whose levels rise dramatically during the acute phase response. A member of the lipocalin protein family, it is thought to function mainly as a transport protein for basic drugs al-though several other functions have been ascribed (Flower 1996). The expression of the ORM protein product in most individuals is controlled by two genes,AGP1andAGP2
(Denteet al.1987; Merritt and Board 1988), that are closely linked on HSA chromosome 9q31-q34.1 (Webb et al.
1987). A third gene, structurally identical toAGP2has been reported to exist in some individuals (Denteet al. 1987), and duplication of theAGP1gene has been demonstrated to occur in the Japanese population at an appreciable fre-quency (Nakamuraet al.2000). Considerable variation in the ORM polypeptide chain has been described. In addition to the two common allelesORM1*FandORM1*S (John-sonet al.1969) a large number of variants have been identi-fied in different populations (Yuasaet al.1993).
In this study we have used RFLP analysis to investi-gate DNA variation at theAGPgene locus. We have dem-onstrated the existence of RFLPs in the region upstream of theAGPgene locus as well as polymorphisms within the
AGPgene cluster and have examined linkage disequilib-rium between these sites. A duplication of one of theAGP
genes was observed in the population studied and was strongly linked with the presence of aTaqI polymorphism.
Materials and Methods
Genomic DNA samples
The samples of DNA used for screening for RFLPs were from a set of 97 unrelated Caucasian blood donors re-cruited at the Canberra Red Cross Blood Transfusion Cen-tre. An additional 20 random controls were obtained from healthy staff members at the John Curtin School of Medical Research. Family material was obtained from healthy Cau-casian volunteers.
Genomic RFLP analysis
High molecular weight genomic DNA was extracted from the buffy coat from 10 mL peripheral blood (Grunebaumet al.1984). Approximately 10µg of genomic
DNA was digested with the following enzymes according to the manufacturer’s specifications:BamHI,EcoRI,BglII,
PvuII, HindIII, MspI, and TaqI and electrophoresed through a 0.8% agarose gel. After Southern blotting of the DNA (Reed and Mann 1985) on to Gene-Screen Plus
(Dupont) nylon membranes, the filters were hybridized overnight at 65 °C with anα 32P-dCTP labeled α1-AGP
cDNA probe (Boardet al.1986).
Hardy-Weinberg and linkage disequilibrium analysis
Standardχ2tests were used to compare observed ge-notype frequencies with those expected under the Hardy-Weinberg equilibrium (Weir 1996). In order to test for linkage disequilibrium between the alleles of the differ-ent polymorphisms, contingency tables were used, with standardχ2tests and Fisher’s exact tests, producing identi-cal results. When using Fisher’s exact test we used a two-sided p-value that was the minimum of 1 and twice the one sided p-value. Because the data cannot distinguish the two possible double heterozygotes gametic frequencies could not be inferred (Weir 1996), and hence the standard test for linkage equilibrium using hapolotype frequencies was not possible. In such cases various alternative ap-proaches are possible. However, because in all cases when the data was analyzed using 2x2 contingency tables be-tween the two less common alleles, the results were ex-treme in one direction or the other the inferences of linkage disequilibrium/equilibrium were unequivocal.
Results
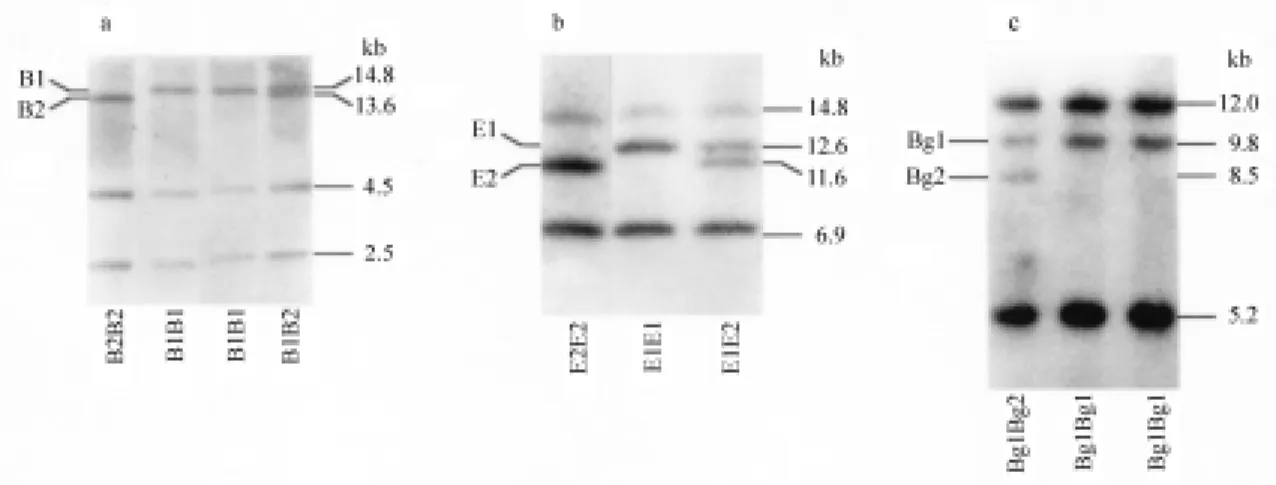
Polymorphisms detected byBamHI,EcoRI andBglII
When human genomic DNA digested with BamHI was hybridized to theα1-AGP cDNA probe, two constant
bands: 4.5 kb and 2.5 kb and two variable bands: 14.8 kb
(B1) and 13.6 kb (B2) were observed (Figure 1a). Co-domi-nant segregation was observed in Families D and M for the B1 and B2 alleles of theBamHI RFLP (Figure 3). Mapping data (Merritt and Board 1988) indicated that these hybridiz-ing bands corresponded to exons 1-5 ofAGP2and exon 6 of both AGP genes respectively placing the polymorphic
BamHI site approximately 11 kb upstream of the AGP1
gene.
Digestion of human DNA with EcoRI detected a two-allele polymorphism with bands at 12.6 kb (E1) and 11.6 kb (E2) and invariant bands at 16.8 kb and 6.9 kb (Fig-ure 1b). Co-dominant segregation of theEcoRI RFLP was demonstrated in Family D (Figure 4). The 6.9 kb invariant band contains exon 1 of AGP1 and exons 1-5 of AGP2
(Merritt and Board 1988). Hybridization with a probe spe-cific to exon 1 ofAGP1/2(data not shown) indicated that the polymorphicEcoRI site was located upstream ofAGP1.
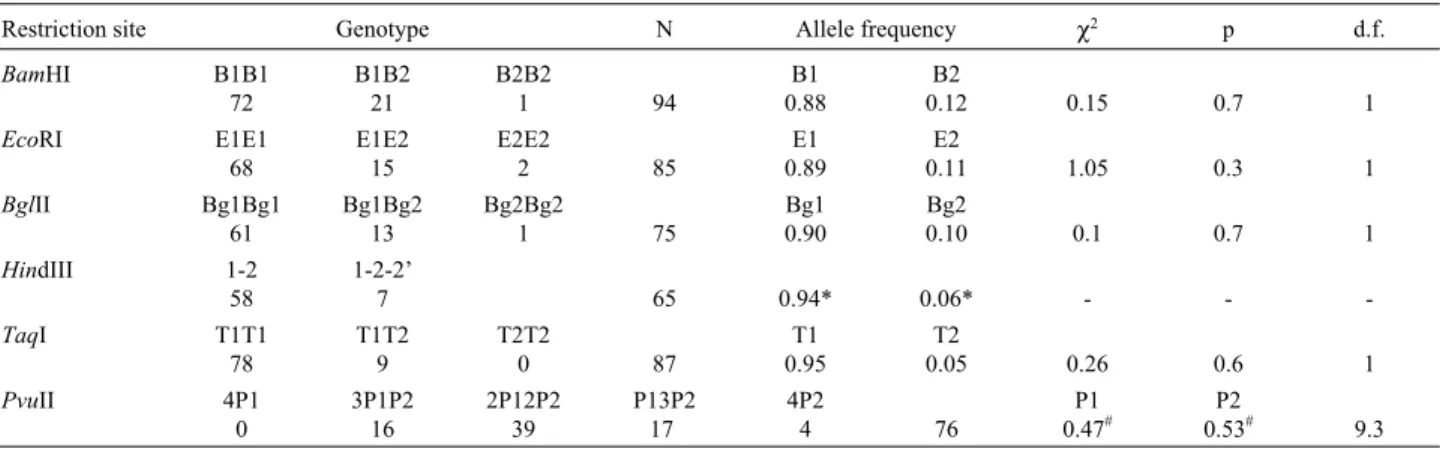
BglII digestion also detected a two-allele polymor-phism. Fragment lengths of 9.8 kb (Bg1) and 8.5 kb (Bg2) with invariant bands at 12.0 kb, 5.2 kb 0.8 kb and 0.7 kb were observed. Genetic transmission of theBglII RFLP was observed in Family D (Figure 3). The position of the polymorphicBglII site was determined from the nucleotide sequence (Merritt and Board 1988) and additional mapping experiments (data not shown). The 0.8 kb and 0.7 kb frag-ments corresponded to exons 2-3, and exons 4-5 respec-tively of bothAGPgenes. The 5.2 kb fragment contained exon 6 ofAGP1and exon 1 ofAGP2plus intergenic se-quence. The polymorphicBglII band was detected with an exon 1-specific probe indicating that it was located up-stream of theAGP1gene.
Polymorphisms detected byTaqI,HindIII,PvuII and
MspI
TaqI digestion generated a two allele polymorphism consisting of either a 3.02 kb band (T2) or a 2.88 kb band (T1) with invariant bands at 4.5 kb, 1.4 kb 1.2 kb 0.84 kb
and 0.285 kb (Figure 2a). Co-dominant segregation for the
TaqI RFLP was observed in two informative families (Fig-ure 3). Hybridization experiments and analysis of sequence data (Merritt and Board 1988) indicated that theTaqI poly-morphic site located on an exon-6 containing fragment.
When human genomic DNA was digested with
HindIII and hybridized to theα1-AGP cDNA probe two
bands at 4.6 kb (AGP1) and 6.9 kb (AGP2) were detected (Figure 2b) but the 6.9 kb band relative to the 4.6 kb band was more intense in 7 out of 65 individuals examined (11%) (Table I). The greater intensity of the 6.9 kbHindIII band relative to the 4.6 kb band in some individuals has been previously noted (Denteet al.1985; Merritt and Board 1988) and correlates with an extraAGPgene (Denteet al.
1987; Nakamuraet al.2000). Individuals were scored ei-ther as 1-2 (AGP1-AGP2on each chromosome) or 1-2-2’ indicating the presence of an extraAGPgene on one or both chromosomes (since homozygotes and heterozygotes would be indistinguishable under the conditions used in this study). Co-dominant segregation was observed in Fam-ily M (Figure 3) where the father had the intense 6.9 kb
HindIII band and the mother had 6.9 kb and 4.5 kbHindIII
bands of equal intensity. Two siblings have inherited the in-tense 6.9 kbHindIII band and the other two haveHindIII bands of equal intensity indicating that the father was het-erozygous for the presence of a thirdAGP gene and the mother was homozygous for the more common twoAGP
gene arrangement. Family M had the same pattern of inher-itance for theTaqI RFLP.
A complex polymorphism was detected in human genomic DNA digested withPvuII (Figure 2c). A total of four bands of different intensities were detected. Alleles P1 and P2 were defined by 1.8 kb and 1.6 kb bands respec-tively and invariant bands were observed at 1.46 kb, 1.38 kb and 0.69 kb. Hybridization experiments (data not shown) indicated that the polymorphicPvuII site was present in fragments containing exon 6 of eitherAGPgene. Because of the duplicated and sometimes triplicated genes in the
AGPgene locus it was not possible to determine exactly which AGP gene contained the polymorphic allele/s or what the allelic distribution was in a given individual. In the case of equal intensities of bands P1 and P2 could be the consequence of several possible arrangements of the P1 and P2 allelese.g.P1 could arise fromAGP1and P2 from
Figure 2- Southern blot analysis of the DNA polymorphisms generated by digestion with: a.TaqI (T); b.HindIII. The more intense 6.9 kb band is as-signedAGP2-AGP’because the exact identities of the duplicatedAGPgenes are not known in these samples. (1-2, normal twoAGPgene array; 1-2-2’, threeAGPgene array); c.PvuII (P); d.MspI (M) and probed with the cDNA probe pα1AGP. The phenotype is given beneath each sample. The sizes of the
AGP2on one chromosome (or vice versa). The same num-ber of P1 and P2 alleles will be present on the other chromo-some but the arrangement could either be reversed or the same. Five phenotypic classes were therefore assigned ba-sed on the intensity of each allele (P1, P2) relative to each other on an autoradiogram (Figure 2c).
1. 4P1 P1 present, P2 absent
2. 3P1 1P2 P1 band more intense than P2 3. 2P1 2P2 P1 and P2 bands equally intense 4. 1P1 3P2 P2 band more intense than P1 5. 4P2 P2 present, P1 absent
Co-dominant segregation was observed in Families R and M (Figure 3). In Family R, the father was 2P1 2P2 and the mother P1 3P2. One child was 2P1 2P2 indicating that a P1 and a P2 allele are co-segregating in the father and two P2 alleles are co-segregating in the mother. The two other children in this family were 2P1 2P2. Family M demon-strated Mendelian inheritance of a different phenotypic class where the father was 3P1 P2 and the mother was 2P1 2P2. The phenotypic class of the offspring indicated that a P1 and a P2 allele must be co-segregating in the mother whilst the father is P1/P1 on one chromosome and P1/P2 on the other.
Digestion of human genomic DNA withMspI and hy-bridization to theα1-AGP cDNA probe also resulted in a
complex band pattern. The variant fragments were desig-nated M1 to M5 in order of decreasing size: 4.4 kb (M1), 4.3 kb (M2), 3.2 kb (M3), 2.9 kb (M4), and 2.8 kb (M5). The polymorphic fragments all hybridized to an exon-6 specific probe. A total of 47 random individuals were screened and several different arrangements of the variant
MspI fragments were observed. Some representative com-binations are presented in Figure 2d. The various alleles that these fragments represent were not examined for devi-ation from Hardy-Weinberg equilibrium since extensive family studies would be necessary in order to determine the correct number of alleles in a particular individual.
Figure 3- Segregation of RFLP haplotypes in three nuclear families. Polymorphic fragment abbreviations: B,BamHI; E,EcoRI; Bg,BglII, T, TaqI; P,PvuII; M,MspI; 1-2, twoAGPgenes; 1-2-2’, threeAGPgene ar-ray. The order of the haplotypes is not intended to represent their relation-ship within theAGPgene cluster.
Table I- Genotype and Allele Frequencies of theα1-acid Glycoprotein RFLPs.
Restriction site Genotype N Allele frequency χ2 p d.f.
BamHI B1B1 72
B1B2 21
B2B2
1 94
B1 0.88
B2
0.12 0.15 0.7 1
EcoRI E1E1 68
E1E2 15
E2E2
2 85
E1 0.89
E2
0.11 1.05 0.3 1
BglII Bg1Bg1 61
Bg1Bg2 13
Bg2Bg2
1 75
Bg1 0.90
Bg2
0.10 0.1 0.7 1
HindIII 1-2 58
1-2-2’
7 65 0.94* 0.06* - -
-TaqI T1T1
78
T1T2 9
T2T2
0 87
T1 0.95
T2
0.05 0.26 0.6 1
PvuII 4P1
0
3P1P2 16
2P12P2 39
P13P2 17
4P2
4 76
P1 0.47#
P2
0.53# 9.3
χ2tests the goodness of fit to Hardy-Weinberg expectations. (d.f. = degrees of freedom). *Inferred allele frequencies under the assumption of
However, a segregation pattern consistent with Mendelian inheritance was observed in Families R and M (Figure 3). In Family R each allele were interpreted as being alleles at a separate locus. The father had bands M1, M3 and the mother had bands M1 and M2. These segregated independ-ently in each parent to give siblings with allele distributions of M1 M3, M1 M1, and M3 M2. The pattern of inheritance in Family M was more complex. Fragment M1 in the father segregated independently from bands M2, M3, M4, and M5. The mother was homozygous for M1. Two of the sib-lings have inherited an M1 band from either parent. The re-maining two siblings derived an M1 band from their mother and the M2, M3, M4 and M5 bands from their father. The bands appeared to be transmitted as a single allele although they most likely represented multiple closely linked sites on a single chromosome. Interestingly, the M2, M3, M4, M5 band arrangement had the same pattern of inheritance as theHindIII andTaqI polymorphisms in this family.
The allele frequencies for theBamHI,EcoRI,BglII,
TaqI,PvuII RFLPs and occurrence of an extraAGPgene in a sample of Caucasians are given in Table I. The observed frequency distribution of genotypes for theBamHI,EcoRI,
BglII and TaqI RFLPs did not differ significantly from those expected on the basis of a Hardy-Weinberg equilib-rium (Table I). As mentioned above, tests were carried out using the standardχ2statistic. As each RFLP was concor-dant with Hardy-Weinberg equilibrium using that statistic the more conservative Fisher’s exact test was unnecessary (despite some small expected counts).
The distribution of genotypes for thePvuII RFLP was examined for deviation from “Hardy-Weinberg equilib-rium” under the assumption that the probability of the oc-currence of similar alleles at each of the polymorphic sites is identical. In this case the null hypothesis of Hardy-Wein-berg equilibrium (Table I) amongst the alleles at the two loci is rejected on the basis of aχ2statistic using a standard significance level of 0.05. It must be remembered that this disequilibrium could be due to one or more causes. Firstly, one or more of the loci separately may be out of Hardy-Weinberg equilibrium, or secondly, that the proba-bility of the occurrence of similar alleles at each of the poly-morphic sites is not identical, or thirdly, that the two loci are in linkage disequilibrium. The experimental data does not allow reasonable discrimination between these alternatives since the two loci cannot be distinguished.
Analysis of linkage disequilibrium between polymorphic sites
The distributions of the alleles of the polymorphic loci were analyzed for linkage disequilibrium. The null hy-pothesis that each of the polymorphic sites were in linkage equilibrium was tested by both theχ2statistic and using Fisher’s exact test on 2x2 contingency tables. The 2x2 ta-bles were constructed from the 3x3 tata-bles given in Table II
by simply summing the second and third columns and rows respectively. For example, theBamHI andBglII 2x2 con-tingency table had entries 40 and 1 (being the sum of 1 and 0) in the first row, and 1 (being the sum of 1 and 0) and 10 (being the sum of 9, 0, 1 and 0) in its second row. This 2x2 table then gives the counts of the combinations of the ab-sence and preab-sence of the less-common allele of the two RFLPs in its entries. This approach was necessary because of the very low expected counts in the third columns and rows, due to the small frequencies of the homozygotes of the less common allele. P-values from theχ2statistic with 1 degree of freedom and Fisher’s exact test are both given. In all cases the two tests lead to the same conclusions. This is because when linkage equilibrium is observed using theχ2 statistic Fisher’s exact test, being a more conservative test, naturally leads to the same conclusion, and where linkage disequilibrium is inferred the results are so extreme, with p-values of less than 10-6that no ambiguity occurs. Linkage disequilibrium was observed between the following RFLPs: BamHI and EcoRI; BamHI and BglII; BglI and
EcoRI (Table II).
In order to test for linkage disequilibrium between the RFLP genotypes and the presence of multipleAGPgenes (as detected by a 6.9 kbHindIII band that was more intense relative to the 4.5 kbHindIII band) 2x2 contingency tables were constructed from the 3x2 tables given in Table III in an analogous fashion to that described above. These 2x2 ta-bles were then tested for association using, as above, theχ2 statistic and Fisher’s exact test. Linkage disequilibrium was observed between the presence of the relatively intense 6.9 kbHindIII band (1-2-2’) and hence extraAGPgene(s), and theTaqI RFLP (Table III).
Discussion
Since the initial studies (of Johnsonet al.1969) there have been many reports of genetic variation at the human
α1-acid glycoprotein or ORM locus. In this study we have
investigated DNA variation in and around the humanAGP
genes in a Caucasian population using RFLP analysis. RFLPs were detected with the use of restriction enzymes
BamHI,EcoRI,BglII,PvuII,HindIII,MspI, andTaqI. RFLPs detected by enzymesBamHI,EcoRI, BglII, were located at least 11 kb upstream of theAGPgene clus-ter and were in linkage disequilibrium with each other. This group of polymorphic loci did not deviate from a random association with theTaqI RFLP that was located within the
AGPgene cluster. Two complex polymorphisms were de-tected within non-coding regions of theAGPgene cluster usingPvuII andMspI. Interestingly, thePvuII,MspI, and
TaqI polymorphisms could be detected with an exon 6-spe-cific probe indicating a higher degree of recombination in this region of theAGPgenes.
Previous studies have suggested that the twoAGP
Table III- Contingency tables of the distribution ofα1-AGPRFLP genotypes and presence of multipleAGPgenes as detected by digestion withHindIII.
BamHI
BamHI HindIII
1-2 1-2-2’
B1B1 43 7
B1B2 12 0
B2B2 1 0
χ2
= 2, pχ= 0.15, pE= 0.36.
EcoRI
EcoRI HindIII
1-2 1-2-2’
E1E1 42 7
E1E2 11 0
E2E2 1 0
χ2
= 1.9, pχ= 0.16, pE= 0.39.
BglII
BglII HindIII
1-2 1-2-2’
Bg1Bg1 24 6
Bg1Bg2 6 0
Bg2Bg2 1 0
χ2
= 1.7, pχ= 0.2, pE= 0.5.
TaqI
TaqI HindIII
1-2 1-2-2’
T1T1 50 0
T1T2 1 7
T2T2 0 0
χ2
= 50, pχ, pE< 10-6.
The results are expressed as number of observed subjects.
1-2 indicates 6.9 kb (AGP2)and 4.6 kb (AGP1) HindIII bands of equal intensity. 1-2-2’ indicates 6.9 kb(AGP2)band more intense than the 4.6 kb (AGP1) HindIII band.
Table II- Tables of the distribution ofα1-AGPRFLP genotypes with values of theχ2statistic and its p-value pχand the p-value from Fisher’s exact test pE
based on analysis of combined 2x2 contingency tables.
BamHI andBglII
BamHI BglII
Bg1Bg1 Bg1Bg2 Bg2Bg2
B1B1 40 1 0
B1B2 1 9 0
B2B2 0 0 1
χ2
= 41, pχ, pE< 10-6.
BamHI andTaqI
BamHI TaqI
T1T1 T1T2 T2T2
B1B1 60 6 0
B1B2 15 1 0
B2B2 1 0 0
χ2
= 0.18, pχ= 0.7, pE= 1.
BglII andTaqI
BglII TaqI
T1T1 T1T2 T2T2
Bg1Bg1 35 6 0
Bg1Bg2 9 1 0
Bg2Bg2 1 0 0
χ2
= 0.23, pχ= 0.63, pE= 1.
BamHI andEcoRI
BamHI EcoRI
E1E1 E1E2 E2E2
B1B1 66 0 0
B1B2 0 15 1
B2B2 0 0 1
χ2
= 83, pχ, pE< 10-6.
BglII andEcoRI
BglII EcoRI
E1E1 E1E2 E2E2
Bg1Bg1 36 0 0
Bg1Bg2 0 9 0
Bg2Bg2 0 0 1
χ2
= 46, pχ, pE< 10-6.
EcoRI andTaqI
EcoRI TaqI
T1T1 T1T2 T2T2
E1E1 56 8 0
E1E2 11 1 0
E2E2 2 0 0
χ2
= 0.32, pχ= 0.6, pE= 0.98.
consequence of gene duplication subsequent to the diver-gence of humans from rodents (Merrittet al.1990). Indi-viduals containing three AGP genes have been reported (Denteet al. 1987; Merritt and Board 1988; Nakamuraet al.2000). These three gene arrays (AGP1-AGP2-AGP2 or AGP1-AGP1-AGP2) represent polymorphisms in the pop-ulations studied and are the result of further crossover events that must have occurred relatively recently since there were no changes in the duplicated genes studied. In the Caucasian population studied here linkage disequilib-rium was observed between the presence of an intense 6.9 kbHindIII fragment (1-2-2’ and hence multipleAGP1or
AGP2genes) and theTaqI RFLP. The simplest explanation for the origin of theTaqI polymorphism would be a point mutation that caused the loss of theTaqI site in the region between theAGP1andAGP2genes. However, if one con-siders that unequal crossing over events generated three memberAGPgene arrays (Denteet al.1987; Merritt and Board 1988; Merrittet al.1990; Nakamuraet al.2000) it is possible that a crossover event could cause the loss of a
TaqI site. In this study individuals who may be homozy-gous for the presence of a thirdAGPgene would be indis-tinguishable from heterozygotes since increased intensity of the 6.9 kb band relative to the 4.5 kb was used as the ba-sis for scoring. Interestingly, however, Family M, (Figure 3.) was informative for both theTaqI polymorphism and the presence of an extraAGP gene and those individuals that were heterozygous for theTaqI polymorphism were also heterozygous for an extraAGPgene. Furthermore, in the population studied there were no T2T2 individuals sug-gesting that there were no individuals homozygous for an extraAGPgene. Further sequence analysis of theAGP lo-cus from the individuals studied would be required to con-firm the genetic basis for observed linkage between the
TaqI polymorphism and the presence of multiple AGP
genes and to determine if the particular duplicated gene was
AGP1orAGP2.
The HSA orosomucoid polymorphisms (Yuasaet al.
1993; Yuasaet al. 1997) have been widely studied in a range of populations. The results presented in this survey provide evidence for further variation at theAGPgene lo-cus and the polymorphisms described may be potentially useful as genetic markers in a variety of forensic, linkage and population studies.
References
Board PG, Jones IM and Bentley AK (1986) Molecular cloning and nucleotide sequence of human α1-acid glycoprotein
cDNA. Gene 44:127-131.
Dente L, Ciliberto G and Cortese R (1985) Structure of the human
α1-acid glycoprotein gene: Sequence homology with other
acute phase proteins. Nucl. Acid Res. 13:3941-3952. Dente L, Pizza MG, Metspalu A and Cortese R (1987) Structure
and expression of the genes coding for human α1-acid
glycoprotein. EMBO J 6:2289-2296.
Flower DR (1996) The lipocalin protein family: structure and function. Biochem J 318:1-14.
Grunebaum L, Casenave J-P, Camerino G, Kloepfer C, Mandel J-L, Tolstoshev P, Jaye M, De la Salle H and Lecocq J-P (1984) Carrier detection of hemophilia B by using a restric-tion site polymorphism associated with the coagularestric-tion fac-tor IX gene. J Clin Invest 73:1491-1495.
Johnson AM, Schmid K and Alper CA (1969) Inheritance of hu-manα1-acid glycoprotein (orosomucoid) variants. J Clin
In-vest 48:2293-2299.
Merritt CM and Board PG (1988) Structure and characterization of a duplicated human α1-acid glycoprotein gene. Gene
66:97-106.
Merritt CM, Easteal S and Board PG (1990) Evolution of human
α1-acid glycoprotein genes and surrounding Alu repeats.
Genomics 6:659-665.
Nakamura H, Yuasa I, Umetsu K, Nakagawa M, Nanba E and Kimura K (2000) The rearrangement of the humanα1-acid
glycoprotein/Orosomucoid gene: Evidence for tandemly triplicated genes consisting of two AGP1 and one AGP2. Biochem Biophys.Res Commun 276:779-784.
Reed KC and Mann DA (1985) Rapid transfer of DNA from agarose gels to nylon membranes. Nucl Acids Res 13:7202-7221.
Webb GC, Earle EA, Merritt CM and Board PG (1987) Localiza-tion of human α1-acid glycoprotein genes to 9q31-34.1.
Cytogenet Cell Genet 47:18-21.
Weir BS (1996) Genetic Data Analysis II, 2nd ed. Sinauer Associ-ates, Sunderland, MA.
Yuasa I, Weidinger S, Umetsu K, Suenaga K, Ishimoto G, Eap BC, Duche J-C and Baumann P (1993) Orosomucoid Sys-tem: 17 additional orosomucoid variants and proposal for a new nomenclature. Vox Sang 64:47-55.
Yuasa I, Umetsu K, Vogt U, Nakamura H, Nanba E, Tamaki N and Irizawa Y (1997). Human orosomucoid polymophis: molecular basis of the three common ORM1 alleles
ORM1*F1, ORM1*F2, and ORM1*S. Hum Genet