regional committee
PAN AMERICAN
HEALTH
ORGANIZATION
WORLD
HEALTH
ORGANIZATION
XX Meeting XXIII Meeting
Washington, D.C. September-October 1971
Provisional Agenda Item 39 CD20/27 (Eng.)
17 September 1971
ORIGINAL: ENGLISH
POLIOMYELITIS CONTROL
VACCINATION PROGRAM AGAINST POLIOMYELITIS IN THE COUNTRIES OF MIDDLE AMERICA
AND SOUTH AMERICA
CD20/27 (Eng.)
VACCINATION PROGRAM AGAINST POLIOMYELITIS IN THE COUNTRIES OF MIDDLE AMERICA
AND SOUTH AMERICA
1. POLIOMYELITIS IN THE AMERICAS
The use of the oral vaccine containing attenuated live virus has resulted in the complete, or almost complete, disappearance of poliomyelitis in Canada, the United States of America and Cuba. In these countries, besides the intensive programs carried out at the time, the practice of vaccination against poliomyelitis has been kept up in such a way that new generations are immunized at an early age; moreover, epidemiological surveillance services have been organized which operate efficiently and regularly.
Another group of American countries has employed the poliomyelitis vaccine on a large scale, thereby considerably reducing the incidence of the disease. Nevertheless, poliomyelitis is still occurring, in different de-grees according to the country, and occasioning the serious sequelae of the disease in those who suffer from it. Poliomyelitis has not been eliminated in these countries due to a number of factors, including insufficient pro-portions of the susceptible population being immunized, lack of continuity in the program for protecting susceptible persons who join the community and the nonexistence of epidemiological surveillance services to prevent reappearance of the disease.
Figure 1 shows the cases of poliomyelitis, per 100,000 inhabitants, reported in the three regions of the Americas between 1955 and 1969. While in Northern America the trend has been continually downward, in Middle America it has been fluctuating and in South America, where the poliomyelitis rates are higher than in Middle America, a slow downward movement became apparent as of 1962.
Table 1 shows the number of cases of poliomyelitis reported in the Americas, by country, between 1965 and 1970, and also the deaths caused by
the disease. Taking 1970 as reference year, it can be seen that the morbid-ity rates in Middle and South America are 27 and 19 times higher, respec-tively, than in Northern America in the same year.
Between 1964 and 1968, 19 countries in Middle and South America re-ported 10,229 cases of poliomyelitis. Unfortunately, the age groups in the
statistics from the different countries are not the same, so that these data cannot be presented in a systematic form. Nevertheless, the following
information can be derived from the figures on hand: of the total number
of cases, 4,475 (43.74%) occurred in 12 countries reporting children under three, and 4,381 (42.82%) in seven countries reporting children under four. By adding these two groups together, it becomes apparent that of 10,229 persons affected, 8,856 (86.56%) are under four. Table 2 shows the
CD20/27 (Eng.) Page 2
FIGURE 1
REPORTED CASES OF POLIOMYELITIS PER 100.000 POPULATION IN THREE REGIONS OF THE AMERICAS. 19551969
1955 1951 1961 1964 1961 19964
Y ([ A
z 0
C,I
m
0.
'4
.A
CD20/27 (Eng.) Page 3
Table 1
REPORTED CASES OF POLIOMYELITIS IN 26 COUNTRIES OF THE AMERICAS, WITH RATES PER 100,000 POPULATION, 1965-1970.
Cases Rates
Country
1965 1966 196(7 1968 1969' s 1970a 1965 1966 1967 1968 1969a 1970a
Argentina ... 260 574 80 168 254 242 1.2 2.5 0.3 0.7 1.1 1.0
Barbados ... - - 1 - - - 0.4 - -
-Bolivia" ... 41 14 4 6 20 110 0.9 0.8 0.4 0.3 1.0 5.3
Brazil ... . ... . 1,585 1,143 2,263 ... ... ... 1.8 1.3 2.4
Canada ... 3 3 2 - 2 1 0.0 0.0 0.0 - 0.0 0.0
Chile ... 206 141 79 63 83 190 2.4 1.6 0.9 0.7 0.9 1.9
Colombia ... 330 489 529 261 244 (;49 1.8 2.:6(i 2.8 1.3 1.2 3.1
Costa Rica ... 15 10 7 3 105 22 1.0 0.6 0.4 0.2 6.3 1.3
Cuba ... ... -- - - 1 - - - - - 0.0
Dominican lRepublic ... 46 17 51 30 38 9 1.3 0.5 1.3 '0.7 0.9 0.2
Ecuador ... 217 148 796 52 503 164 4.2 2.8 14.5 0.9 8.7 2.7
El Salvadoro ... 8... 81 36 74 (;3 38 68 3.7 1.6 3.0 2.3 1.3 2.3
Guatemala ... 210 118 240 146 124 108 4.7 2.6 5.1 3.0 2.5 2.1
Guyana ... - - 1 7 - - - - 0.1 1.0 -
-Haiti ... 5 5 3 2 3 3 0.1 0.1 0.1 0.0 0.1 0.1
Hondurasq ... 2... 2(;5 38 79 I 62 37 16 23.2 2.8 4.9 3.8 2.3 0.9
Jamaica ... 53 6 7 - 1 6 3.0 0.3 0.4 - 0.1 0.3
Mexico ... 477 1,024 63(; 850 (679 2,043 1.1 2.3 1.4 1.8 1.4 4.0
Nicaragua ... 105 15 4i1 . 7 154 9 6.3 0.9 25.9 0.4 8.0 0.5
Panama ... 9 4 55 6 9 12 0.7 0.3 4.1 0.1 0.6 0.8
Paraguay, ... 18 14 63 70 111 124 1.7 1.3 5.6 6.0 9.2 10.0
Peru' ... 444 138 161 270 103 174 7.5 2.3 2.(; 2.1 0.8 1.3
Trinidad and Tobago ... - 1 3 1 9 3 - 0.1 0.3 0.1 0.9 0.3
United States of America ... 72 113 41 53 i 2) 30 0.0 0.1 0.0 0.0 0.0 0.0
Uruguay ... 12 29 1 22 i , i 5 0.4 1.1 0.8 0.2 0.2 0.2
Venezuelac ... . 118 199 121 568 1 117 2.0 3.2 1.9 8.5 0.9 1.6
Northern America ... 75 1 16 43 53 22 31 (. 0 .(0 0.0 0.0 0.0
Mi.illl( America ... 26 1,274 7I , 17 117 2,30 1.7 1.7 2.1 1.6 1.4 2.7
-i.,tth America' ... I ,646 1,746 I ,56 : 2,5-, 4,03 2.2 2.4 2.5 1.7 1 .6 1.9
_______________________, I l ____________
- None.
·. )ata no0, available.
IP'rovisional data; inecomllete data for Colombia aillnd l'anaulal in I19f9, anld
Or Bolivia, Colomlbia, llonduras, Mexico, I'eru, Uruguay, and Vnslz-uella ill .:'70.
.. .ilng area from 19(6i.
* .;,-lLllimr g area.
. it priug area lp to 1967.
CD20/27 (Eng.) Page 4
Table 2
POLIOMYELITIS CASES REPORTED BY
19 SOUTH AND MIDDLE AMERICAN COUNTRIES, BY AGE, 1964-1968
Under 3 years of age 4,475 43.74%
Under 4 years of age 4,381 42.82%
5-9 years of age 579 5.66%
5-14 years of age 238 2.32%
10 years of age and older 256 2.51%
Under 14 years of age 32 0.32%
15 years of age and older 104 1.01%
Not stated 164 1.60%
10,229 100%
CD20/27 (Eng.) Page 5
The data available do not provide a breakdown of the cases between urban and rural areas, but observation indicates that the greater proportion
has occurred in the urban areas, mainly the large conurbations. In the same
way it may be stated that poliovirus Type I has been most prevalent in the region.
Table 3 gives figures for the number of persons vaccinated with
attenuated live oral poliovirus vaccine, by country in the Americas, between 1965 and 1969.
2. THE CONTROL OF POLIOMYELITIS
In most countries, oral live virus vaccine is preferred because of greater ease of administration resulting in lower costs. Other advantages of the oral live virus vaccine include reduction of other enteric viruses and the initiation of a natural chain of vaccine virus transmission, thus greatly extending its immunity-producing effect.
2.1 With regard to schedules for administration of live virus vaccine,
Dr. Albert B. Sabin's recommendations are as follows:
Vaccination of the maximum possible number (at least 80%) of the children in urban areas between two months and three years of age, inclusive (i.e. the cut off is with children who are 4 years of age or over), in a specially organized mass campaign on two
separate Sundays of the year, with an interval of not less than two months between them. On the first Sunday the children should be given a dose of Type I oral vaccine, and on the second Sunday a dose of oral trivalent vaccine. This schedule should be repeated in successive years for all children in the age group indicated above.
Under this scheme, children starting their initial vaccination at two months of age will have received before their fourth birth-day a total of four doses of Type I vaccine, and four doses of
trivalent vaccine. This type of program would be an annual activ-ity. This vaccination schedule has many advantages, especially in areas with a high prevalence of other enteric viruses during all seasons of the year, and where naturally occurring polioviruses are also still being extensively disseminated.
The simultaneous administration of the vaccine strains on a single day results in a great reduction in the prevalence of other enteric viruses, as well as of the natural polioviruses, and also sets up a natural chain of transmission of the vaccine
strains. This has been found to result in a much higher level of
CD20/27 Page 6
Table 3
PERSONS IMMUNIZED WITH ATTENUATED LIVE POLIOVIRUS VACCINE BY COUNTRY. 1965-1969.
Country
Argentina' ... Barbados ... IBolivia ... Brazil ... Canada ... Chile ...
Coloml)ia ...
Costa Ri(ca ... Cu(ba ...
D)Ollinicanll lRpI)nlic ... Ec:(lladll ...
El: Salv:ul'r ... ( at(lmala ... Guyana ... .. ...
I ondllas ...
.Jamaica ... Mexico ...
Nicaragua... Panama ...
Paraguay ...
Pcru ...
Unitel States of America".l . Uruguay"l ...
Ve('ll('ZIItI ...
Number of
doses-3 3 2 2 3 2 2 3 2 2 3 2 2 2 2 3 3 3 2 2 3 3 2 3
19,5 I
6,774,571 2,118 11,505 2,155,706( 190,935 29,3(i4 230,716i 72,101 174 175,384 06,i,540 13,135 3,635, 686 19,680 5,761 266,789 17,981 34,043 476,31 l'
196'i7 10,186,196 1,521 71,797 1,521 ,747" 228,271 92,421 94,967'' 234 ,985 28, 659 15,484
I 86, 238
6(i7 ,163 20, 604 50,213 21,347 1,140,510 8,958 16,931 1,969,500' 81 ,915 486, 80)1
1968
3,005,529 2,244,742
2,484 18,068
...
608
7,708,056i
1,394,779 1,547,394"
268,227 239,590
228, 878xxI
302,378" X7, X(il"
222, 872 204,936
24,436i 2,328,349" 620(, 09!1 i 493,634
82,853 (i9,241
(;65, 35.9 28,879
7,044'
79,832 64,505
7,351
1,701,127 2,293,027
65,283
(10,970 14,010
11,976 763
2,930,026" 2,344,162 "
-8,06(6,000
---335,854 188,417
137,914 190,730
... )a Inot availale.
I Fr ,,l clir ol llttry lre.rls, r o l.ht ,uall, r brf doses('. Itally giVn!II ill tilhe ;priilary
ollurse.
I1, Nuimber of Idoses adaminislterd.
I iased on Second ldoses only.
1 Based 1on tIhe plercentage . f the piolullation n 1-4 years of age found to have
hIadl :1 or Iltore doseCs f liv'e or inaEtivated tpoliovirils vaccine in a samllple survey
ill HI(fIN.
(Eng.) 1969 2,600,342b 2,103 1,118,983" 829,555 242,691" I ,156,1191 926,2781
221 ,i860"
CD20/27 (Eng.) Page 7
2.2 Another possible scheme which the countries may wish to consider for
the vaccination of the children between two months and three years of age in the urban areas is the following:
2.2.1 Three doses of oral trivalent vaccine given to 80% of the children under one year, with two months between the first two doses and the third dose being given six to eight months after the second. A booster dose would be given in the following year.
2.2.2 Three doses of oral trivalent vaccine given to 80% of the children from one to three years old (excepting those children having received three doses in their first year of life). The first two doses would be separated by an interval of two months and the third would be
given six to eight months after the second.
With regard to vaccination schemes different from 2.1, Dr. Sabin believes that where programs of the type described in paragraph 2.1 cannot be properly organized or carried out, that random administration of the
vac-cine is at best only a poor substitute. It may be well in such circumstances to consider having a special epidemic preparedness program, in which vac-cination would occur as early as possible after a potential epidemic may be suspected.
2.3 During poliomyelitis epidemics:
All affected are groups given an oral vaccine containing the type of virus prevalent in the epidemic, after which one of the two schemes indicated under 2.1 or 2.2.1 and 2.2.2 would be followed.
3. PLANS OF OPERATION
Whatever the vaccination scheme selected, the preparation of a plan of operation is imperative in a poliomyelitis control program. The plan must cover the aspects relating to planning, programming, organization,
evaluation, and epidemiological surveillance.
Planning includes the organizing of a data registration system (re-porting, registration, tabulation, analysis, interpretation, and publication of the data); the analysis of the resources available, both human and mate-rial, and their actual and potential utilization; analysis of the techniques to be employed in terms of effectiveness, yield, cost, secondary effects and community acceptance; and determination of quantitative objetives in terms of time.
CD20/27 (Eng.) Page 8
The organizational work has to be directed toward determining the most suitable structure for the normal implementation of the actions
planned in the program. Where there are integrated health services, these should be the normal vehicles for a poliomyelitis vaccination program. Where such services are not available, coordination of the poliomyelitis vaccination program with control programs for other infectious diseases
and community development programs are mechanisms to be considered.
Where none of the foregoing are in existence, categorical vaccination programs may be carried out, every effort being made to have such programs serve as starting points for the organization of permanent health services. The cooperation of the community has to be obtained whatever the degree of development of the health services.
Evaluation includes the quantitative and the qualitative aspects, and also the permanent determining of the yield of the personnel and equip-ment and the cost of the units deployed.
Epidemiological surveillance includes the following aspects:
(a) Clinical diagnosis: Other diseases of the nervous system may have clinical characteristics similar to those of poliomyelitis, hence the necessity of an early and accurate diagnosis for
cor-rect treatment of the disease and the adoption of the proper
measures to control it. It is accordingly recommended that a
group of distinguished clinical doctors from the continent,with a wide experience of poliomyelitis, be selected, whose assistance would be sought by the Organization, at the request of the
coun-tries, whenever it was necessary and whose function would be to cooperate in the diagnosis of poliomyelitis and train the local doctors in the differential clinical diagnosis of the disease.
(b) Laboratory diagnosis: isolation of the virus, diagnosis and
serotyping of the same to complement the clinical diagnosis. Seven South American and three Middle American countries have reported that they have laboratory facilities and trained
per-sonnel for carrying out these tests. In this way a chain of
laboratories can be organized which could handle the isolating of the virus, diagnosis and typing of the virus in the countries where the laboratories are located and for those countries which do not have such facilities, in accordance with the rules to be set for this purpose.
(c) Recording of morbidity
(d) Recording of mortality
(e) Interview surveys
CD20/27 Page 9
(Eng.)
4. DETERMINATION OF THE QUANTITY OF VACCINE TO BE EMPLOYED AND THE
ESTIMATED COST OF THE VACCINE, ACCORDING TO THE SCHEDULE ADOPTED
4.1 Schedule as in 2.1
Population under four years of age, urban areas, 1972:
Table 4
POPULATION UNDER FOUR YEARS OF
Under 1 Year
South America 3,826,200
Central America 1,584,710
Caribbean Area* 315,530
TOTAL 5,726,440
*Excluding USA territories
1 Year
3,429,800
1,514,080
300,830
5,244,710
Calculation of the number of doses virus and oral trivalent vaccine:
AGE, URBAN AREAS, 1972
2 Years
3,337,100 1,437,820
291,870
5,066,790
3 Years
3,220,600
1,406,350
299,350
4,926,300
Total
13,813,700
5,942,960
1,207,580
20,964,240
of oral vaccine containing Type I
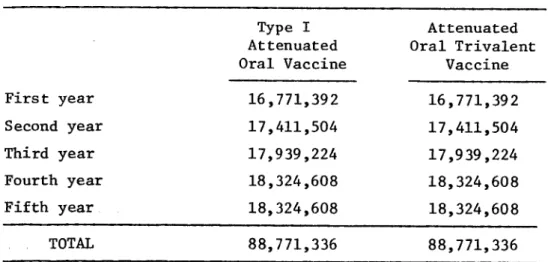
Table 5
ESTIMATED NUMBER OF DOSES OF VACCINE USING SCHEME 2.1 (80% of population under four years of age)
First year
Second year
Third year
Fourth year
Fifth year
TOTAL
Type I Attenuated Oral Vaccine
16,771,392
17,411,504
17,939,224 18,324,608
18,324,608
88,771,336
Attenuated Oral Trivalent
Vaccine
16,771,392
17,411,504
17,939,224
18,324,608
18,324,608
88,771,336
CD20/27 Page 10
(Eng.)
Estimated cost of the vaccine, per year and for a five-year period:
Table 6
ESTIMATED COST* OF ATTENUATED ORAL VACCINE, USING 2.1 SCHEME (80% of population under four years of age)
(In US dollars)
First year
Second year
Third year
Fourth year
Fifth year
Type I Attenuated Oral Vaccine
$
503,143
522,345
538,177
549,738 549,738
Attenuated Oral Trivalent
Vaccine
$
503,143
522,345
538,177
549,738
549,738
TOTAL 2,663,141 2,663,141 5,326,282
*The amounts shown are based upon known costs of vaccine currently available. If vaccine can be purchased in lots of several million doses it is expected that some economies would be affected below the figures shown.
4.2 Schedule as in 2.2
Population under four, urban areas, 1972:
Table 7
POPULATION UNDER FOUR YEARS OF AGE, URBAN AREAS, 1972
Under 1 Year 1-3 Years Total
South America 3,826,200 9,987,500 13,813,700
Central America 1,584,710 4,358,250 5,942,600
Caribbean Area* 315,530 892,050 1,207,800
TOTAL 5,726,440 15,237,800 20,964,240
*Excluding USA territories
Total
$
1,006,286
1,044,690
1,076,354
1,099,476
CD20/27 Page 11
(Eng.)
Calculation of the number of doses of oral trivalent vaccine, per year and for a five-year period:
Table 8
ESTIMATED DOSES OF ATTENUATED ORAL TRIVALENT VACCINE, USING 2.2 SCHEME
A. Attack Phase First year
80% under 4 years 16,771,392
3 doses each attenuated oral trivalent vaccine 50,314,176
B. Maintenance Phase Second to fifth year
80% under one year 4,581,152
3 doses attenuated oral trivalent
vaccine per year 13,743,456
80% under one year 4,581,152
One booster dose 4,581,152
Total vaccine doses per year Total vaccine doses for 4 years
18,324,608
73,298,432
Total for five-year program 123,612,608
Estimated cost of the oral trivalent vaccine, per year and for a five-year period:
Table 9
ESTIMATED COST OF ATTENUATED TRIVALENT ORAL VACCINE, USING 2.2 SCHEME (In US dollars)
A. Attack Phase First year
50,314,176 doses at 0.03 per dose $1,509,426
B. Maintenance Phase Second to fifth year
Total vaccine doses
first year 18,324,608 = $549,739
Total vaccine doses for
4 years 73,298,432
Total for five-year program
2,198,953
C
CD20/27 (Eng.) Page 12
5. PAHO/WHO COOPERATION
5.1 Technical personnel.
5.1.1 Medical personnel of the Central Office unit responsible for the program.
5.1.2 Medical and paramedical personnel from the other Central Office departments involved in the program: statistics, nursing, health education, planning, laboratory, health administration, etc.
5.1.3 Epidemiologists, statisticians, planners and administrators for zones and countries.
5.1.4 PAHO/WHO Zone and Country personnel.
5.2 Assistance by PAHO/WHO technical personnel. PAHO/WHO technical staff
will assist the technical personnel of the countries in the following fields:
5.2.1 Study of the problem of poliomyelitis in the countries.
5.2.2 Assistance with the preparation of plans of operation for control and epidemiological surveillance programs for poliomyelitis.
5.2.3 Evaluation of the programs.
5.2.4 Training of staff by means of local courses, visits by specialized consultants, fellowships abroad, etc.
5.2.5 Organization and running of laboratories for the isolation, diagnosis and typification of the poliomyelitis virus.
5.2.6 Provision of specialist medical personnel, in the case of epidemics or threatened epidemics of poliomyelitis, for study of the problem, clinical diagnosis of the disease, suggesting plans of action, evaluation and epidemiological watch duties.
5.3 In addition, PAHO/WHO would assist the countries by making its
admin--istrative services available for vaccine purchasing.
5.4 In the same way, in emergency cases the Organization would supply
vaccine, of the type of virus prevalent, for control of the outbreak. For
CD20/27 (Eng.) Page 13
Table 10
5.5 Bxtraordinuar costs and number of consultants in the PAHO/WHO estimate
1st year 2nd year 3rd year 4th year 5th year 6th year Total
5.5.1 Short-term consultants:
(a) Laboratory 12 montl
(b) Refrigeration 12 "
(c) Planning 3
(d) Statistics 3
(e) Others (clinics,
health educn.) 6 "
Total 36 montl
Cost USS 64,800
5.5.2 Refrigeration equipment
(a) Freezers (140) 35,000
(b) Refrigerated
flasks (1000) 25,000
(c) Stocks of spare parts for
re-frigeration
equipment 5,000
5.5.3 Transport vehicles (50) 100,000
(a) Stores 10,00
5.5.4 Statistical material (stationery, cards,
ink, etc.) 20,000
5.5.5 Laboratory material
(a) For dispatch of
samples 5,000
(b) International
trans-port of samples 2,000
(c) Laboratory and
spe-cialized equipment 20,000
5.5.6 Training of personnel
(a) Assistance with courses 15,000
(b) Short-term fellowships
abroad 14,000
hs ha (70) (500) (10) 8 months
8 "
3 "
3 "
3
26 months
46,800 8 months 6 3 3 4
24 months
43,200
6 months
4
2
3 "
4
19 months
34,200
6 months
4
2
3 "
4
19 months
34,200
6 months
4
2 "
3
4 "
19 months
34,200
35,000 (70)
25,000 (500)
5,000 100,000 10,000 20,000 5,000 2,000 20,000 10,000
14,000 (10) 2,000 8,000 20,000 2,000 5,000 5,000
7,000 (5)
2,000 8,000 20,000 2,000 2,000 2,000 12,000 20,000 2,000 2,000 2,000 12,000 10,000 2,000 2,000 257,400 70,000 50,000 18,000 200,000 60,000 110,000 10,000 12,000 51,000 30,000 42,000
7,000 (5)
5.5.7 Oral vaccine for 5 year program
5.5.8 Permanent reserve of 2 million doses of Type I
attenuated oral vaccine
5.5.9 Contingencies
Total
1,100,000 1,100,000 1,100,000
60,000 10,000 1,485,800 10,000 1,402,800 60,000 5,000 1,257,200
1,100,000 1,100,000
-- 60,000
5,000 5,000
1,180,200 1,237,200