ON TWO METHODS TO ESTIMATE PRODUCTION
OF Eichhornia crassipes IN THE EUTROPHIC
PAMPULHA RESERVOIR (MG, BRAZIL)
GRECO, M. K. B.1 and FREITAS, J. R. de2
1Ecologia, Conservação e Manejo de Vida Silvestre, Departamento de Biologia Geral, Instituto de
Ciências Biológicas, Universidade Federal de Minas Gerais, CEP 31270-901, Belo Horizonte, MG, Brazil
2Departamento de Biologia Geral, Instituto de Ciências Biológicas, Universidade Federal de Minas Gerais,
CEP 31270-901, Belo Horizonte, MG, Brazil
Correspondence to: Magda Karla Barcelos Greco, Departamento de Biologia Geral, Instituto de Ciências Biológicas, Universidade Federal de Minas Gerais, CEP 31270-901, Belo Horizonte, Minas Gerais, Brazil, e-mail: [email protected] Received August 14, 2000 – Accepted December 11, 2000 – Distributed August 31, 2002
(With 2 figures)
ABSTRACT
This paper deals with variations in biomass and in the production of Eichhornia crassipes (water hyacinth) in a eutrophic tropical reservoir. Net production was assessed by both a traditional method and a demo-graphic approach. The initial biomass ranges from 96 g DW.m–2 to a maximum of 2027 g DW.m–2.
Net production estimates varied greatly according to which method was used to calculate them (tra-ditional: 20.6 ton DW.hectare–1.year–1, demographic: 226.9 ton DW.year–1).
Key words: Eichhornia crassipes (water hyacinth), biomass production, modular demography, macrophytes.
RESUMO
Sobre dois métodos para estimar a produção de Eichhornia crassipes no reservatório eutrófico Pampulha (MG, Brasil)
Este estudo mostra as variações da biomassa e da produção de Eichhornia crassipes em um reservatório eutrófico tropical. A produção líquida foi estimada por intermédio do método tradicional e do demo-gráfico. A biomassa inicial de 96 g PS.m–2 chegou ao máximo de 2.027 g PS.m–2 A produção líquida
variou de acordo com o método utilizado para sua estimativa (tradicional: 20,6 ton PS. ha–1.ano–1,
demográfico: 226,9 ton PS.ano–1).
Palavras-chave: Eichhornia crassipes (aguapé), produção de biomassa, macrófitas, método demográfico.
INTRODUCTION
Some macrophytes when introduced into new habitats, undergo a great demographic explosion, and so are regarded as weeds (Holm et al., 1969). Eichhornia crassipes (Mart.) Solms, one such species, is one of the main aquatic weeds in 52 different countries (NAS, 1981).
The high reproductive capacity and rapid growth of Eichhornia crassipes endow it with high vegetative development and productivity rates. These characteristics, along with an extreme tolerance, have given this macrophyte efficient
mechanisms for reproduction and dispersion, rendering it able to form dense stands within a few months in a large variety of habitats, such as rivers, lakes, or reservoirs. This could be the result of the lack of predators, competitors, or natural endemic diseases, added to intrinsic characteristics of the species, or physical and chemical conditions of the habitat (Gopal, 1987).
also cause an increase in appropriate sites for the development of mosquitoes and snails, which are vectors of several diseases, and deplete oxygen in the superficial levels of the water column, which can cause great plankton and fish mortality (NAS, 1981).
Many researches have evaluated using dif-ferent methods biomass production of this species, both in the field and laboratory. These studies show that its production can range from 14 to 44 t DW.ha–1.year–1 (see Gaudet, 1974). However,
works carried out under natural conditions have not emphasized demographic approaches, which take into account classical analysis of growth and allow for flow in individuals and their constituting parts (McGraw & Garbutt, 1990). Since this flow represents the cycling of nutrients and the input of organic matter into the water body, its determination is important in studies of the ecology of aquatic systems (Pinto-Coelho & Greco, 1999). This research aimed at measuring the net primary production of Eichhornia crassipes using both a traditional method and a demographic ap-proach to determine the temporal variations in its growth rate according to the biomass variation and the number of ramets and leaves. Identification of factors influencing those rates (nutrients, environ-mental temperature, density) and determination of the leaf and ramet turnover in the population, as well as estimates of dry mass input in the eco-system, were further goals of the study.
STUDY SITE
This study was undertaken at the Pampulha Reservoir, located in Belo Horizonte (Brazil). It is small, having a volume of 12 million m3 of water,
an area of 260 hectares, a perimeter of 21 km, a maximum depth of 16 m, and has been considered eutrophic since 1984 (Giani, 1994). Among the main causes of its eutrophy is the dumping of do-mestic sewage from a population of about 200,000 inhabitants. In recent years an explosion has oc-curred in the growth of Eichhornia crassipes, which has become the dominant species in the reservoir.
METHODS
The temporal dynamics of E. crassipes was assessed in plants kept in five enclosures of 9.0 m2
(3 m x 3 m), each made of nylon web. They were
fixed in the sediment by means of wood sticks. E. crassipes ramets were transferred to each enclo-sure in April, 1994. Ramets were small, with leaves showing dilated petioles. Initial density in each enclosure was 17 ramet m–2. Density of ramets was
evaluated during each sampling. Analyses were done from May/94 to June/95.
Biomass production
One out of the five enclosures was used for biomass production analysis. On each sampling date, three samples of plants were collected using a square of PVC tubes with an area of 0.50 m x
0.50 m, following Westlake (1965). The ramets were washed in running water to remove periphyton, macroinvertebrates, and attached organic and inor-ganic material. To determine the dry weight, ramets were separated, numbered, and dried in an oven at 70ºC until constant weight was reached. Growth rate determination was according to the formu-la described by Radford (1967).
ABSOLUTEGROWTHRATE (AGR)
W W
t t
2 1
2 1
− −
RELATIVEGROWTHRATE (RGR)
lnW lnW
t t
2 1
2 1
− −
where: W = mean plant biomass for a group of harvested plants, t = time.
Annual biomass productivity was calculated through the sum of the monthly differences in dry weight.m–2. The figures were then converted into
t.ha–1.year1.
Demographic approach
The determination of relative growth rate for demographical growth was determined according to the procedure described by McGraw & Garbutt (1990).
DEMOGRAPHICRELATIVEGROWTHRATE (DRGR)
lnη2 lnη1
2 1
− −
t t
where: η = number of modules, t = time.
Productivity estimation by means of demo-graphical analysis was done according to the equa-tion:
DWi = Σ Pi . Xi
and the variation of DWi = Pi
ni Si
b g
2⋅ 2∑
where: DWi = biomass production (dry weight), Pi = number of ramets (or leaves) lost per collection, Xi = dry weight (of leaves or ramets) average per collection, si = dry weight standard deviation per collection, ni = number of ramets (or leaves) sam-pled. The confidence interval of 95% for biomass production is equal to: CI95% = {DW
i – 2 [var(DWi)] ½;
DWi + 2 [var (DWi)]½}.
The data for density; physical, and chemical variables in the water; and the air temperature were correlated with the growth rates. Pearson’s corre-lation was used, except for the data without normal distribution, when Sperman’s correlation (rs) was used, following Siegel (1975).
On each sampling date the water temperature, electrical conductivity, and pH were determined. Total amount of phosphorus and nitrogen were evaluated according to the method of Murphy & Riley (1962) and Nessler (Greenberg et al., 1992), respectively. Monthly data for air temperature were obtained from the 5th Meteorological District, of the Ministry of Agriculture, Belo Horizonte, MG.
RESULTS
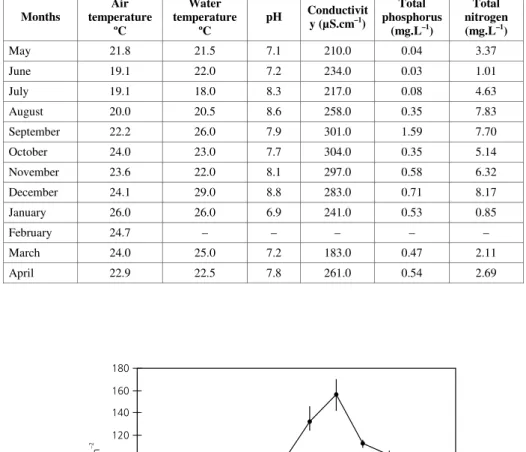
Meteorological, physical, and chemical variables
The period from June to August/1994 was caracterized by low values in average air tempe-rature; the highest values were registered from December/1994 to February/1995 (Table 1). Water temperature oscillated between 18.0ºC (July/1994) and 29.0ºC (December/1994). The
pH ranged from 6.9 (January/1994) to 8.8 (De-cember/1994) (Table 1). The electrical conductivity showed the highest values in the dry months, mainly in September and October of 1994 (301 µS.cm–1
and 304 µS.cm–1, respectively); the lowest value
was in March/1995 (183.7 µS.cm–1) (Table 1).
Total phosphorus concentration varied from 0.03 mg.l–1 (June/1994) to 1.59 mg.l–1 (September/1994),
with an average concentration of 0.48 mg.l–1 (SD ±
0.44) (Table 1). Total nitrogen concentration varied considerably throughout the experimental period. Average concentration was 4.47 mg.L–1 (SD ± 2.66)
for all sampled months (Table 1).
Density and biomass production
The lowest ramet density was registered in September/1994 with 65 ramets.m–2, and the highest
in December/1994, with 156 ramets.m–2 (Fig. 1).
After November/1994, all subdivisions of the nylon frame were completely occupied.
The study period was characterized by a phase of low biomass values, from May/1994 until No-vember/1994, and another of high biomass values, from December/1994 until June/1995. Total initial biomass was 96 g of DW.m–2. This value almost
doubled in a month, increasing to 167 g of DW.m–2.
It increased continuously until July/1994, and then declined until September/1994. Biomass growth reached 2027 g of DW.m–2 in January/95 (Table 2).
Production, calculated through the sum of the monthly biomass differences, was 20.6 t of DW.ha–1.year–1.
The highest growth rate was registered in Ja-nuary/1995, 22.17 g of DW.m–2.d–1. Negative values
for absolute growth rate were found in certain pe-riods, but the biggest loss was registered in March/ 1995, –5.58 g of DW.m–2.d–1 (Table1). Absolute
growth rates were positively correlated with the density of ramets (rs = 0.722, p < 0.01). Availability of nutrients (N and P) in the water and the water and air temperatures did not show significant corre-lation with absolute growth rates (p > 0.05).
The highest value of relative growth rate (0.033 g.g–1.d–1) was observed in the first 15 days of the
experiment (May until June/1994); after this there was a monthly reduction in relative growth. In August the relative growth rates were negative, bottoming out in September/1994 (–0.019 g.g–1.d–1). From
TABLE 1
Air temperature (mean), water temperature, pH, electrical conductivity, total phosphorus, and total nitrogen at the sampling station at Pampulha Reservoir, during the period from May/1994 to April/1995.
Months
Air temperature
ºC
Water temperature
ºC
pH Conductivit y (µS.cm–1)
Total phosphorus
(mg.L–1)
Total nitrogen (mg.L–1)
May 21.8 21.5 7.1 210.0 0.04 3.37
June 19.1 22.0 7.2 234.0 0.03 1.01
July 19.1 18.0 8.3 217.0 0.08 4.63
August 20.0 20.5 8.6 258.0 0.35 7.83
September 22.2 26.0 7.9 301.0 1.59 7.70
October 24.0 23.0 7.7 304.0 0.35 5.14
November 23.6 22.0 8.1 297.0 0.58 6.32
December 24.1 29.0 8.8 283.0 0.71 8.17
January 26.0 26.0 6.9 241.0 0.53 0.85
February 24.7 – – – – –
March 24.0 25.0 7.2 183.0 0.47 2.11
April 22.9 22.5 7.8 261.0 0.54 2.69
0 20 40 60 80 100 120 140 160 180
M J J A S O N D J F M A
Months (1994/1995)
Ramets.m
–2
Fig. 1 — Seasonal variation in density of ramets of Eichhornia crassipes (ramets.m–2) in Pampulha Reservoir; means and
TABLE 2
Mean biomass (the standard error for each mean is enclosed by parentheses), absolute growth rate (AGR), relative growth rate (RGR), demographic relative growth rate (DRGR) for E. crassipes at the sampling
station at Pampulha Reservoir, during the period from May/1994 to June/1995.
Methods
Traditional Demographic
Months Biomass
g DW.m–2
AGR (g.m–2.d–1)
RGR (g.g–1.d–1)
DRGR “ramets” . “ramet”.d–1
May 96.2 (12.5) – – –
June* 159.0 (27.9) 4.181 0,033 0.642
June* 174.4 (5.4) 1.027 0.006 0.011
July 189.0 (18.2) 0.976 0.005 0.002
August 169.6 (21.1) –0.647 –0.004 –0.002
September 97.2 (6.4) –2.413 –0.019 –0.004
October 186.5 (28.5) 2.976 0.022 0.012
November 402.9 (8.0) 7.213 0.026 –0.002
December 1101.5 (86.6) 20.887 0.031 0.009
January 2027.0 (83.0) 22.167 0.015 –0.003
March 1776.0 (59.3) –5.578 –0.003 –0.004
April 1635.0 (119.9) –3.134 –0.002 0.001
June 1538.2 (7.7) –2.150 –0.001 –
*Two samplings were performed in June, with an interval of 15 days in between.
Demographical approach
The highest ramet relative growth rate was registered in the first 15 days of observation (June/1994), with a growth of 0.043 ramets. ramet–1.day–1. After this there was a reduction
in growth rate, reaching negative values in August/1994 and September/1994 (DRGR = 0.002 ramets.ramets–1.day–1 and DRGR = –0.004
ramets.ramets–1.day–1, respectively). In October/
1994 the population grew at a rate of 0.012 ramets.ramets–1.day–1. It then suffered another
drop until increasing again in December/1994. January and March/1995 howed loss of ramets, i.e., negative values of DRGR; in April/1995 new ramet production began (DRGR = 0.001 ramets. ramets–1.day–1) (Table 2).
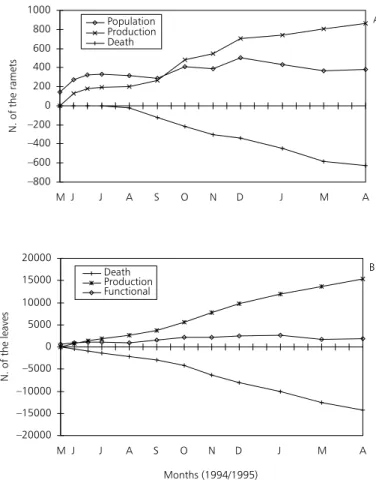
Fig. 2a shows the flow of ramets, starting with the 142 labeled ramets. After 330 days, they had produced 866 new ones. Of the total, 1028 ramets 609 died and 19 ramets were lost due to herbivore larvae of lepidoptera. The final population com-prised 380 ramets.
With this data and the monthly dry weight average per ramet, it was possible to estimate the
return of biomass to the aquatic system could be estimated according to the previous equation. On average, plants initially occupying 1 m2, were
respon-sible after 330 days for input of 6628 g (s2 = 248.42)
of dry mass into the aquatic system, CI95% = [5632;
7625] g of DW. In one year, the total input would have been 7331 g DW.
From the 142 initial ramets 15328 leaves were produced; of these 14193 died during the sampling period. The final ramet population included 1135 functional leaves (Fig. 2b). At the end of 330 days, through a natural process of senescence and leaf death, one square meter of plants was responsible for input of 12796 g of dry mass into the aquatic system, CI95% = [11504; 14088] g of DW; in one
year, this would amount to 14153 g of DW. Taking into consideration ramet and leaf loss, 1 m2 of plants loses 19423 g DW of its production
–800 –600 –400 –200 0 200 400 600 800 1000
M J J A S O N D J M A
Population Production Death
A
–20000 –15000 –10000 –5000 0 5000 10000 15000 20000
M J J A S O N D J M A
Months (1994/1995) Death
Production Functional
B
N.
of
the
ramets
N.
of
the
leaves
Fig. 2 — Flow of the ramets (A) and leaves (B) of E. crassipes starting with the 142 labeled ramets, from May/1994 to April/ 1995, at the sampling station at Pampulha Reservoir. The values of production and death of the ramets were cumulated. Each interval of the x axis corresponds to 15 days.
DISCUSSION
Abiotic factors
The highest growth rates of E. crassipes were observed in the hottest months of the study period. The low temperatures registered in June, July, and August/1994 and June/1995 may have negatively influenced the growth rate. In these months, average temperatures were below 20ºC, considered inadequate for growth of E. crassipes, which develops fully between 21 and 30ºC (Kawal & Grieco, 1983). Variation of the sub-surface level water column temperature probably did not restrict development of the water hyacinth, which withstands temperatures up to 34ºC (Penfound & Earle, 1948).
Nutrient concentrations at the Pampulha Re-servoir registered during this study are
1989). In eutrophic environments like the Pampulha Reservoir it is improbable that growth of this species could be restricted by lack of such nutrients.
Biomass production
The annual net productivity reflects the mon-thly variations in the absolute growth rate. Under natural conditions, the identification of factors that establish the monthly absolute growth rate is a hard task, since at each census one or another of the environmental factors can be the determinant agent of growth.
In the first months of observation, the positive values of this rate were the result of increased number of ramets (increase in density). This occur-red until all available area had been occupied. After this period, ramet average weight increase was the factor determining the high absolute growth rate values. At the end of the experiment, competition processes caused a productivity drop. The highest absolute growth rate of 22.17 g.m–2.d–1 is
com-parable to ones found in the literature, for example 20.0 g.m–2.d–1 (Center & Spencer, 1981).
The primary net productivity of 20.6 t of PS.ha–1.year–1, measured in this study, is in the
intermediate range when compared to the many values registered in the literature. Gaudet (1974), in a revision, showed that E. crassipes in tropi-cal regions exhibits a production that varies from 15 to 44 t of DW.ha–1.year–1.
Environmental interactions also determine relative growth rate variations. These reached their highest values in June/1994 and December/1994. In our study period, it was estimated that each ton of dry weight in the reservoir had a dry weight daily production around 32 kg. In five months, the re-lative growth rates were negative; in at least four of these (August and September/1994, March and April/1995), the excessive mortality in comparison with ramet production determined the negative values. In June/1995 the negative values, both for absolute and relative growth rates, possibly reflec-ted weight of the mature ramets. High density, besides generating high mortality, may also result in individual weight loss, since increased self-shading generates an increase in the ratio of res-piration to photosynthesis, and decreases net photosynthesis (Moore, 1977).
In clone plants there is a tendency to limit growth of lateral gems when the population is in high density. In E. crassipes this was observed in
relation to foliage cover increase. The population presents two phases of ramet production, a faster one before the closing up of the foliage cover, and a slower one following its closing (Geber et al., 1992). Light changes in quantity and quality, after going through foliage cover, and this affects the internal levels of giberilins, producing morphological changes in the leaves and reduction of ramet produc-tion rates (Methy & Roy, 1993). Richards (1982) observed that plants from the center of E. crassipes covers produce less ramets than those at the bor-ders, where ramet production is not supported under dense foliage cover. Density reduction occurs by loss of ramets (probably the youngest), and is a self-regulated mechanism (Center & Spencer, 1981). The production of reproductive branches also causes a drop in the ramet production rate, due to the involvement of two meristem types (Watson, 1984). In the present study, the density rise asso-ciated with space restriction, which caused in-creased shading, determined the ramet birth rate drop, since there were very few cases of flowering. Ramet flow in the population is determined by the vegetative propagation and mortality rates. Leaf turnover is determined by the senescence and leaf production rates. The sum of values represen-ting biomass loss through these two events is an estimate of net production.
Leaf production and mortality rates determined in this study do not indicate a clear pattern. The factors generating the leaf senescence and production rates could not be determined during the study pe-riod. In the field, a large group of variables act at the same time, affecting foliage dynamics.
The senescence rate for leaves and branches, besides being a genetic characteristic of a given species, is also a response to environmental stress determined by a wide range of environmental va-riables. The number of leaves formed by a plant and their longevity decline with density rise. This generates an increase in shading and leaves tend to die faster than those of the same age in favorable conditions of luminosity (White, 1979). Increase in density, when associated with damage provoked by herbivore insects, explains the foliage dynamics of E. crassipes. Under these circumstances, there is an increase of leaf production and mortality, raising the foliage turnover rates (Center & Van, 1989).
importance of foliage dynamics in determining net primary productivity. Moreover, the phosphorus release due to loss of leaf biomass by E. crassipes reached a maximum of 57 mg P-PO4 m–2.d–1, the
phosphorus regenerated from ramet reached 33 mg P-PO4 m–2.d–1. Decomposition of water hyacinth
biomass is not only a major source of phosphorus for reservoir biota, but also possibly the most important source of regenerated phosphorus during some periods of the year (Pinto-Coelho & Greco, 1999).
Comparison between the two sampling methods
Dickerman et al. (1986) highlight the diffe-rences between the sampling methods and the fre-quency of observation for estimating annual liquid production in Typha latifolia; they show the advan-tage of the use of “Allen’s curve”, a graphical me-thod that considers the number of plants, the average biomass, and the positive and negative modifications of these two parameters. The demographical ap-proach can be compared with this method, because it considers the same variables. The traditional method is static and a great part of biomass pro-duction is not estimated. The demographical method, however, encompasses the variations in production and death of vegetable modules, having the advan-tage of completely accounting for the growth dy-namic and clarifying the processes of initiation and turnover in plants of different sizes and different environments (Waller, 1986).
The comparison of liquid productivity between the two sampling methods used in this study does not seem favorable. In the traditional method, biomass changes are determined in a determined sampling area that remains constant (m2 or ha.),
whereas in the demographical approach the number of ramets and the occupied area suffer alterations simultaneously. Thus, in the first sampling, one hectare of E. crassipes produces 20.56 t of DW and, in the second, plants that originally occupied one hectare, at the end of a year would produce 232.94 t of DW, but would no longer be occupying one hectare. This difference indicates that more adequate methodologies must be developed and standardized, for the study of macrophytes in tro-pical environments.
Acknowledgments— We thank A. C. Rietzler for comments and language correction and J. P. Lemos Filho for helpful discussions. We are grateful to L. B. Gazire, L. A. Rocha, and G. Amorim for fieldwork assistance. Financial support was provided by the Ecology, Conservation, and Wildlife Program (UFMG) and CAPES.
REFERENCES
CENTER, T. B. & VAN, T. K., 1989, Alteration of water hya-cinth (Eichhornia crassipes (Mart) Solms) leaf dynamics and phytochemistry by insects reservoirage and plant den-sity. Aquat. Bot., 35: 181-195.
CENTER, T. D. & SPENCER, N. R., 1981, The phenology and growth of water hyacinth (Eichhornia crassipes
(Mart.) Solms) in a eutrophic north-central Florida lake.
Aquat. Bot., 10: 1-32.
DICKERMAN, J. A., STEWART, A. & WETZET, R. G., 1986, Estimates of net annual aboveground production: sen-sitivity to sampling frequency. Ecology, 67: 650-659. GAUDET, J. J., 1974, The normal role of vegetation in water.
In: D. S. Mitchell (ed.),Aquatic vegetation and its use and control. Unesco, Paris, pp. 24-37.
GEBER, M. A., WATSON, M. A. & FURNISH, R., 1992, Genetic differences in clonal demography in Eichhornia crassipes. J. Ecol., 80: 329-341.
GIANI, A., 1994, Limnology in Pampulha reservoir: some general observations with emphasis on the phytoplankton community. In: R. M. Pinto-Coelho, A. Giane & E. Von-Sperlin (eds.), Ecology and human impact on lakes and reservoirs in Minas Gerais with special reference to future development and management strategies. Belo Horizonte, pp. 141-150.
GOPAL, B., 1987, Water Hyacinth. Elsevier, Oxford, 471p. GREENBERG, A. E., CLESCERI, L. S. E. & EATON, A. D., 1992, Standard methods for the examination of water and wastewater. 18th ed., American Public Health Association,
Washington, pp. 4/75-4/91.
HOLM, L. G., WELDON, L. W. & BLACKBURN, R. D., 1969, Aquatic weeds. Science, 166: 699-709. KAWAL, H. & GRIECO, V. M., 1983, Utilização do aguapé
para tratamento de esgotos domésticos. Estabelecimento de critérios de dimensionamento de lagoas de aguapé e abordagem de alguns problemas operacionais. Rev. DAE, 135: 79-90.
MCGRAW, J. B. & GARBUTT, K., 1990, Demographic growth analysis. Ecology, 71: 1199-2004.
METHY, M. & ROY, J., 1993, Morphogenetic changes in-duced by a low red: far-red ration and their growth conse-quences in water hyacinth (Eichhornia crassipes). J. Exp. Bot., 44: 1275-1280.
MOORE, P. D., 1977, Restating the self-thinning rule.
MURPHY, J. & RILEY, J. P., 1962, A modified single so-lution method for the determination of phosphate in na-tural waters. Analytica Chimica Acta, 27: 31-36. NAS – National Academy of Sciences, 1981, Making aquatic
weeds useful: some perspectives for developing countries. 4th ed., NAS, Washington, 174p.
PENFOUND, W. T. & EARLE, T. T., 1948, The biology of the water hyacinth. Ecol. Monogr., 18: 447-472. PINTO-COELHO, R. M. & GRECO, M. K. B., 1999, The
contribution of water hyacinth (Eichhornia crassipes) and zooplankton to the internal cycling of phosphorus in the eutrophic Pampulha Reservoir, Brazil. Hydrobiologia, 411: 115-127.
RADFORD, P. J., 1967, Growth analysis formulae: their use and abuse. Crop. Science, 7: 171-175.
REDDY, K. R., AGAMI, M. & TUCKER, J. C., 1989. Influen-ce of nitrogen supply rates on growth and nutrient storage by water hyacinth (Eichhornia crassipes) plants. Aquat. Bot., 36: 33-43.
REDDY, K. R., AGAMI, M. & TUCKER, J. C., 1990, Influen-ce of phosphorus on growth and nutrient storage by water hyacinth (Eichhornia crassipes) plants. Aquat. Bot., 37: 355-365.
RICHARDS, J. H., 1982, Developmental potential of axil-lary buds of water hyacinth, Eichhornia crassipes
SOLMS (Pontederiaceae). Amer. J. Bot., 64: 615-622. SIEGEL, S., 1975, Estatística não-paramétrica (para as
ciências do comportamento). McGraw-Hill, São Paulo, 350p.
WALLER, D. M., 1986, The dynamics of growth and form.
In: M. J. Crawley (ed.), Plant ecology. Blackwell Sci-entific Publications, pp. 291-320.
WATSON, M. A., 1984, Developmental constraints: effect on population growth and patterns of resource allocation in a clonal plant. The Amer. Nat., 123: 411-426. WESTLAKE, D. J., 1965, Some basic data for investigations
of the productivity of aquatic macrophytes. Men. Inst. Ital. Idrobiol., 18: 229-248.