GLUT4 pro te in e xpre ssio n in o be se and
le an 1 2 -m o nth-o ld rats: insights fro m
diffe re nt type s o f data analysis
Departamento de Fisiologia e Biofísica,
Instituto de Ciências Biomédicas, Universidade de São Paulo, São Paulo, SP, Brasil
P.M. Seraphim, M.T. Nunes and U.F. Machado
Abstract
GLUT4 protein expression in white adipose tissue (WAT) and skeletal muscle (SM) was investigated in 2-month-old, 12-month-old sponta-neously obese or 12-month-old calorie-restricted lean Wistar rats, by considering different parameters of analysis, such as tissue and body weight, and total protein yield of the tissue. In WAT, a ~70% decrease was observed in plasma membrane and microsomal GLUT4 protein, expressed as µg protein or g tissue, in both 12-month-old obese and 12-month-old lean rats compared to 2-month-old rats. However, when plasma membrane and microsomal GLUT4 tissue contents were ex-pressed as g body weight, they were the same. In SM, GLUT4 protein content, expressed as µg protein, was similar in 2-month-old and 12-month-old obese rats, whereas it was reduced in 12-12-month-old obese rats, when expressed as g tissue or g body weight, which may play an important role in insulin resistance. Weight loss did not change the SM GLUT4 content. These results show that altered insulin sensitivity is accompanied by modulation of GLUT4 protein expression. However, the true role of WAT and SM GLUT4 contents in whole-body or tissue insulin sensitivity should be determined considering not only GLUT4 protein expression, but also the strong morphostructural changes in these tissues, which require different types of data analysis.
Co rre spo nde nce
U.F. Machado
Departamento de Fisiologia e Biofísica, ICB, USP Av. Prof. Lineu Prestes, 1524 05508-900 São Paulo, SP Brasil
Fax: + 55-11-818-7285 E-mail: ubiratan@ fisio.icb.usp.br
Research supported by FAPESP (No. 98/03514-3). P.M. Seraphim was the recipient of a CNPq fe llowship (No. 142190/97-7).
Received December 6, 2000 Accepted June 18, 2001
Ke y wo rds
·Insulin resistance ·O besity ·Weight loss ·GLUT4 protein
Intro ductio n
Obesity is a serious metabolic disorder whose prevalence has increased in the last 50 years. In general, obesity is accompanied by cardiovascular disease, hypertension, diabe-tes, and dyslipidemia, among other disor-ders, factors that increase the risk of mortal-ity and morbidmortal-ity (1). Since the report that a non-obese insulin-resistant population, re-ferred to as syndrome X, has the same risk
factors for obesity, it has been considered that insulin resistance plays a key role in the physiopathology of obesity (2).
stud-ies do not relate insulin sensitivity and GLUT4 gene expression to protein tissue content (5,7,8). Similarly, there are conflict-ing findconflict-ings about weight loss, which is known to improve insulin sensitivity in the whole body both in humans (9,10) and ro-dents (11), concerning the modulation of GLUT4 gene expression (10,12-14).
Obesity and weight loss promote strong morphostructural changes in insulin-sensi-tive tissues such as white adipose tissue (WAT) (13,15) and skeletal muscle (SM) (16). For example, in adipose tissue, obesity increases tissue mass and decreases the rela-tive total protein content, whereas weight loss acts inversely (13,15). On this basis, tissue GLUT4 protein, assessed by Western blotting, can be expressed as µg protein sub-jected to electrophoresis, by whole tissue or body, or even by g tissue or body weight, each related to a specific parameter such as GLUT4 gene expression, glucose uptake re-lated to whole tissue or body, or rere-lated to g tissue or body weight (13). Thus, GLUT4 protein expression in obesity and weight loss should be analyzed carefully with respect to reference parameters.
The aim of the present study was to in-vestigate the effect of obesity and weight loss on GLUT4 protein expression, and the possible role of tissue GLUT4 content in whole-body glucose utilization. Thus, we
studied in vivo insulin sensitivity by the
insu-lin tolerance test (ITT) and we determined GLUT4 protein in WAT and SM by Western blotting. Additionally, we evaluated GLUT4 protein concerning its relative and absolute tissue and body contents.
Mate rial and Me tho ds
Anim als
Male Wistar rats were individually caged
in an environment maintained at 23 ± 2o
C, on a 12:12-h light (6:00-18:00)-dark (18:00-6:00) cycle, and fed a standard rodent chow
diet (pelleted Nuvilab CR-1, Nuvital, Cu-ritiba, PR, Brazil). Animals were allowed free access to water and standard rodent chow until the age of 2 months or 12 months (obese) when they were used for the experi-ments. An additional group of 12-month-old lean rats was obtained by subjecting animals to energy restriction during the previous month of life. During this period, animals were fed daily, receiving half of the food ingested by 12-month-old obese rats, with a consequent ~20% weight loss.
All experiments were carried out on anes-thetized rats (40 mg/kg body weight pento-barbital sodium), and the rats were studied at noon after 6 h of food deprivation. The experimental protocol was approved by the Ethics Committee for Animal Research of the Institute of Biomedical Sciences, Uni-versity of São Paulo.
Intrave no us insulin to le rance te st
For estimation of in vivo insulin
sensitiv-ity, some animals from all groups were
sub-mitted to an intravenous (iv) ITT (0.75 U/kg
body weight) and samples for blood glucose determination were collected at 0 (basal), 4, 8, 12, 16, and 20 min after insulin injection. The ITT was performed through the jugular vein of anesthestized rats. Thereafter, the rate constant for plasma glucose disappearance (Kitt, %/min) was calculated from the linear regression of the glucose concentration values from 0 to 20 min of the test, as described (17).
Blo o d and tissue sampling
Sacrifice was performed under anesthe-sia. Blood samples were obtained from the inferior vena cava and the serum was
pre-pared and kept at -20oC for further analysis.
Periepididymal fat pad (WAT) and gastroc-nemius muscle (SM) were removed, imme-diately weighed, frozen in liquid nitrogen,
and stored at -70o
Me m brane pre paratio n
Three subcellular membrane fractions of WAT were prepared based on the method of Oka et al. (18) and modified as previously described (18,19). Briefly, the tissues were homogenized using a Polytron (Brinkmann Instruments, Westbury, NY, USA) for 30 s at
4o
C in 10 mmol/l Tris-HCl, 1 mmol/l EDTA, and 250 mmol/l sucrose buffer, pH 7.4, and
centrifuged at 3,000 g for 15 min. Fat
glob-ules were discarded, and the volume of su-pernatant, a fat-free extract (FFE) fraction, was measured. One milliliter of FFE was kept for analysis, and the rest was
centri-fuged at 12,000 g for 15 min. The pellet was
resuspended as a plasma membrane (PM) fraction in 1 ml of buffer. The supernatant
was also centrifuged at 28,000 g for 15 min,
the pellet was discarded and the supernatant
was centrifuged at 146,000 g for 75 min. The
final pellet was resuspended as a microsome (M) fraction in 1 ml buffer. SM was homog-enized in the same buffer, and centrifuged at
1,000 g for 10 min. The supernatant was
saved, the pellet was resuspended in 1/3 of the initial volume, and centrifuged again at
1,000 g for 10 min. The two supernatant
solutions were mixed and submitted to
cen-trifugation at 150,000 g for 75 min. The final
pellet was resuspended in 1 ml of buffer as a total membrane (TM) fraction (19).
We ste rn blo tting
Immunoblotting was carried out as previ-ously described (15). Briefly, equal amounts of membrane proteins were solubilized in Laemmlis sample buffer, subjected to SDS-PAGE (10%), and electrophoretically trans-ferred to nitrocellulose. After blocking with bovine serum albumin in PBS, the nitrocel-lulose membranes were incubated with an
anti-GLUT4 antiserum for 3 h at 37oC. This
antiserum has been successfully used for immunoblotting at 1:200 dilution (13,15,18-20). The membranes were then washed five
times, incubated with [125
I]-protein-A (Amer-sham Pharmacia Biotech, Little Chalfont, UK) for 2 h at room temperature, washed again, and exposed to X-ray film for 5 days. The autoradiographic blots were quantified
by densitometry (Image Master 1D®
, Phar-macia Biotech, Uppsala, Sweden) and the results are reported as arbitrary units (AU).
Analytical pro ce dure s
Serum samples were assayed for glucose by the glucose oxidase method (Analisa, Belo Horizonte, MG, Brazil), for insulin by RIA (Coat-A-Count, Diagnostic Products Co., Los Angeles, CA, USA), and for albu-min by bromocresol green staining (CELM, São Paulo, SP, Brazil). The total protein concentration of membrane samples was as-sayed by the method of Lowry et al. (21).
Adipo cyte analysis
Other animals were used to obtain freshly isolated adipocytes by the collagenase method, for microscopic analysis as previously de-scribed (18). Cell diameter was measured and volume was calculated by considering adipocytes to be spherical. One hundred cells from each rat (5 rats/group) were analyzed. The cell weight was obtained considering the density of triolein.
D ata analysis
content and considering the tissue weight (AU/g tissue) or the body weight [(AU/g body weight) x 100]. Cellular PM and M GLUT4 contents were obtained on the basis of cell number. These values were used to analyze both the PM GLUT4 content, ex-pressed as unit of cellular surface area (AU/
µm2
), and the translocation index [cell PM GLUT4/(cell PM GLUT4 + cell M GLUT4) x 100], and these data were also related to the insulinemia at the time of tissue removal. In SM, the total protein yield in the TM fraction was used to calculate the total tissue content of GLUT4 (AU) and the relative data were similarly obtained considering tis-sue and animal weights. Data were analyzed statistically by ANOVA followed by the
Stu-dent-Newman-Keuls post hoc test when
ap-propriate.
Re sults
The general characteristics of the ani-mals are shown in Table 1. The 1old obese rats were heavier than the 2-month-old control rats, and showed a higher Lees index (P<0.001), demonstrating the pres-ence of obesity. On the other hand, 12-month-old lean rats had an ~20% lower (P<0.001) body weight than 12-month-old obese rats, without a difference in Lees index. Although glycemia remained unchanged in all groups, insulinemia was over 100% higher (P<0.001) in 12-month-old obese rats, and loss of weight decreased (P<0.001) glycemia to that ob-served in the control group. The Kitt value was significantly lower in 12-month-old obese rats than in 2-month-old (P<0.01) and 12-month-old lean (P<0.05) rats. Serum al-bumin was similar among groups, indicating that the food restriction schedule did not promote undernutrition in 12-month-old lean animals.
Table 2 shows the tissue characteristics of the different animal groups. The periepi-didymal fat pad weight of 12-month-old obese rats was 10-fold (P<0.001) the value of 2-month-old rats, and the tissue weight relative to body weight was still 4-fold (P<0.001) the value of 2-month-old rats. The loss of weight reduced these values, although they were still higher than the 2-month values. The gastrocnemius weight of 12-month-old obese rats was fold (P<0.001) the value of 2-Table 1. Characteristics of 2-month-old, 12-month-old obese, and 12-month-old lean
rats.
2-month-old 12-month-old obese 12-month-old lean
Body w eight (g) 183.8 ± 5.1 419.9 ± 9.8* 343.0 ± 8.8*+
Lee’s index (x 100) 30.3 ± 0.2 31.0 ± 0.2* 30.4 ± 0.3
Serum glucose (mmol/l) 9.3 ± 0.6 10.1 ± 0.8 8.7 ± 0.5
Serum insulin (µg/l) 3.15 ± 0.40 7.20 ± 0.72* 3.85 ± 0.37+
Serum albumin (g/l) 2.65 ± 0.04 2.77 ± 0.08 2.52 ± 0.07
Kitt (% /min) 2.28 ± 0.15 1.49 ± 0.26* 2.63 ± 0.27+
Data are reported as mean ± SEM body w eight and Lee’s index for 14 to 17 rats, and serum glucose, insulin, albumin and Kitt (rate constant for plasma glucose disappear-ance during intravenous insulin tolerdisappear-ance test) for 8 to 16 rats. Lee’s index = body w eight (g) 1/3/nasoanal length (cm).
* P<0.05 compared to 2-month-old rats;
+P<0.05 compared to 12-month-old obese rats (ANOVA, Student-New man-Keuls post
hoc test).
Table 2. Characteristics of insulin-sensitive tissues of 2-month-old, 12-month-old obese, and 12-month old lean rats.
2-month-old 12-month-old 12-month-old
obese lean
Absolute w eight (g)
WAT 0.82 ± 0.07 8.21 ± 1.13* 4.36 ± 0.49*+
SM 1.02 ± 0.03 2.20 ± 0.03* 1.91 ± 0.05*+
Relative w eight (g/100 g body w eight)
WAT 0.44 ± 0.03 1.96 ± 0.27* 1.18 ± 0.11*+
SM 0.556 ± 0.008 0.525 ± 0.010 0.560 ± 0.012+
Adipocyte volume (µm3) x 10-3 38.8 ± 1.08 289.4 ± 33.1* 124.4 ± 23.7*+
Protein yield (mg/g tissue) WAT
PM 0.47 ± 0.05 0.18 ± 0.02* 0.23 ± 0.02*
M 0.37 ± 0.04 0.20 ± 0.03* 0.33 ± 0.07
SM 6.10 ± 0.50 3.30 ± 0.40* 3.30 ± 0.70*
Data are reported as mean ± SEM tissue w eight for 14 to 17 rats, protein yield for 5 to 12 rats, and adipocyte volume for 5 animals (100 cells per animal w ere measured). WAT, periepididymal w hite adipose tissue; SM , skeletal muscle (gastrocnemius); PM , plasma membrane; M , microsome.
* P<0.05 compared to 2-month-old rats;
+P<0.05 compared to 12-month-old obese rats (ANOVA, Student-New man-Keuls post
month-old rats, and this difference disap-peared when the relative tissue weight was analyzed. The loss of weight reduced (P<0.001) the absolute SM weight and increased (P<0.01) the relative SM weight. The cell volume of 12-month-old obese rats was more than seven times (P<0.001) the value of 2-month-old rats, and the loss of weight re-duced (P<0.001) the cell volume by 60%, although this value was still higher (P<0.05) than the value of 2-month-old rats. Finally, the total protein yield in the membrane frac-tions, expressed as mg protein/g tissue, is shown in Table 2. In general, these values were lower (P<0.05 to P<0.001) in 12-month-old obese rats, and the loss of weight in-creased (P<0.01) the protein yield only in the FFE of WAT.
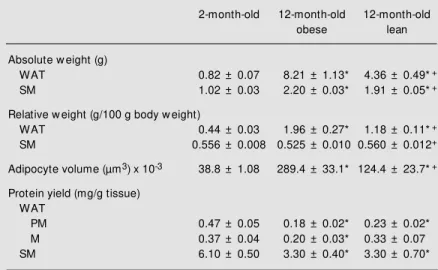
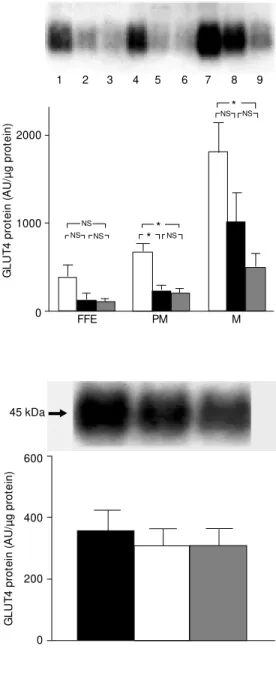
GLUT4 protein in WAT, expressed as µg total protein subjected to electrophoresis, is shown in Figure 1. Compared to 2-month-old control rats, in all membrane fractions, the blot densities were lower in both 12-month-old obese and 12-12-month-old lean rats. Compared to 2-month-old rats, GLUT4 in FFE was reduced (P<0.08) by 65 and 73% in 12-month-old obese and 12-month-old lean rats, respectively. Similarly, in the PM frac-tion GLUT4 was reduced (P<0.05) by 64 and 68% in month-old obese and 12-month-old lean rats, respectively, and in the M fraction, GLUT4 was reduced by 45% (P<0.09) in 12-month-old obese rats and by 72% (P<0.05) in 12-month-old lean rats com-pared to 2-month-old rats. On the other hand, the GLUT4 protein in SM (Figure 2), ex-pressed as µg total protein subjected to elec-trophoresis, was unchanged in all groups.
Different analyses of GLUT4 protein in WAT and SM are shown in Table 3. In WAT and SM, the total tissue GLUT4 content did not change among groups. However, the tissue GLUT4 protein content, expressed as g tissue weight, was reduced by ~80% (P<0.001) in WAT and by ~50% (P<0.05) in SM from 12-month-old obese rats compared to 2-month-old rats, and the loss of weight
Figure 1. GLUT4 protein content of fat-free extract (FFE), plasma membrane (PM ) and microsome (M ) fractions of w hite adipose tis-sue from 2-m onth-old (w hite bars), 12-month-old obese (black bars), and 12-m onth-old lean (gray bars) rats. Equal amounts of protein w ere subjected to electrophoresis and immunoblot-ted as described in M aterial and M ethods. Top, A typical autoradi-ogram is show n. Lanes 1 to 3, FFE; 4 to 6, PM ; 7 to 9, M ; 1, 4
and 7, 2-month-old rats; 2, 5 and
8, 12-month-old obese rats; 3, 6
and 9, 12-month-old lean rats.
Bottom, M ean ± SEM for 5 ani-mals processed in 5 different ex-periments. * P<0.05 for the sta-tistical comparisons indicated by the horizontal brackets (ANOVA, Student-New man-Keuls post hoc
test). AU, arbitrary units; NS, not significant.
Figure 2. GLUT4 protein content in total membrane fraction of skeletal gastrocnemius muscle from 2-month-old (black bar), 12-month-old obese (w hite bar), and 12-month-old lean (gray bar) rats. Equal amounts of protein w ere subjected to electrophore-sis and immunoblotted as de-scribed in M aterial and M ethods.
Top, A typical autoradiogram is show n. Bottom, M ean ± SEM for 7 animals processed in 7 dif-ferent experim ents. AU, arbi-trary units. There w ere no sig-nif icant dif f erences bet w een samples (ANOVA, StudentNew -man-Keuls post hoc test).
G
L
U
T
4
p
ro
te
in
(
A
U
/µ
g
p
ro
te
in
)
600
400
200
0 45 kDa
G
L
U
T
4
p
ro
te
in
(
A
U
/µ
g
p
ro
te
in
)
2000
1000
0 NS NS NS
NS NS
NS
1 2 3 4 5 6 7 8 9
*
FFE PM M
*
* did not significantly affect these contents, which remained lower than in 2-month-old rats. On the other hand, when expressed as g body weight, the GLUT4 protein content in SM was similarly reduced (P<0.05) in 12-month-old obese and 12-12-month-old lean com-pared to 2-month-old rats, while in WAT these data did not differ among groups.
How-ever, if we analyze PM GLUT4 expressed per unit of surface area relative to insulinemia at the time of tissue withdrawal, the value of 12-month-old obese rats was strongly re-duced (P<0.001) compared to 2-month-old rats and the weight loss increased (P<0.05) this parameter by 130%, although it remained lower (P<0.01) than the 2-month value. Fig-ure 3 also shows the translocation index of GLUT4 at the time of tissue withdrawal, obtained from the analysis of PM GLUT4 content related to PM + M GLUT4 content. Compared to 2-month-old rats, the index was 40% lower (P<0.05) in 12-month-old obese rats, and the loss of weight increased this value by 33%. Additionally, when re-lated to insulinemia, the weight loss pro-moted a 150% increase (P<0.05) in the trans-location index.
D iscussio n
Recently, 12-month-old rats have been considered to be a very important model of obesity since obesity gradually develops with aging as a consequence of food availability and a sedentary life style (11,22). This is similar to what is observed in humans, with some aged populations showing a very high prevalence of obesity (1). As rats continu-ously grow after maturity, obesity must be carefully analyzed in this model. The 12-month-old obese rats cannot be considered obese only because of their increased body weight. However, they were obviously obese, judging from the increased Lees index, heavier WAT, even relative to body weight, increased adipocyte volume, and reduced protein yield from WAT.
The energy restriction imposed on 12-month-old obese rats in the present study produced a 20% reduction in body mass, with changes in tissue weight showing loss of fat mass, as expected. However, the WAT relative weight and adipocyte volume of 12-month-old lean rats remained higher than the value of 2-month-old rats, indicating that the Table 3. GLUT4 protein content in w hite adipose tissue (WAT) and skeletal muscle
(SM ) of 2-month-old, 12-month-old obese, and 12-month-old lean rats.
2-month-old 12-month-old obese 12-month-old lean
White adipose tissue Total tissue GLUT4
PM 248 ± 28.4 424 ± 132 256 ± 69.7
M 522 ± 105 1090 ± 468 812 ± 263
GLUT4/g tissue
PM 311 ± 51.6 38.3 ± 12.9* 58.5 ± 17.2*
M 672 ± 179 164 ± 61.9* 186 ± 67.1*
GLUT4/g body w eight
PM 1.41 ± 0.17 1.03 ± 0.26 0.74 ± 0.17
M 3.04 ± 0.51 4.90 ± 2.15 2.36 ± 0.81
Skeletal muscle
Total tissue GLUT4 2103 ± 450 2074 ± 465 1995 ± 456
GLUT4/g tissue 2101 ± 440 978 ± 199* 1012 ± 252*
GLUT4/g body w eight 12.3 ± 2.8 4.9 ± 1.0* 6.2 ± 1.2*
GLUT4 protein w as determined in plasma membrane (PM ) and microsome (M ) fractions of WAT, and in the total membrane fraction of SM . The results are reported as total tissue content (AU), and relative content expressed as g tissue (AU/g tissue) and as g body w eight (AU/g body w eight x 100). Data are reported as mean ± SEM of 5-8 experiments.
* P<0.05 compared to 2-month-old rats (ANOVA, Student-New man-Keuls post hoc test).
Figure 3. GLUT4 content in plasma membrane (PM ) fraction of w hite adipose tissue from 2-month-old (w hite bars), 12-2-month-old obese (black bars), and 12-2-month-old lean (gray bars) rats. PM GLUT4 is expressed per unit of cell surface area (upper left panel) and PM GLUT4 per unit of cell surface area relative to insulinemia at the time of tissue w ithdraw al (upper right panel). The translocation index [total PM GLUT4/(total PM GLUT4 + total microsome GLUT4) x 100] is presented in the low er left panel and the translocation index relative to insulinemia at the time of tissue w ithdraw al is presented in the low er right panel. Data are reported as mean ± SEM for N = 5 animals. * P<0.05 for the statistical comparisons indicated by the horizontal brackets (ANOVA, Student-New man-Keuls post hoc test). NS = difference not statistically significant.
weight loss reduced obesity significantly but partially.
Hyperinsulinemia (23,24) and increased adipocyte volume (25) have already been described in 12-month-old obese Wistar rats, in which obesity has been pointed out as the main factor responsible for physiopathologi-cal changes, since the loss of weight can reverse most of these alterations. We have
previously observed abnormal response to iv
glucose tolerance test in 12-month-old obese rats compared to 2-month-old rats, despite hyperinsulinemia, and also an improvement
in the iv glucose tolerance test with a 20%
weight loss (11). In the present study, the ITT confirmed the insulin resistant condi-tion of 12-month-old obese rats as well as the improvement of the insulin sensitivity of 12-month-old lean rats. An inverse correla-tion between adipocyte volume and the abil-ity of insulin to stimulate glucose transport (26) and metabolism (27) has already been
reported, and amelioration of in vitro insulin
sensitivity by weight loss has also been de-scribed in adipocytes isolated from 12-month-old obese rats (26,27).
In the present study, a strong modulation in tissue GLUT4 protein content was de-tected in WAT and SM from 12-month-old obese rats, but the modulation changed ac-cording to the tissue and type of analysis.
In WAT, GLUT4 protein was reduced when determined per µg total protein loaded in the electrophoresis. The GLUT4 content of the PM and M fractions expressed as g tissue, as well as the PM GLUT4 expressed per unit of cell surface area, were also strongly reduced in 12-month-old obese rats, and this was definitely involved in the tissue/cell in-sulin resistance. Additionally, a reduction in the amount of GLUT4 translocated to PM was detected, and this amount, when related to the insulinemia, was reduced even more, suggesting that a damage in the translocation process may also be involved in cellular insulin resistance. In fact, studies of the insu-lin transduction signainsu-ling and the aging
pro-cess in Wistar rats showed a reduction in tissue content of insulin receptor substrate-1 (IRS-1), insulin receptor phosphorylation, phosphatidylinositol 3-kinase and IRS-1 as-sociation, and IRS-2 phosphorylation (28). On the other hand, the GLUT4 content ex-pressed as g body weight was not reduced and, consequently, the WAT may not play an important role in the reduced whole-body insulin resistance of obese rats. The reduced tissue/cell ability to take up glucose would be compensated for by the increased tissue
mass, and, thus, the in vivo glucose
clear-ance by WAT would be preserved.
Weight loss did not promote significant changes in GLUT4 protein content in WAT, suggesting no modulation in gene expression. However, both the PM GLUT4 content, ex-pressed per unit of cell surface area, and the translocation index increased in 12-month-old lean rats, when related to their insulinemia, which suggests that GLUT4 translocation to the PM was improved by the weight loss. Obviously, the translocation index does not support the notion that additional effects of insulin on GLUT4 translocation were improved in 12-month-old lean rats, but it clearly shows that in the fed state, during which the WAT was removed, and despite lower insulinemia, the density of GLUT4 in PM was significantly increased and may have been involved in the improvement of insulin sensitivity observed with the loss of weight.
was strongly reduced, indicating an important
role of this tissue in the in vivo insulin
resis-tance of 12-month-old obese rats. On the other hand, in SM of 12-month-old lean rats, the amount of transporter expressed as µg protein loaded in the electrophoresis, or relative to g tissue also did not change, and this is in accor-dance with the unchanged basal 3-O-methylglucose uptake evaluated as g muscle tissue in calorie-restricted rats (29). However, the amount of transporter relative to body weight was weakly increased (26%), a fact possibly involved in the improvement of glu-cose homeostasis in 12-month-old Wistar rats. Reduction in the GLUT4 content of insu-lin-sensitive tissues has been reported in sev-eral models of genetically (8,30-32) or phar-macologically (13,15,19,23,33) treated obese animals. A reduction in GLUT4 content was also reported in 20-month-old rats (34), but was considered to be related to the aging process. However, the true role of the GLUT4 contribution in tissue/whole-body glucose uti-lization has shown contradictory results. Here we are reporting that the reduced glucose up-take reported in 12-month-old obese rats (22,35), expressed as g tissue, involves a re-duction in the amount of GLUT4, expressed as g tissue in WAT and SM. However, since the fat mass strongly increased, the role of WAT
GLUT4 protein content in the in vivo glucose
clearance seems to be unimportant. Thus, SM
may play a key role in the in vivo insulin
resistance of 12-month-old obese rats. The present results show that the con-flicting reports concerning the role of GLUT4 in altered insulin-sensitivity may be the con-sequence of different types of analysis. Most studies on glucose uptake show the
whole-body uptake, expressed as m2 or kg (10,36,
37), or the tissue uptake, expressed as g tissue (7,36-39). These data cannot be re-lated to GLUT4 protein expressed as µg total protein subjected to electrophoresis (7,10,37-39), since strong morphostructural changes occurred, such as changes in total tissue protein yield or tissue and body mass.
Changes in the GLUT4 content induced by loss of weight have already been investigated in other animal models. In severely obese and insulin-resistant monosodium glutamate-treated mice, a 20% loss of weight induced by caloric restriction for one month reversed the insulin resistance and completely restored the GLUT4 content in all insulin-sensitive tissues (13). Differently, prolonged caloric restriction
(60% of ad libitum intake initiated at 14 weeks
of age) enhanced insulin stimulation of glu-cose transport in epitrochlear muscles of 8-month-old Fischer rats, regardless of un-changed GLUT4 content (35).
In the present study, weight loss increased insulin sensitivity possibly because of an increase in GLUT4 protein density in the plasma membrane from WAT, and of a weak increase in the total SM protein content in relation to body weight.
The present study shows that obesity and weight loss altered whole-body insulin sensi-tivity by means of a differential regulation of tissue GLUT4 protein content. In WAT, obe-sity decreased GLUT4 protein expression, but the total GLUT4 protein content relative to body weight remained preserved. Weight loss did not modify the total GLUT4 protein con-tent, but increased the transporter transloca-tion to the PM. In SM, although obesity did not change the GLUT4 protein expression, it re-duced the total tissue GLUT4 protein content relative to body weight, and the weight loss did not change the GLUT4 protein content. The present study clearly establishes that the true role of WAT and SM GLUT4 protein content in in vivo insulin sensitivity must be deter-mined considering the strong morphostructural changes of these tissues, in addition to gene expression modulation, which require differ-ent types of data analysis.
Ackno wle dgm e nts
Re fe re nce s
1. De Fronzo RA & Ferranini E (1991). Insulin resistance: a multifaceted syndrome re-sponsible for NIDDM , obesity, hyperten-sion, dyslipidemia, and atherosclerotic car-diovascular disease. Diabetes Care, 14: 173-194.
2. Haffner SM , Valdez RA, Hazuda HP, M itchell BD, M orales PA & Stern M P (1992). Prospective analysis of the insu-lin-resistance syndrome (syndrome X).
Diabetes, 41: 715-722.
3. Berger J, Bisw as C, Vicario PP, Strout HV, Saperstein R & Pilch PF (1989). Decreased expression of the insulin-responsive glu-cose transporter in diabetes and fasting.
Nature, 340: 70-72.
4. Kahn BB, Cushman SW & Flier JS (1989). Regulation of glucose transporter-specif-ic mRNA levels in rat adipose cells w ith fasting and refeeding. Journal of Clinical Investigation, 83: 199-204.
5. Klip A, Tsakiridis T, M arette A & Ortiz PA (1994). Regulation of expression of glu-cose transporters by gluglu-cose: a review of studies in vivo and in cell cultures. FASEB Journal, 8: 43-53.
6. Sivitz W, DeSautel SL, Kayano T, Bell GI & Pessin JE (1989). Regulation of glucose transporter messenger RNA in insulin-de-ficient states. Nature, 340: 72-74. 7. Houm ard JA, W eider M D, Dolan PL,
Leggett-Frazier N, Gavigan KE, Hickey M S, Tyndall GL, Zheng D, Alshami A & Dohm GL (1995). Skeletal muscle GLUT4 protein concentration and aging in hu-mans. Diabetes, 44: 555-560.
8. Kahn BB & Pedersen O (1992). Tissue-specific regulation of glucose transport-ers in different forms of obesity. Proceed-ings of the Society for Experimental Biol-ogy and M edicine, 200: 214-217. 9. Freidenberg GR, Reichart D, Olefsky JM
& Henry RR (1988). Reversibility of defec-tive adipocyte insulin receptor kinase ac-tivity. Effect of w eight loss. Journal of Clinical Investigation, 82: 1398-1406. 10. Friedman JE, Dohm GL, Leggett-Frazier
N, Elton CW, Tapscott EB, Pories WP & Caro JF (1992). Restoration of insulin re-sponsiveness in skeletal muscle of mor-bidly obese patients after w eight loss.
Journal of ClinicalInvestigation, 89: 701-705.
11. M achado UF, Nogueira CR & Carpinelli AR (1992). Obesity is the major cause of alterations in insulin secretion and calcium fluxes by isolated islets from aged rats.
Physiologyand Behavior, 52: 717-721. 12. Handberg A, Vaag A, Damsbo P,
Beck-Nielsen H & Vinten J (1990). Expression of insulin regulatable glucose transport-ers in skeletal muscle from type 2 (non-insulin-dependent) diabetic patients. Dia-betologia, 33: 625-627.
13. Papa PC, Seraphim PM & M achado UF (1997). Loss of w eight restores GLUT 4 content in insulin-sensitive tissues of monosodium glutamate-treated obese mice. International Journal of Obesity, 21: 1065-1070.
14. Pedersen O, Bak JF, Anderson PH, Lund S, M oller DE, Flier JF & Kahn BB (1990). Evidence against altered expression of GLUT1 or GLUT4 in skeletal muscle of patients w ith obesity or NIDDM . Diabe-tes, 39: 865-870.
15. M achado UF, Shimizu Y & Saito M (1993). Decreased glucose transporter (GLUT 4) content in insulin-sensitive tissues of obese aurothioglucose- and monosodium glutamate-treated mice. Hormone and M etabolic Research, 25: 462-465. 16. Gulve EA, Henriksen EJ, Rodnick KJ, Youn
JH & Holloszy JO (1993). Glucose trans-porters and glucose transport in skeletal muscles of 1- to 25-mo-old rats. American Journal of Physiology, 264: E319-E327. 17. Bonora E, M oghetti P, Zancanaro C,
Gigolini M , Querena M , Cacciatoni V, Corgnati A & M uggeo M (1989). Estima-tion of in vivo insulin action in man: com-parison of insulin tolerance test w ith eu-glycem ic and hypereu-glycem ic glucose clamp studies. Journal of Clinical Endocri-nology andM etabolism, 68: 374-378. 18. Oka Y, Asano T, Shibasaki Y, Kasuga M ,
Kanazaw a Y & Takaku F (1988). Studies w ith antipeptide antibody suggest the presence of at least tw o types of glucose transporter in rat brain and adipocyte.
Journal of Biological Chem istry, 263: 13432-13439.
19. M achado UF, Shimizu Y & Saito M (1994). Reduced content and preserved translo-cation of glucose transporter (GLUT 4) in w hite adipose tissue of obese mice. Phys-iology andBehavior, 55: 621-625. 20. Lima FB, M achado UF, Bartol I, Seraphim
PM , Sumida DH, M oraes SM F, Hell NS, Okamoto M M , Saad M JA, Carvalho CRO & Cipolla-Neto J (1998). Pinealectomy causes glucose intolerance and decreases adipose cell responsiveness to insulin in rats. American Journal of Physiology, 28: E934-E1041.
21. Low ry OH, Rosembrough NJ, Farr AL & Randal RJ (1951). Protein measurement w ith the Folin phenol reagent. Journal of
Biological Chemistry, 193: 265-275. 22. Ezaki O, Fukuda N & Itakura H (1990).
Role of tw o types of glucose transporters in enlarged adipocytes from aged obese rats. Diabetes, 39: 1543-1549.
23. Narimiya N, Azhar S, Dolkas CB, M ondon CE, Sims C, Wright DW & Reaven GM (1984). Insulin resistance in older rats.
American Journal of Physiology, 246: E397-E404.
24. Reaven EP & Reaven GM (1981). Struc-ture and function changes in the endo-crine pancreas of aging rats w ith prefer-ence to the modulating effects of exer-cise and caloric restriction. Journal of Clini-cal Investigation, 68: 75-84.
25. Zinder O, Arad R & Shapiro B (1967). Ef-fect of cell size on the metabolism of isolated fat cells. Israel Journalof M edical Sciences, 3: 787-791.
26. Hissin PJ, Foley JE, Wardzala LJ, Karnieli E, Simpson IA, Salans LB & Cushman SW (1982). M echanism of insulin-resistant glucose transport activity in the enlarged adipose cell of the aged, obese rat. Jour-nal of ClinicalInvestigation, 70: 780-790. 27. Salans LB & Dougherty JW (1971). The
effect of insulin upon glucose metabolism by adipose cells of different size -influence of cell lipid and protein content, age and nutritional state. Journal of Clini-cal Investigation, 50: 1399-1409. 28. Carvalho CRO, Brenelli SL, Silva AC,
Nunes AL, Velloso LA & Saad M J (1996). Effect of aging on insulin receptor, insulin receptor substrate-1, and phosphatidylin-ositol 3-kinase in liver and muscle of rats.
Endocrinology, 137: 151-159.
29. Dean DJ, Brozinick-Jr JT, Cushman JRSW & Cartee GD (1998). Calorie restriction increases cell surface GLUT-4 in insulin-stim ulated skeletal m uscle. Am erican Journal of Physiology, 275: E957-E964. 30. Hainault I, Guerre-M ilo M , Guichard C &
Lavau M (1991). Differential regulation of adipose tissue glucose transporters in ge-netic obesity (fatty rat). Journal ofClinical Investigation, 87: 1127-1131.
31. Koranyi L, James D, M ueckler M & Per-mutt M A (1990). Glucose transporter lev-els in spontaneously obese (db/db) insulin resistant mice. Journal of Clinical Investi-gation, 85: 962-967.
Gremeaux T, Tanti JF, Rochet N & Van Obbergen E (1990). Glucose transporter in insulin sensitive tissues of lean and obese mice. Effect of the thermogenic agent BRL 26830A. Endocrinology, 127: 2687-2695.
34. Lin JL, Asano T, Shibasaki Y, Tsukuda K, Katagiri H, Takaku F & Oka Y (1991). Al-tered expression of glucose transporter isoforms w ith aging in rats - selective de-crease in GLUT4 in the fat tissue and skeletal muscle. Diabetologia, 34: 477-482.
35. Cartee GD, Kietzke EW & Briggs-Tung C
(1994). Adaptation of muscle glucose transport w ith caloric restriction in adult, middle-aged, and old rats. American Jour-nal of Physiology, 266: R1443-R1447. 36. Escriva F, Agote M , Rubio E, M olero JC,
Pascual-Leone AM , Andrés A, Satrustegui J & Carrascosa JM (1997). In vivo insulin-dependent glucose uptake of specific tis-sues is decreased during aging of mature Wistar rats. Endocrinology, 138: 49-54. 37. Klip A & M arette A (1992). Acute and
chronic signals controlling glucose trans-port in skeletal muscle. Journal ofCellular Biochemistry, 48: 51-60.
38. Kraegen EW, Sow den JA, Halstead M B, Clark PW, Rodnick KJ, Chisholm DJ & James DE (1993). Glucose transporters and in vivo glucose uptake in skeletal and cardiac muscle: fasting, insulin stimula-t ion and im m unoisolastimula-t ion sstimula-t udies of GLUT1 and GLUT4. Biochemical Journal, 295: 287-293.