, v.60, n.2, p.205-209, Abr./Jun. 2003
SIMULATING WIND EFFECT ON MICROSPRINKLER
WATER DISTRIBUTION
Marco Antônio Fonseca Conceição1*; Rubens Duarte Coelho2
1
Embrapa Uva e Vinho - Estação Experimental de Jales - C.P. 241 - 15700-000 - Jales, SP - Brasil.
2
USP/ESALQ - Depto. de Engenharia Rural, C.P. 09 - 13418-900 - Piracicaba, SP - Brasil. *Corresponding author <[email protected]>
ABSTRACT: Wind incidence can affect microsprinkler water distribution. Evaluations of those conditions can be facilitated using simulations by computational models. The present work evaluates the performance of a ballistic model on simulating the wind effect on microsprinkler water distribution. Experimental tests were carried out using self-compensating microsprinklers, nozzle sizes 1.00 mm (gray), 1.10 mm (brown), 1.48 mm (orange), and 1.75 mm (yellow). The gray and brown nozzles used black swivels and the orange and yellow nozzles used blue swivels. The wind effect was artificially caused by fourteen 200 W fans. Computational simulations were realized using SIRIAS software, based on a ballistic model originally developed for sprinkler systems. The correlation coefficients (r) varied from 0.619 to 0.880, while the exactness coefficients (d) varied from 0.842 to 0.944. Swivels internal geometry influenced results. Tested models presented performances classified as very good for the black swivel nozzles and regular for the blue swivel nozzles.
Key words: irrigation, software
SIMULAÇÃO DO EFEITO DO VENTO NA DISTRIBUIÇÃO
DE ÁGUA EM MICROASPERSORES
RESUMO: A incidência de ventos pode afetar a distribuição da água aplicada por microaspersores. As avaliações nessas condições podem ser facilitadas empregando-se simulações através de modelos computacionais. No presente trabalho avaliou-se o desempenho de um modelo balístico para simular o efeito do vento na distribuição de água em microaspersores. Os ensaios experimentais foram realizados com emissores autocompensantes, com diâmetros de bocais iguais a 1,00 mm (cinza), 1,10 mm (marrom), 1,48 mm (laranja) e 1,75 mm (amarelo). Os bocais cinza e marrom operaram com rotor preto e os bocais laranja e amarelo utilizaram rotor azul. O efeito do vento foi provocado artificialmente empregando-se um conjunto de quatorze ventiladores de 200 W de potência. As simulações computacionais foram realizadas empregando-se o programa SIRIAS, que tem por base um modelo balístico originalmente desenvolvido para sistemas de aspersão convencional. Os coeficientes de correlação (r) variaram de 0,619 a 0,880, enquanto os coeficientes de exatidão (d) ficaram entre 0,842 e 0,944. As geometrias internas dos rotores influenciaram os resultados, sendo que o modelo apresentou um classificado como muito bom para os bocais com rotor preto e um desempenho regular para os bocais que trabalharam com rotor azul.
Palavras-chave: irrigação, programa computacional
INTRODUCTION
Wind occurrence can modify microsprinkler wa-ter distribution, affecting application uniformity and ef-ficiency (Alves et al., 1997; Dantas Neto et al., 1997; Medeiros et al., 2001). Water distribution evaluation takes time and, frequently, it is not possible to evaluate it at all operational and environmental conditions. The use of mathematical models for computational simulations al-lows for a more diversified and quick combination of the desired analysis.
Most of the sprinkler water distribution models used to describe drop trajectory under windy conditions are based on ballistic theory. Fukui et al. (1980) pre-sented a model to evaluate water application rate and
uniformity coefficient for irrigation systems in windy conditions, considering the overlapping of emitters wet-ted areas. Seginer et al. (1991) presenwet-ted a method to simulate sprinkler water distribution under windy con-dition introducing a K factor to correct the drag coeffi-cient employed in ballistic models. Similarity between simulated and measured values increased by using this factor.
, v.60, n.2, p.205-209, Abr./Jun. 2003
Microsprinkler irrigation presents operational and hydraulic characteristics similar to sprinkler irriga-tion. Therefore, simulation models developed for sprin-kler systems can be used for microsprinsprin-klers. The present study describes the performance of a ballistic model originally developed for sprinkler systems on the simulation of microsprinkler water distribution in windy conditions.
MATERIAL AND METHODS
Experimental evaluations took place in Piracicaba, SP, Brazil (22°42m’30’’S; 47°30m’00’’W). Self-compensating microsprinklers with swivels were tested, operating with nominal flows of 28 L h-1 (gray nozzle), 35 L h-1
(brown nozzle), 70 L h-1
(orange nozzle) and 95 L h-1
(yellow nozzle). Nozzle diameters were 1.00 mm, 1.10 mm, 1.48 mm and 1.75 mm, respectively. The gray and brown nozzles used a black swivel, that provided a smaller wet radius, while the others used a blue swivel, which wetted a larger area. The microprinkler was set at 0.38 m from the soil.
The emitter flows had been measured before each test using the volumetric method. The wind effect was artificially caused by fourteen, 200 W fans with 0.50 m of internal diameter, set in two overlayed rows of seven fans. The dispostion of the two rows aimed to force the air of the lower fan row to run over the microsprinkler in a parallel direction to the soil surface, as predicted by the model.
Water distribution was simulated by the use of the software “Simulación de Riego por Aspersión” (SIRIAS), developed by Carrión et al. (2001) on Delphi language for Windows 95, theoretically based on the ballistic model presented by Tarjuelo et al. (1994). The software required as input data the nozzle inclination angle from the horizontal, the operational pressure, the water distribution profile without wind, the environmen-tal conditions and the empirical coefficients K1 and K2, that were adjusted out of laboratory experimental val-ues. K1 and K2 coefficients were used to modify the spa-tial water distribution shape caused by the wind effect. Because of the use of pressure compensating microsprinklers, the operational pressures correspond-ing to the nominal flows were determined from pressure-flow curves, obtained without the pressure compensat-ing membrane.
Wind speed was determined using a portable, digital anemometer, with ten registered data at 0.38 m from the soil on each catch can point. The average speed registered on the microsprinkler distribution profile, paral-lel to the wind direction, was used as reference. Wind speed variation in relation to the vertical height was cal-culated by SIRIAS software using the Vories et al. (1987) model. Water distribution was determined using 0.085 m
diameter and 0.13 m height plastic catch cans, spaced 0.50 m x 0.50 m and occupying half of the microsprinkler‘s wetted area, parallel to the wind direction.
To determine the microsprinkler water distribu-tion profiles in no wind condidistribu-tions, the same plastic catch cans setting as used. The average of three water distri-bution profiles was used as the correspondent emitter pro-file. Catch can´s collected volumes were determined us-ing graduate recipient with 0.1 mL precision. Precipita-tion rates (Ip) were obtained dividing the collected vol-ume by catch can area.
Differences between measured and simulated val-ues were quantified by linear regression determination coefficients (R2) and angular coefficients, with curves forced to pass through the axis sistem‘s origin. A confi-dence coefficient (c) proposed by Camargo & Sentelhas (1997), corresponding to the multiplication of the corre-lation coefficient (r) by the exactness coefficient (d), was also used. The value of (d) can be calculated by the fol-lowing expression (Willmott et al., 1985, mentioned by Camargo & Sentelhas, 1997):
d = 1 – [Σ(Pi - Oi)2 / Σ(Pi - O+ Oi - O)2 ] (1)
where (Pi) are the simulated values, (Oi) are the measured values and (O) is the average of the measured values.
To evaluate data performance in relation to the confidence coefficient (c), a scale based on Camargo & Sentelhas (1997), with alterations, was used. The per-formance was classified as excellent for (c) values higher than 0.85; as very good for values between 0.76 and 0.85; as good for values between 0.66 and 0.75; as regular for values between 0.51 and 0.65; as bad for val-ues between 0.41 and 0.50; and as very bad for valval-ues lower than 0.40.
To compare the simulation results with those ob-tained by Tarjuelo et al. (1994) using sprinklers, the dif-ferences between measured and simulated values were also determined using the following expression used by the authors:
D = (S/N0)1/2 / (Q/A0) (2)
where (D) is the total difference between measured and simulated values; (S) is the sum of the square of the dif-ferences between simulated and measured values in each point; (No) is the number of wet points; Q is emitter to-tal flow; and Ao is the emitter wetted area under no wind condition.
RESULTS AND DISCUSSION
, v.60, n.2, p.205-209, Abr./Jun. 2003
equation 1 used in SIRIAS. Water was not collected in the catch cans at distances exceding 1.5 m from the microsprinkler in opposition to wind direction.
SIRIAS software calculated the evaporation and drift losses (EDL) using a multiple regression model de-veloped by the authors, obtaining EDL from air relative humidity, air temperature and wind speed. However, the model strongly underestimated EDL when comparing with experimental data, because the essays took place in different operational conditions in relation to the origi-nal conditions. As it was not possible to modify software’s EDL procedure, the experimental EDL values were used to run the simulations. Those values corresponded to 21.4%, 17.1%, 30.2% and 24.2% for gray, brown, orange and yellow nozzle, respectively.
Gray and brown nozzles EDL values are in the same level of the values registered by Alves et al. (1997), who obtained EDL varying from 12.1% to 21.2% for microsprinkler at 0.30 m from the soil surface and wind speed between 0.53 m s-1
and 2.58 m s-1
. However, blue swivel nozzles presented losses higher than those regis-tered by Alves et al. (1997).
Empirical K1 and K2 values were obtained from correlations between measured and simulated spatial wa-ter distribution data, selecting the K1 and K2 values that
Figure 1 - Relationship between measured and simulated precipitation rates (Ip) for different microsprinkler nozzles.
resulted in the highest determination coefficients (R2). After testing different combinations, the best (R2) values were obtained for K1 and K2 equal zero.
Because regression curves were forced to pass by the origin, the angular coefficients reflected the adjust-ment between measured and simulated values. The closer those coefficients were to 1.00, the better the adjustment of the model to experimental data. The highest determi-nation coefficients (R2) and angular coefficients were ob-served for nozzles which used black swivels (gray and brown) in comparison to those which used blue swivels (Figure 1).
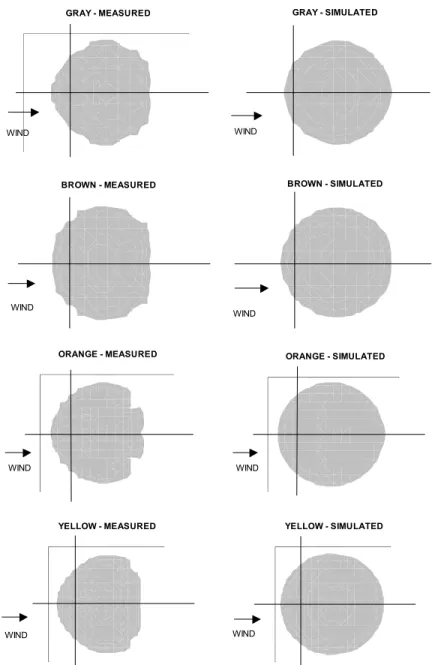
Measured water distribution in windy conditions presented abrupt ruptures in the four opposite sides, while the simulated distributions presented higher sym-metries and reached higher distances from the microsprinkler (Figure 2). The main reason for this be-havior is the fact that in the model, the wind speed does not vary with the distance while in the essays the wind speed presented a reduction proportional to the fan dis-tance, what produced the mentioned rupture. In those disrupted areas were observed many measured values equal zero with the respective simulated values differ-ent of zero, and that affected the regression model (Fig-ure 1).
BROWN
y = 0.9138x R2 = 0.77
0.0 0.5 1.0 1.5 2.0 2.5
0.0 1.0 2.0 3.0
Measured Ip (mm h-1)
Si
mu
lat
ed Ip
(mm
h
-1 )
GRAY
y = 0.871x R2 = 0.77
0.0 0.5 1.0 1.5 2.0 2.5
0.0 1.0 2.0 3.0
Measured Ip (mm h-1)
Si
mu
lat
ed
Ip
(mm
h
-1 )
ORANGE
y = 0.7354x R2 = 0.38
0.0 0.5 1.0 1.5 2.0 2.5
0.0 1.0 2.0 3.0 4.0
Measured Ip (mm h-1
)
Si
mu
lat
ed Ip
(mm
h
-1 )
YELLOW
y = 0.7149x R2 = 0.39
0.0 0.5 1.0 1.5 2.0 2.5 3.0 3.5 4.0
0.0 2.0 4.0 6.0
Measured Ip (mm h-1
)
Si
mu
lat
ed Ip
(mm
h
, v.60, n.2, p.205-209, Abr./Jun. 2003
The turbulent wind flux also was a differentiation factor between simulated and measured data. The math-ematical model considers that the wind direction is par-allel to the soil surface, what does not occur in experi-mental conditions, where exist vertical fluxes beside of the lateral fluxes. The circular shape of the simulated wa-ter distributions resulted from the use of K1 and K2 coef-ficients equal zero.
The exactness (d) and correlation (r) coefficients presented higher values for the black swivel nozzles (gray and brown) in comparison to the blue swivel nozzles (Table 1). Multiplying (d) by (r) results on confidence coefficient (c) that reflects the model performance. For black swivel nozzles the performances were classified as very good while for the blue swivel nozzles the perfor-mances were classified as regular (Table 1).
Those results accentuate the importance of swivel internal geometry on the simulations. This input variable was not considered by the model but directly affected its performance. It is necessary, therefore, to include this variable in the development of future swivel emitter mod-els.
Figure 2 - Measured and simulated precipitation rates (Ip) of spatial water distributions of different microsprinkler nozzles in windy condition.
Table 1 - Exactness (d), correlation (r) and confidence (c) coefficients and performance classification for different nozzles.
e l z z o
N d r c Performance
y a r
G 0.943 0.880 0.830 VeryGood
n w o r
B 0.944 0.880 0.831 VeryGood
e g n a r
O 0.849 0.619 0.525 Regular
w o l l e
Y 0.842 0.628 0.529 Regular
GRAY - SIMULATED
WIND
GRAY - MEASURED
WIND
BROWN - SIMULATED
WIND
BROWN - MEASURED
WIND
ORANGE - SIMULATED
WIND
ORANGE - MEASURED
WIND
YELLOW - SIMULATED
WIND
YELLOW - MEASURED
, v.60, n.2, p.205-209, Abr./Jun. 2003
The normalized differences values (D) between measured and simulated water distribution were 0.30, 0.31, 0.41 and 0.44 for gray, brown, orange and yellow nozzles, respectively. Tarjuelo et al. (1994), using the same model on evaluating sprinkler systems, found D val-ues between 0.32 and 0.63 for wind speed between 3.20 m s-1 and 5.75 m s-1. In such case, microsprinkler simu-lation presented analogous performance as the obtained by Tarjuelo et al. (1994) for sprinkler systems.
Tarjuelo et al. (1994) also used Christiansen uni-formity coefficient (CUC) to evaluate the simulation per-formance of the model on overlapping of sprinkler wet-ted areas. The differences between measured and simu-lated CUC values were always lower than 10%, what rep-resents a satisfactory performance. If microsprinkler D values were at the same magnitude of the sprinklers D values, it can be deduced that the differences of microsprinkler overlapping CUC values could be as low as the sprinkler data obtained by Tarjuelo et al. (1994).
The ballistic model of Tarjuelo et al. (1994) was specially developed to simulate CUC values to be used to study the overlapping of sprinkler water distribution in windy conditions. The adjusted model could be used, for instance, to determine the best space between sprin-klers which enables higher application uniformity in windy conditions. For this reason its performance is re-duced when it is used to evaluate water distribution by an isolated emitter.
ACKNOWLEDGMENT
To Dr. Jesús Montero Martinez for send us the SIRIAS software; and to Dr. Fátima Conceição Rezende and Dr. Wellington Farias Araújo for the suggestions and support on the experimental tests.
REFERENCES
ALVES, E.F.; LEÃO, M.C.S.; CASTRO, P.T. de. Qualidade de irrigação de um microaspersor em diferentes alturas de instalação e velocidade média de vento na região do Vale do Curu. (compact disc). In: CONGRESSO BRASILEIRO DE ENGENHARIA AGRÍCOLA, 26., Campina Grande, 1997. Anais. Campina Grande: SBEA, 1997.
CAMARGO, A P. de; SENTELHAS, P.C. Avaliação do desempenho de diferentes métodos de estimativa da evapotranspiração potencial no Estado de São Paulo, Brasil. Revista Brasileira de Agrometeorologia, v.5, p.89-97, 1997.
CARRIÓN, P.; TARJUELO, J.M.; MONTERO, J. SIRIAS: a simulation model for sprinkler irrigation. I. Description of the model. Irrigation Science, v.20, p.73-84, 2001.
DANTAS NETO, J.; MEDEIROS, M.G.A. de; AZEVEDO, C.A.V. de; AZEVEDO, H.M. de. Performance hidráulica e perfil de distribuição de água do microaspersor NAAN 7110, sob diferentes condições de vento. Revista Brasileira de Engenharia Agrícola e Ambiental, v.1, p.57-61, 1997.
FUKUI, Y.; NAKANISHI, K.; OKAMURA, S. Computer evaluation of sprinkler irrigation uniformity. Irrigation Science, v.2, p.23-32, 1980. MEDEIROS, M.G.A.; MATOS, J. de A.; AZEVEDO, C.A.V. de; DANTAS NETO, J. Influência de fatores climáticos na eficiência potencial de aplicação de água do microaspersor Naan 7110 em condições de campo. In: CONGRESSO BRASILEIRO DE ENGENHARIA AGRÍCOLA, 27., Lavras, 1998. Anais. Lavras: UFLA;SBEA, 2001. v.2, p.142-144. SEGINER, I.; NIR, D.; von BERNUTH, R. D. Simulation of wind-distorted
sprinkler patterns. Journal of Irrigation and Drainage Engineering, v.117, p.285-306, 1991.
TARJUELO J.M.; CARRION, P.; VALIENTE, M. Simulación de la distribución del riego por aspersión en condiciones de viento.
Investigación Agraria: Producción e Protección Vegetal, v.9, p.255-271, 1994.
VORIES, E. D.; von BERNUTH, R. D.; MICKELSON, R. H. Simulating sprinkler performance in wind. Journal of Irrigation and Drainage Engineering, v.113, p.119-130, 1987.