Applicability of the Global Lung Initiative
2012 Reference Values for Spirometry for
Longitudinal Data of Elderly Women
Anke Hüls1*, Ursula Krämer1, Sabine Stolz1, Frauke Hennig1, Barbara Hoffmann1,2, Katja Ickstadt3, Andrea Vierkötter1, Tamara Schikowski1
1IUF-Leibniz Research Institute for Environmental Medicine, Düsseldorf, Germany,2Medical Faculty, Deanery of Medicine, Heinrich-Heine University of Düsseldorf, Düsseldorf, Germany,3Faculty of Statistics, TU Dortmund University, Dortmund, Germany
Abstract
Background and Objectives
Lung function depends nonlinearly on age and height, so that the use of age and height spe-cific reference values is required. The widely used age and height spespe-cific GLI (Global Lung Initiative) z-scores derived from cross-sectional data, however, have not been proven for validity in an elderly population or for longitudinal data. Therefore, we aimed to test their validity in a population of elderly women followed prospectively for more than 20 years.
Methods
We used spirometric data (forced expiratory volume in 1 second (FEV1) and forced vital capacity (FVC) and FEV1/FVC) from the SALIA cohort of German women (baseline: 1985– 1994 (aged 55 years), follow-up: 2008/2009 and 2012/2013). We calculated GLI-z-scores for baseline and follow-up examination separately (cross-sectional evaluation) and individ-ual differences in z-scores between baseline and follow-up (longitudinal evaluation) for healthy never-smoking women.
Results
GLI reference values for FEV1, FVC and FEV1/FVC were cross-sectionally and longitudi-nally equivalent with our SALIA data. The mean change in z-scores between baseline and follow-up was 0.33 for FEV1, 0.38 for FVC and -0.10 for FEV1/FVC.
Conclusions
In conclusion, GLI z-scores fit cross-sectionally and longitudinally with FEV1, FVC and FEV1/FVC measured in women from Germany which indicates that they can be used in lon-gitudinal association analyses.
a11111
OPEN ACCESS
Citation:Hüls A, Krämer U, Stolz S, Hennig F, Hoffmann B, Ickstadt K, et al. (2016) Applicability of the Global Lung Initiative 2012 Reference Values for Spirometry for Longitudinal Data of Elderly Women. PLoS ONE 11(6): e0157569. doi:10.1371/journal. pone.0157569
Editor:Sanjay Haresh Chotirmall, Lee Kong Chian School of Medicine, SINGAPORE
Received:February 27, 2016
Accepted:June 1, 2016
Published:June 16, 2016
Copyright:© 2016 Hüls et al. This is an open access article distributed under the terms of theCreative Commons Attribution License, which permits unrestricted use, distribution, and reproduction in any medium, provided the original author and source are credited.
Data Availability Statement:The authors confirm that, for approved reasons, some access restrictions apply to the data underlying the findings. The informed consent given by SALIA study participants does not cover posting individual data in public databases. All data underlying the findings described in the manuscript are archived after publication. Data are available upon request from the SALIA Steering Committee ([email protected]).
Introduction
Lung function depends nonlinearly on age and height [1–3]. Therefore, age and height specific reference values should be used to account for these dependencies in epidemiological data analysis.
In 2012, the Global Lung Initiative (GLI) developed new multi-ethnic spirometric reference values for the age range 3 to 95 years [4]. The GLI reference values consider a nonlinear age-and a linear height-dependency of lung function. However, the cross-sectional fit of the GLI reference values for subjects aged>75 years is not clear [4], because most of the included data-sets consisted of children, adolescents or young adults and only few studies contributed to the derivation of reference values contained subjects above 75 years [5]. It is therefore necessary to investigate the validity of the GLI reference values for older populations.
In addition, the GLI reference values were derived from cross-sectional data and application on longitudinal data has not been evaluated. If a longitudinal validity is given, GLI reference values could provide a new option to make longitudinal change of lung function comparable between different age groups and thereby substantially enhance epidemiological analysis for respiratory risk factors. Furthermore, the use of reference values make it possible to evaluate whether the change of lung function deviates from the normal age-related decline in lung function.
We first aimed to analyse whether the newly developed GLI reference values fit cross-sec-tionally in a population of elderly women and compare their fit with older reference values. Secondly, we aimed to evaluate whether the GLI reference values can be used to describe longi-tudinal change in lung function. For the following analysis we used data from the SALIA study (Study on the influence of Air pollution on Lung function, Inflammation and Aging), a cohort of middle-aged women at baseline that was followed for more than 20 years [6].
Material and Methods
Study design and population
A detailed description of the study population including detailed information about the respi-ratory health has been published previously [6–9]. Briefly, the Caucasian SALIA cohort study was initiated in the early 1980s to investigate the health effects of air pollution exposure in women. The study population consists of women, living in the industrialized Ruhr area and in the rural Southern Muensterland in Germany. Baseline examinations were conducted between 1985 and 1994 including 2588 women with successful lung function testing (aged 55 years) (Fig 1). The follow-up examinations took place in 2008/2009 and in 2012/2013 [6,7]. The fol-lowing analysis included women who had at least one follow-up using the data for the one most remote from baseline. Furthermore the analysis was restricted to the healthy (no asthma or chronic bronchitis ever diagnosed regarding to the questionnaire answered by the partici-pants) never-smoking women (HNSW). In total, the cross-sectional evaluation of the GLI ref-erence values was restricted to 1726 women at baseline and 385 at follow-up. The longitudinal evaluation of the GLI reference values was based on the HNSW with lung function data at baseline and at least one follow-up (n = 299). Approval of the study was obtained from the Eth-ical Committee of the University of Bochum and the University of Düsseldorf. We received written informed consent from all participants [6].
Lung function measurement
Forced expiratory volume in 1 second (FEV1) and forced vital capacity (FVC) were measured
via spirometry. The values used in the analysis of this paper were all transformed to MasterScope
Environment of the state North Rhine-Westphalia (Düsseldorf, Germany), by the Federal Ministry of the Environment (Berlin, Germany); DGUV (German statutory accident assurance) VT 266.1, by the European Community’s Seventh Framework Program (FP7/2007-2011) under grant agreement number 211250, by the German Federal Ministry of Education and Research (BMBF) and by the Research Commission of the Medical Faculty of the Heinrich-Heine University of Düsseldorf (12/2011). The publication of this article was funded by the Open Access fund of the Leibniz Association.
Competing Interests:The authors have declared that no competing interests exist.
Jaeger spirometer values because most investigations were performed with that device (37.54% of the baseline investigations and 81.56% of the follow-up investigations). Detailed information on the transformation equations is available inS1 Methods.
All devices were calibrated prior to testing. The technical personnel were trained and all results were reviewed by a pulmonary physician. Maximal expiration was intensively encour-aged to achieve the best possible results, aiming for three technically acceptable spirometric manoeuvres in a maximum of nine trials. The best technically acceptable spirometric manoeu-vre according to the ATS (American Thoracic Society) / ERS (European Respiratory Society) recommendations [10,11] including visual control [12] was chosen for analysis.
Statistical methods
We first tested our data for a healthy survivor bias by comparing baseline lung function indices and baseline covariates of the HNSW lost to follow-up to baseline characteristics of the HNSW available at follow-up (two-sample t-test [13] and Fisher's exact test [14] at the 5% significance level).
To evaluate cross-sectional fit of the GLI reference values to the spirometric values of the HNSW we calculated the GLI-z-scores for baseline and follow-up examination. An absolute mean z-score>0.5 was set as cut point for relevant differences to the GLI reference population (expected mean: 0) [15–17]. For a good cross-sectional fit, the mean should be approximately zero (mean within the interval [-0.5, 0.5]) at the 5% significance level (tested with two one-sided tests (TOST) for equivalence [13,18–20]). Furthermore, standard deviation and percent-age below the lower limit of normal (LLN) were calculated.
In the HNSW with lung function measurements at baseline and follow-up examination the fit of the GLI reference values was graphically depicted and was additionally compared to the fit of the most common older reference values (NHANES III [21] and ECSC [22]).
Fig 1. The SALIA collective at baseline (1985–1994) and follow-up examination (2008/2009 and 2012/ 2013).
Longitudinal fit of the GLI reference values was analysed in the HNSW with lung function measurements at baseline and follow-up examination using the subjects’individual changes in lung function between baseline and follow-up (zf-zb). For a good longitudinal fit, these
differ-ences should be approximately zero (mean deviations within the interval [-0.5, 0.5]) at the 5% significance level (tested with the TOST for equivalence).
We performed three sensitivity analyses. In the first sensitivity analysis we evaluated cross-sectional fit of the GLI reference values in the HNSW who participated in the baseline and at least one follow-up examination. In a second sensitivity analysis we used a stricter definition of
“healthy”and excluded additionally participants with symptoms of chronic bronchitis (cough and phlegm for3 months of the year for2 years), chronic cough and chronic phlegm. Fur-thermore, in a third sensitivity analysis we reduced our study population to the HNSW who performed the spirometric measurement with MasterScope Jaeger to validate our findings.
More detailed information on the statistical methods is available inS1 Methods. All analyses were conducted using R 3.1.1 [23].
Results
Study population
Our study population consists of all HNSW with spirometric data at one or more examination times (baseline or at least one follow-up). The mean age was 54 years at baseline and 75 years at follow-up (Table 1). In an univariate analysis of the baseline characteristics, significant risk factors for a lost to follow-up were a high age and BMI, a low socio economic status, a low FEV1and a low FVC at baseline (Table 2).
Cross-sectional fit of GLI reference values
There were no relevant differences between the GLI reference population and our HNSW for the mean z-scores for FEV1, FVC and FEV1/FVC at baseline and follow-up and the standard
deviations were approximately one (Table 3andS1 Fig). Equivalence between the GLI refer-ence population and our HNSW was significant for all three lung function parameters at base-line and follow-up.
Table 1. Description of the study characteristics of the healthy never-smoking women (HNSW) at baseline and follow-up examination.
Baseline Follow-up
N 1726 385*
Age, mean (min-max) 54.46 (0.72) 75.47 (3.61)
BMI, mean (sd) 27.75 (4.69) 27.66 (4.39)
Socio economic status†, n (%)
Low socio economic status†
, n (%) 446 (25.84%) 62 (16.10%)
Medium socio economic status†
, n (%) 855 (49.54%) 191 (49.61%)
High socio economic status†
, n (%) 422 (24.45%) 130 (33.77%)
Passive smoking, n (%) 763 (44.21%) 77 (20.00%)
*: n = 222 from 2012/2013 and n = 163 from 2008/2009
†
:level of education asked at baseline
Longitudinal fit of GLI reference values
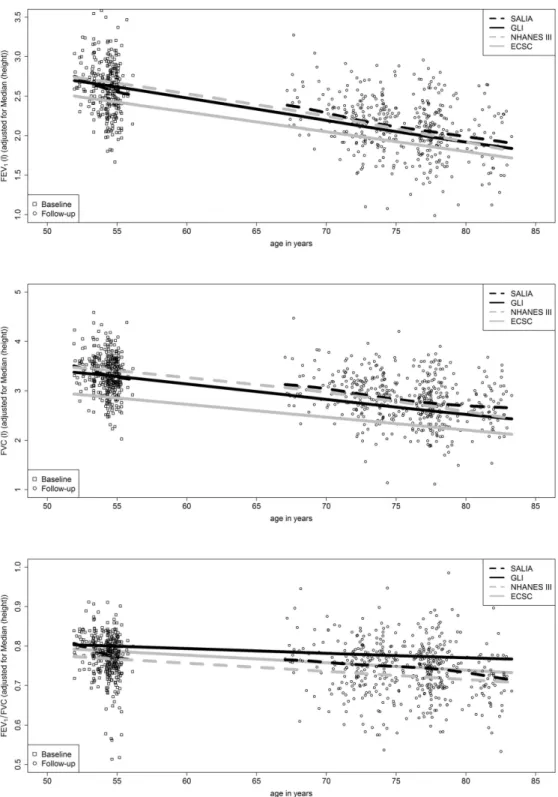
For our study population, the predicted means of the GLI reference values were approximately linear with age (Fig 2). The age-related slope of the predicted means of the GLI reference values fitted well to the mean slope of FEV1and FVC measured longitudinally in the HNSW over a
period of more than 20 years. Furthermore, all mean changes of z-scores differed less than 0.5 from zero (p<0.01) which means that the longitudinal fit was good (Table 4).
Table 2. Comparison of baseline characteristics of healthy never-smoking women (HNSW) lost to fol-low-up and available at folfol-low-up.Differences in the continuous variables were tested with the two-sample t-test and differences in the categorical variables were tested with Fisher’s exact test at the 5% significance level.
Baseline characteristics of those
Lost to follow-up* Available at follow-up p-value
N 1427 299
mean age (sd) 54.49 (0.70) 54.30 (0.80) <0.001†
mean BMI (sd) 27.97 (4.84) 26.69 (3.74) <0.001
Low socio economic status#, n (%) 397 (27.82%) 49 (16.39%) <0.001
Medium socio economic status#, n (%) 708 (49.61%) 147 (49.16%)
High socio economic status#, n (%) 321 (22.49%) 101 (33.78%)
Passive smoking, n (%) 644 (45.13%) 119 (39.80%) 0.095
mean z-score FEV1(sd) -0.46 (1.06) -0.11 (0.90) <0.001
%LLN z-score FEV1 12.89% 3.68%
mean z-score FVC (sd) -0.25 (0.99) 0.07 (0.81) <0.001
%LLN z-score FVC 7.29% 2.34%
mean z-score FEV1/FVC (sd) -0.41 (0.88) -0.35 (0.79) 0.301
%LLN z-score FEV1/FVC 8.13% 5.35%
*: 748 women died between baseline and 2008/2009 and 37 women died between 2008/2009 and 2012/ 2013
†
: only significant because all women entered the study population at the same age (extremely low sd)
#: level of education asked at baseline
doi:10.1371/journal.pone.0157569.t002
Table 3. GLI-based z-scores of all healthy never-smoking women (HNSW) grouped by time of examination (baseline and follow-up). Two one-sided tests for equivalence were performed to establish equivalence between the mean z-score of the GLI reference population and SALIA (p<0.05).
N Mean sd p-value* %LLN
Baseline
FEV1 1726 -0.40 1.04 <0.001 11.30
FVC 1724 -0.20 0.97 <0.001 6.50
FEV1/FVC 1722 -0.40 0.86 <0.001 7.67
Follow-up
FEV1 385 0.23 1.03 <0.001 2.86
FVC 385 0.41 0.99 0.047 2.08
FEV1/FVC 385 -0.39 0.84 0.006 7.01
FEV1: forced expiratory volume in 1 s; FVC: forced vital capacity; LLN: Lower Limit of Normal.
*: Two one-sided tests (TOST) for equivalence were performed to test on equivalence between the mean z-scores of the GLI reference population and SALIA. A goodfit was reached if the null-hypothesis of a mean z-score outside of the interval [-0.5, 0.5] was rejected at the 5% significance level (H0: zi−zj =
2[−0.5,0.5]).
Sensitivity analyses
In a first sensitivity analysis we reduced our study population to the HNSW with lung function available at baseline and follow-up and evaluated again the cross-sectional fit. In this analysis
Fig 2. Comparison of measured SALIA values (HNSW) for FEV1, FVC and FEV1/FVC with height-adjusted predicted means of the GLI reference values and older NHANES III and ECSC reference values (n = 299).
we received similar results as in the main analysis, but the fit was not significant for FVC and FEV1/FVC at follow-up examination (S1 Table).
In a second sensitivity analysis we used a stricter definition of“healthy”and excluded addi-tionally participants with symptoms of chronic bronchitis (cough and phlegm for3 months of the year for2 years), chronic cough and chronic phlegm. In this analysis we could confirm the cross-sectional and longitudinal fit of the GLI reference values (S2andS3Tables).
In a third sensitivity analysis we reduced our study population to the HNSW who per-formed the spirometric measurement with MasterScope Jaeger. In this analysis we received similar results as in the main analysis, but caused by the smaller study population the fit for FVC was not significant in the sectional analysis at follow-up examination. The cross-sectional fit for FEV1was better in this sub-sample leading to lower values for FEV1/FVC at
fol-low-up examination (S4 Table). The longitudinal fit was again confirmed for all lung function measurements (S5 Table).
Comparison with older reference values
The predicted GLI reference values for FEV1and FVC differed only slightly from the NHANES
III reference values [21] in level and slope (Fig 2). The slope of the predicted means of the ECSC reference values [22] was also similar to the slope of the predicted means of the GLI ref-erence values, but the ECSC refref-erence values for FEV1and FVC were lower than GLI and
NHANES III reference values and underestimated FEV1and FVC measured in our HNSW.
The level of the predicted means of GLI and NHANES III fitted well to the mean level of FEV1
and FVC measured in the HNSW with an even better fit for the NHANES III values. For FEV1/FVC the level of the predicted means of ECSC which lay between the level of GLI and
NHANES III fitted best to FEV1/FVC measured in the HNSW, whereas GLI slightly
overesti-mated FEV1/FVC.
Discussion
GLI reference values provide a good cross-sectional and longitudinal fit with FEV1, FVC and
FEV1/FVC measured over a period of more than 20 years in German women aged 52–83 years
and can be used in longitudinal association analyses.
Cross-sectional fit of GLI reference values
The GLI reference values for FEV1, FVC and FEV1/FVC provided a good cross-sectional fit in
the SALIA population for baseline and follow-up. A good cross-sectional fit of the GLI
Table 4. The longitudinal validity of the GLI reference values. Difference between z-scores at baseline and follow-up (zf−zb).Two one-sided tests for equivalence were performed to establish equivalence between the mean z-scores of the GLI reference population and SALIA.
Follow-up—baseline N Mean sd p-value*
FEV1 299 0.33 0.80 <0.001
FVC 299 0.38 0.81 0.005
FEV1/FVC 299 -0.10 0.84 <0.001
FEV1: forced expiratory volume in 1 s; FVC: forced vital capacity; LLN: Lower Limit of Normal.
*: Two one-sided tests (TOST) for equivalence were performed to test on equivalence between the mean deviations in z-scores of the GLI reference population and SALIA. A good longitudinalfit was reached if the null-hypothesis of the mean deviations in z-scores outside of the interval [-0.5, 0.5] was rejected at the 5% significance level (H0: zi−zj2=[−0.5,0.5]).
reference values was also determined by Hall et al. (2012) in 2066 Caucasian subjects aged 4–80 years from Australia and New Zealand [15] and by Backman et al. (2015) in 501 Cauca-sian subjects (244 women) aged 22–91 years from Sweden [24]. Contrary to those studies we focused especially on the fit in the elderly (67–83 years of age at follow-up) which was unsure according to Quanjer et al. (2012) [4] who developed the GLI reference equations. Our study showed that the GLI reference values for FEV1, FVC and FEV1/FVC were also applicable for
this age group. However, Miller et al. showed in their study of 592 Danes born in 1905 (428 females, mean age 93 years), that in a very elderly not selected population the GLI reference values might overestimate FEV1because the GLI reference values for this subgroup are based
on a select“supranormal”group of survivors who are functionally and cognitively inclined to participate [25]. In the SALIA study we also observed that the GLI reference values slightly overestimated FEV1at baseline, whereas the fit was almost perfect for the healthy
never-smok-ing participants who participated at baseline and follow-up investigation. This observation confirmed the findings of Miller et al. (2014) because our study population at baseline was less selected than at follow-up.
Longitudinal fit of GLI reference values
The GLI reference values for FEV1, FVC and FEV1/FVC provided a good fit in level and
age-related slope in our SALIA population and could consequently be used in a longitudinal analy-sis of the change in lung function over time.
Until now, the common opinion was that cross-sectional reference values are often not suit-able for longitudinal data because cross-sectional data might be affected by cohort effects [1,26,27]. As longitudinal values are measured in the same subjects (often from the same gener-ation) who are examined several times over a long time period there might be a difference to cross-sectional reference values which are measured in subjects from different generations. The majority of the GLI reference studies were carried out in the 90s [5] which is earlier than our follow-up examinations which were conducted in 2008/2009 and 2012/2013. Therefore the SALIA data are from a later cohort of people older than 70 years than those included in the ref-erence values. Due to improvements in living conditions and a further enhancement of the medical care, we assume that if there were cohort effects in the GLI reference values, the fol-low-up measurements of the SALIA study would be higher than predicted by the GLI. How-ever, the mean z-scores in this cohort increase only slightly with age.
Comparison with the older ECSC and NHANES III reference values
The ECSC reference values [22] for FEV1and FVC were much lower than GLI / NHANES III
reference values and did not fit to the SALIA participants, which is consistent with results from previous studies [24,28,29]. However, for FEV1/FVC the ECSC reference values fitted well with
our HNSW. This is in line with Kainu et al. (2015) who observed the same in their analysis of Finish adults (n = 1000, age: 18–83) [30].
The predicted means of the NHANES III reference values for FEV1and FVC [21] were very
similar to the predicted means of the GLI reference values which was already reported in Back-man et al. (2015) [24]. Furthermore, the match between the NHANES III reference values for FEV1and FVC and the healthy SALIA women was almost perfect. This is in line with Miller
et al. (2014) in which the NHANES III equations performed the best [25]. In contrast, in a pre-vious comparison study of 1302 healthy 20-80-year-old Germans the NHANES III reference values overestimated FVC [28]. However, since in that study 4.1% of the women had a lung function below the LLN for FEV1and 7.5% below the LLN for FVC, we consider this
The age-related slopes of both ECSC and NHANES III reference values were similar to the slope of the GLI reference values. Consequently, the NHANES III reference values can still be used for Caucasian women older than 52 years. However, for men or other age groups the dif-ferences between NHANES III and GLI reference values might be larger.
Strengths and limitations
Since research on lung function of subjects older than 75 years is limited, our SALIA study with a mean age of 75 years at follow-up provides important results on change in lung function in the elderly. Furthermore, to our knowledge this is the first study that indicates that the longi-tudinal change of lung function can be evaluated by using GLI-z-scores which offers a good opportunity for a standardized evaluation of longitudinal lung function data in clinical practice as well as in epidemiological research.
One limitation of the SALIA cohort is a selection towards healthy and surviving participants during the study duration of more than 20 years. Since respiratory health was a predictor for cardiovascular mortality in the SALIA cohort [31], we saw an increase of z-scores for FEV1and
FVC from baseline to follow-up examination in the cross-sectional analysis. However, lung function measured in this subset of healthy survivors fits to the GLI reference values for all examination times without relevant deviations. The reason might be that there is also a healthy survivor bias in the cross-sectional GLI reference data which is in line with Miller et al. (2014) who declared that the GLI reference values for the very elderly were based on a subset of
“supranormal”survivors [25]. Another limitation of our study is the use of different lung func-tion measurement devices and the weakness of the re-calibrafunc-tion equafunc-tions we used to control for that because our re-calibration equation used to make EasyOne-measurements comparable to Jaeger-measurements were derived from the data of only 28 subjects. However, since the EasyOne device was only used in 71 of the included follow-up investigations (18.44%) the pos-sible device related bias might not have a notable impact on our results.
Furthermore, the fairly high cut point of 0.5 for a relevant mean difference to the GLI refer-ence population which was suggested by the GLI and equates to a differrefer-ence of ~6% predicted [15] needs to be further evaluated for its relevance in clinical medicine as well as in epidemio-logical studies.
In conclusion, GLI reference values provide a good cross-sectional and longitudinal fit regarding FEV1, FVC and FEV1/FVC measured in elderly women from Germany over a time
period more than 20 years and can be used in longitudinal association analyses. However, a regular update of GLI reference values is necessary to avoid cohort effects in future analyses.
Supporting Information
S1 Fig. The cross-sectional validity of the GLI-z-scores for FEV1, FVC and FEV1/FVC for
the healthy never-smoking SALIA women (HNSW).
(PDF)
S1 Methods. Lung function measurement and statistical methods.
(PDF)
S1 Table. GLI-based z-scores of all healthy never-smoking women (HNSW) with available lung function measurements at baseline and follow-up grouped by time of examination.
Two one-sided tests for equivalence were performed to establish equivalence between the mean z-score of the GLI reference population and SALIA (p<0.05).
S2 Table. GLI-based z-scores of all healthy never-smoking women (HNSW) without
symp-toms of chronic bronchitis (cough and phlegm for3 months of the year for2 years),
chronic cough and chronic phlegm grouped by time of examination (baseline and follow-up).Two one-sided tests for equivalence were performed to establish equivalence between the mean z-score of the GLI reference population and SALIA (p<0.05).
(PDF)
S3 Table. The longitudinal validity of the GLI reference values of all healthy never-smoking
women (HNSW) without symptoms of chronic bronchitis (cough and phlegm for3
months of the year for2 years), chronic cough and chronic phlegm.Difference between
z-scores at baseline and follow-up (zf−zb). Two one-sided tests for equivalence were performed
to establish equivalence between the mean z-scores of the GLI reference population and SALIA.
(PDF)
S4 Table. GLI-based z-scores of all healthy never-smoking women (HNSW) who performed the spirometric measurement with MasterScope Jaeger grouped by time of examination (baseline and follow-up).Two one-sided tests for equivalence were performed to establish equivalence between the mean z-score of the GLI reference population and SALIA (p<0.05). (PDF)
S5 Table. The longitudinal validity of the GLI reference values of all healthy never-smoking women (HNSW) who performed the spirometric measurement with MasterScope Jaeger.
Difference between z-scores at baseline and follow-up (zf−zb). Two one-sided tests for
equiva-lence were performed to establish equivaequiva-lence between the mean z-scores of the GLI reference population and SALIA.
(PDF)
Acknowledgments
This work was supported by the Deutsche Forschungsgemeinschaft (DFG; HE-4510/2-1, KR 1938/3-1, LU 691/4-1), by the Ministry of the Environment of the state North Rhine-Westpha-lia (Düsseldorf, Germany), by the Federal Ministry of the Environment (Berlin, Germany); DGUV (German statutory accident assurance) VT 266.1, by the European Community’s Sev-enth Framework Program (FP7/2007-2011) under grant agreement number 211250, by the German Federal Ministry of Education and Research (BMBF) and by the Research Commis-sion of the Medical Faculty of the Heinrich-Heine University of Düsseldorf (12/2011). The publication of this article was funded by the Open Access fund of the Leibniz Association.
Author Contributions
Conceived and designed the experiments: AH UK. Analyzed the data: AH. Wrote the paper: AH. Reviewed and edited the manuscript: UK SS FH BH KI AV TS. Data management: SS. Sta-tistical advice: UK KI.
References
1. Burrows B, Lebowitz MD, Camilli AE, Knudson RJ. Longitudinal changes in forced expiratory volume in one second in adults. Methodologic considerations and findings in healthy nonsmokers. Am Rev Respir Dis. 1986; 133: 974–80. PMID:3717769
3. Ware J, Dockery D, Louis T, Xu X, Ferris B, Speizer F. Longitudinal and cross-sectional estimates of pulmonary function decline in never-smoking adults. Am J Epidemiol. 1990; 132: 685–700. PMID: 2403109
4. Quanjer PH, Stanojevic S, Cole TJ, Baur X, Hall GL, Culver BH, et al. Multi-ethnic reference values for spirometry for the 3-95-yr age range: the global lung function 2012 equations. Eur Respir J. 2012; 40: 1324–43. doi:10.1183/09031936.00080312PMID:22743675
5. Quanjer PH, Stocks J, Cole TJ, Hall GL, Stanojevic S. Influence of secular trends and sample size on reference equations for lung function tests. Eur Respir J. 2011; 37: 658–64. doi:10.1183/09031936. 00110010PMID:20817707
6. Schikowski T, Ranft U, Sugiri D, Vierkötter A, Brüning T, Harth V, et al. Decline in air pollution and change in prevalence in respiratory symptoms and chronic obstructive pulmonary disease in elderly women. Respir Res. 2010; 11: 113. doi:10.1186/1465-9921-11-113PMID:20727210
7. Vossoughi M, Schikowski T, Vierkötter A, Sugiri D, Hoffmann B, Teichert T, et al. Air pollution and sub-clinical airway inflammation in the SALIA cohort study. Immun Ageing. 2014; 11: 5. doi: 10.1186/1742-4933-11-5PMID:24645673
8. Adam M, Schikowski T, Carsin AE, Cai Y, Jacquemin B, Sanchez M, et al. Adult lung function and long-term air pollution exposure. ESCAPE: a multicentre cohort study and meta-analysis. Eur Respir J. 2015; 45: 38–50. doi:10.1183/09031936.00130014PMID:25193994
9. Schikowski T, Sugiri D, Ranft U, Gehring U, Heinrich J, Wichmann H-E, et al. Long-term air pollution exposure and living close to busy roads are associated with COPD in women. Respir Res. 2005; 6: 152. PMID:16372913
10. Society AT. ATS statement-Snowbird workshop on standardization of spirometry. Am Rev Respir Dis. 1979; 119: 831–8. PMID:453705
11. Miller MR, Hankinson J, Brusasco V, Burgos F, Casaburi R, Coates A, et al. Standardisation of spirom-etry. Eur Respir J. 2005; 26: 319–38. doi:10.1183/09031936.05.00034805PMID:16055882
12. Müller-Brandes C, Krämer U, Gappa M, Seitner-Sorge G, Hüls A, Von Berg A, et al. LUNOKID: Can numerical American Thoracic Society/European Respiratory Society quality criteria replace visual inspection of spirometry? Eur Respir J. 2014; 43: 1347–1356. doi:10.1183/09031936.00058813PMID: 24232698
13. Wellek S. Testing Statistical Hypotheses of Equivalence and Noninferiority. Second Edi. Crc Pr Inc; 2010.
14. Fisher RA. On the interpretation ofχ2 from contingency tables, and the calculation of P. J R Stat Soc. 1922; 85: 87–94.
15. Hall GL, Thompson BR, Stanojevic S, Abramson MJ, Beasley R, Coates A, et al. The Global Lung Ini-tiative 2012 reference values reflect contemporary Australasian spirometry. Respirology. 2012; 17: 1150–1. doi:10.1111/j.1440-1843.2012.02232.xPMID:22849658
16. Thompson BR, Stanojevic S, Abramson MJ, Beasley R, Coates A, Dent A, et al. The all-age spirometry reference ranges reflect contemporary Australasian spirometry. Respirology. 2011; 16: 912–7. doi:10. 1111/j.1440-1843.2011.01970.xPMID:21401802
17. Ben Saad H, El Attar MN, Hadj Mabrouk K, Ben Abdelaziz A, Abdelghani A, Bousarssar M, et al. The recent multi-ethnic global lung initiative 2012 (GLI2012) reference values don’t reflect contemporary adult's North African spirometry. Respir Med. 2013; 107: 2000–8. doi:10.1016/j.rmed.2013.10.015 PMID:24231283
18. Robinson AP, Froese RE. Model validation using equivalence tests. Ecol Modell. 2004; 176: 349–358.
19. Schuirmann DL. On hypothesis testing to determine if the mean of a normal distribution is contained in a known interval. Biometrics. 1981; 37: 617.
20. Westlake WJ. Response to T.B.L. Kirkwood: bioequivalence testing—a need to rethink. Biometrics. 1981; 37: 589–594.
21. Hankinson JL, Odencrantz JR, Fedan KB. Spirometric reference values from a sample of the general U.S. population. Am J Respir Crit Care Med. 1999; 159: 179–87. doi:10.1164/ajrccm.159.1.9712108 PMID:9872837
22. Quanjer PH, Tammeling GJ, Cotes JE, Pedersen OF, Peslin R, Yernault JC. Lung volumes and forced ventilatory flows. Report Working Party Standardization of Lung Function Tests, European Community for Steel and Coal. Official Statement of the European Respiratory Society. Eur Respir J. 1993; 16: 5–
40.
24. Backman H, Lindberg A, Sovijärvi A, Larsson K, Lundbäck B, Rönmark E. Evaluation of the global lung function initiative 2012 reference values for spirometry in a Swedish population sample. BMC Pulm Med. 2015; 15: 26. doi:10.1186/s12890-015-0022-2PMID:25887050
25. Miller MR, Thinggaard M, Christensen K, Pedersen OF, Sigsgaard T. Best lung function equations for the very elderly selected by survival analysis. Eur Respir J. 2014; 43: 1338–1346. doi:10.1183/ 09031936.00100313PMID:24488567
26. Louis TA, Robins J, Dockery DW, Spiro A, Ware JH. Explaining discrepancies between longitudinal and cross-sectional models. J Chronic Dis. 1986; 39: 831–839. PMID:3489727
27. Quanjer PH, Borsboom GJJM, Kivastik J, Merkus PJFM, Hankinson JL, Houthuijs D, et al. Cross-sec-tional and longitudinal spirometry in children and adolescents: interpretative strategies. Am J Respir Crit Care Med. 2008; 178: 1262–70. doi:10.1164/rccm.200805-700OCPMID:18931334
28. Koch B, Schäper C, Ewert R, Völzke H, Obst A, Friedrich N, et al. Lung function reference values in dif-ferent German populations. Respir Med. 2011; 105: 352–362. doi:10.1016/j.rmed.2010.10.014PMID: 21130637
29. Marsh S, Aldington S, Williams M V, Weatherall M, Robiony-Rogers D, Jones D, et al. Pulmonary func-tion testing in New Zealand: the use and importance of reference ranges. Respirology. 2007; 12: 367–
374. doi:10.1111/j.1440-1843.2007.01071.xPMID:17539840
30. Kainu A, Timonen KL, Toikka J, Qaiser B, Pitkäniemi J, Kotaniemi JT, et al. Reference values of spirom-etry for Finnish adults. Clin Physiol Funct Imaging. 2015; [Epub ahead of print]. doi:10.1111/cpf.12237