403
ABSTRACT: Objective: To test the Work Ability House model, verifying the hierarchy of proposed dimensions, among a group of hospital workers. Methods: A cohort study (2009–2011) was conducted with a sample of 599 workers from a hospital in the city of São Paulo. A questionnaire including sociodemographics, lifestyle and working conditions was used. The Brazilian versions of Job Stress Scale, Efort–Reward Imbalance, Work-Related Activities That May Contribute To Job-Related Pain and/or Injury, and the Work Ability Index (WAI) were also used. A hierarchical logistic regression analysis was performed: the independent variables were allocated into levels according to the dimensions of the theoretical model in order to evaluate the factors associated with work ability. Results: Variables associated with impairment of work ability in each dimension were as follows: (a) sociodemographics: age < 30 years (p = 0.20), (b) health: without report of occurrence of work injuries (p = 0.029), (c) professional competence: low educational level (p = 0.008), (d) values : intensiied in overcommitment (p < 0.001), and (e) work: intensiication of efort–reward imbalance (p = 0.009) and high demands (p = 0.040). Conclusion: The results conirmed the dimensions proposed for the Work Ability House model, indicating that it is valid as a representation of a multidimensional construct of multifactorial determination and can be used in the management of work ability.
Keywords: Work capacity evaluation. Occupational health. Workers. Workload. Work environment. Health personnel.
Testing the “Work Ability
House” Model in hospital workers
Testando o Modelo da Casa da Capacidade
para o Trabalho entre proissionais do setor hospitalar
Maria Carmen MartinezI, Maria do Rosário Dias de Oliveira LatorreII, Frida Marina FischerI ORIGINAL ARTICLE / ARTIGO ORIGINAL
IDepartment of Environmental Health, School of Public Health, Universidade de São Paulo – São Paulo (SP), Brazil. IIDepartment of Epidemiology, School of Public Health, Universidade de São Paulo – São Paulo (SP), Brazil.
Corresponding author: Maria Carmen Martinez. Department of Environmental Health, School of Public Health, Universidade de São Paulo. Avenida Doutor Arnaldo, 715, CEP: 01246-904, São Paulo, SP, Brasil. E-mail: [email protected]
INTRODUCTION
The concept of work ability (WA) concerns the ability of the worker to perform his/her tasks at work. It is conditioned by the work demands, health status, and physical and men-tal abilities1-3. WA is considered to be a measurement of functional aging1-3, and it is seen as an index for the health of the worker2,4. This concept has been expanding based on the centrality of health for models that integrate aspects related to health, well-being, and mac-rosocial environment2,4,5.
Theoretical models have been proposed to explain the process to determine WA and/or the dimensions associated with this construct, such as the one based on the Stress– Strain Model or the Tetraedric Model4.
Among these models, the multidimensional Work Ability House stands out. It consid-ers that the WA depends on the balance between individual resources, work-related fac-tors, and the macrosocial environment2,4,5. The model is expressed by a four-loor House and a roof inserted in an encircling environment. The individual resources comprise the dimensions represented in the three lower loors. The irst loor represents the base that supports the building and concerns health status and functional capacity, including physical, mental, and social aspects. The second loor relates to professional competence (knowledge and skills, training and learning at work) and its continuous development used to meet the demands of working life. The third loor represents the internal aspects
RESUMO: Objetivo: Testar o Modelo da Casa da Capacidade para o Trabalho, veriicando a hierarquia das dimensões propostas para um grupo de trabalhadores do setor hospitalar. Métodos: Estudo de coorte (2009–2011) conduzido com 599 trabalhadores de um hospital na cidade de São Paulo. Foi usado um formulário com questões sobre dados sociodemográicos, estilo de vida e condições de trabalho, e as versões brasileiras da Escala Estresse no Trabalho, Desequilíbrio Esforço-Recompensa, Work-Related Activities That May Contribute To Job-Related Pain and/or Injury e Índice de Capacidade para o Trabalho (ICT). Foi realizada análise de regressão logística hierárquica: as variáveis independentes foram alocadas em níveis de acordo com as dimensões do modelo teórico para avaliar os fatores associados ao comprometimento da capacidade para o trabalho (CT). Resultados: As variáveis associadas ao comprometimento da CT em cada dimensão foram: (a) dimensão sociodemográica: idade < 30 anos (p = 0,20), (b) dimensão saúde: história de acidente de trabalho (p = 0,029), (c) dimensão competência proissional: baixo nível educacional (p = 0,008), (d) dimensão valores: intensiicação do excesso de comprometimento (< 0,001), e (e) dimensão trabalho: intensiicação do desequilíbrio esforço-recompensa (p = 0,009) e das demandas elevadas (p = 0,040). Conclusão: Os resultados do estudo conirmaram as dimensões propostas para o Modelo da Casa da Capacidade para o Trabalho, indicando que ele é válido como representação de um construto multidimensional de determinação multicausal, podendo ser utilizado na gestão da CT.
405
of the individual, manifested as values, attitudes, and motivation. These aspects can be afected by the external environment, that is, by the relationship between work, society, and personal life. The last loor represents factors related to work such as work condi-tions, demands and content, organization and communitarian environment, manage-ment and supervision: this is the “heaviest” loor in the building and can afect the other dimensions, which also support it. The WA is also inluenced by the surroundings of the macrosocial environment, which includes matters related to public and social policies, health care and occupational safety, and in special, the structure and support of family and community. The roof of this building is the WA, resulting from the interaction and balance between the previous dimensions2,4,5.
This model has been assessed by a number of international studies6,7. In Brazil, analyses about WA have been conducted since the 1990s, using the Work Ability Index (WAI) as the research instrument3; however, there are only a few national studies testing the theoretical model under discussion. Considering these matters, this study aimed at testing the theo-retical Work Ability House model, verifying the hierarchy of the proposed dimensions for a group of workers in the hospital sector of the city of São Paulo.
METHODS
This is a two-year follow-up longitudinal study (2009 to 2011) carried out in a private high complexity hospital in the city of São Paulo, Brazil. In 2009, all active workers were invited to participate in the study. This occupational group was chosen because hospital work is characterized by relevant physical and mental demands, which are associated with negative outcomes for the worker, such as WA impairment8-10.
The adherence rate was 87.9% (1,226 people). Among them, 599 workers (48.5%) partic-ipated in 2011, and most of them were from the Nursing (51.8%) and Hospitality sectors – hygiene, gastronomy, and patients’ admission (18.5%). The main causes of losses were dis-missals (54.7%) and not answering the questionnaire (39.7%).
Participants difered from nonparticipants in terms of the following factors: gender (57.2% of women versus 40.9% of men, p < 0.001), work sector (greater losses in the administrative sectors of Planning and Commercial, respectively, with 87.1 and 81.6% of losses, respectively, p < 0.001), age (participants mean age 35,7 years, SD = 8.3 years versus losses 34.6 years, SD = 8.9 years, p = 0.022), and working time (years) in the stu-died hospital (participants 6.1 years, SD = 6.5 years versus losses with 4.8 years, SD = 5.8 years, p < 0.001).
Imbalance (ERI) questionnaire12, whose variables (efort, reward, and overcommitment) also evaluate other psychosocial work stressors. The fourth part was the questionnaire of Work-Related Activities that May Contribute to Job-Related Pain and/or Injury (WRAPI)13. The last part was the Work Ability Index (WAI)1,3, used to measure the variable of inter-est in this study – WA. All quinter-estionnaires were validated to Brazilian Portuguese and are being used in current use.1,3,11-13.
The results of Cronbach’s alpha to assess the reliability of questionnaires in the beginning of the follow-up were: WAI = 0.69; demand = 0.69; control = 0.57; social sup-port = 0.82; effort = 0.74; reward = 0.83; overcommitment = 0.75; and WRAPI = 0.92. Considering the complexity of the phenomena to be assessed and their importance to understand the analyzed construct8, we chose to maintain the dimensions that pre-sented alpha < 0.70.
The study variables were selected and placed in groups according to the dimensions (or loors) of the Work Ability House model:
• sociodemographics features: sex, age, marital status, family income and responsibility for underage children;
• health and functional capacity: alcohol consumption, smoking, nutritional status (based on body mass index), practice of regular physical activity, and recent work injury;
• professional competence: age at the time of joining the workforce, working time at the studied hospital, years in the profession, and position;
• values: overcommitment (6 to 24 points);
• work-related characteristics – work sector, work shift, working hours (adding those in the hospital, a second job, and domestic chores), work violence (7 to 21 points), demands at work (5 to 20 points), control at work (6 to 24 points), social support at work (6 to 24 points), ERI (0.17 to 5.00 points), and WRAPI (0 to 150 points); • work ability – WAI, with a score of 7 to 49 points.
The independent variables were measured in the beginning of follow-up (2009). The exception included the variables regarding work stressors and WAI, assessed in the beginning and in the end of the follow-up. For each one of these variables, the diference between the initial and inal scores was calculated, and a new variable was provided, cat-egorized into “no changes,” “aggravation,” or “improvement”. These variables were then dichotomized for the logistic modeling. Cutof points were analyzed according to the distribution of frequencies, as to the best of our knowledge we did not ind references in the literature.
407
conducted step by step. Gender was maintained as a control variable. The risk measure-ment was the odds ratio (OR), and in all analyses, the associations were considered to be signiicant when p < 0.05.
The research project was approved by the Research Ethics Committee of the School of Public Health, Universidade de São Paulo, protocol n. 257.518. The project was in agree-ment with the principles of the Declaration of Helsinki, established by the World Medical Association (WMA). The participation in in this study was voluntary. Workers signed an informed consent form. Individual results were kept conidential.
RESULTS
In 2009, the mean score of the WAI was 43.0 points (SD = 4.0); in 2011, it was 42.5 points (SD = 4.7). The change in WAI score since the beginning to the end of the follow-up was, in average, of -0.5 points (SD = 4.6), representing a slight impairment.
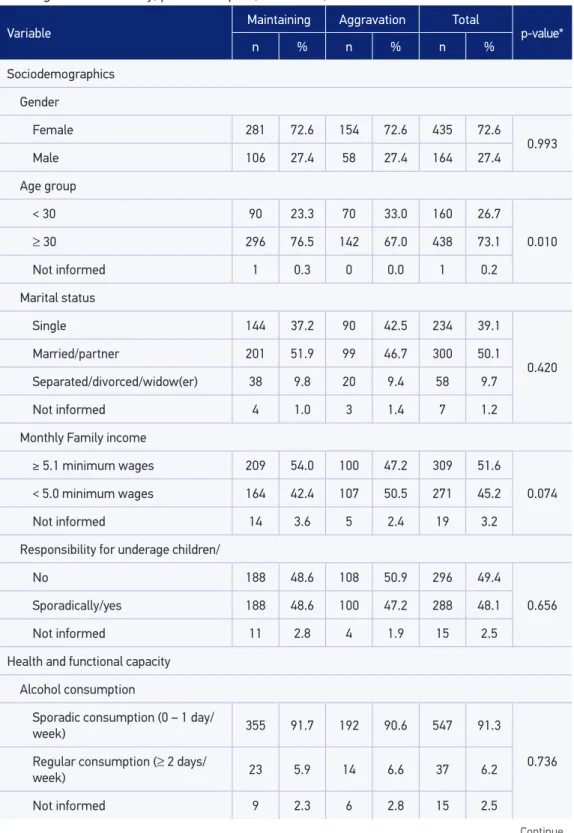
Table 1 shows the descriptive analysis of the variables representing the sociodemo-graphic characteristics, and dimensions of health and professional skills. The highest pro-portions of participants were women (72.6%), married people/or living with a partner (50.1%), and monthly family income higher than 5 minimum wages (51.6%). The mean age was 36.7 years (SD = 8.3), and 73.1% of them were older than 30 years (73.1%). Regarding health, 91.3% of them reported sporadic alcohol consumption, 90.8% were non-smokers, 54.9% were eutrophic, 36.9% reported the regular practice of physical activities, and most denied recent occurrence of workplace injury (88.1%). For the variables representing pro-fessional competence, 94.2% had at least incomplete high school,and 69.8% were in the cur-rent profession in the past 6 years. The highest proportions were of Nursing Technicians (29.2%), Specialized Administrative staf (17.0%), Registered Nurses (16.9%), and General Assistants, all working in diferent sectors (15.0%).
Table 2 presents the variables representing the dimensions of values and work. During follow-up, 31.4% of the workers reported aggravation in overcommitment. In the begin-ning of the follow-up (2009), the mean of overcommitment was 12.3 points (SD = 3.1), in a score ranging from 6.0 to 24.0 points. Table 2 shows that participants were working mainly in the Nursing Service (51.8%) and Hospitality Sectors (18.5%). The distribution regard-ing work shift was relatively homogeneous; 64.8% of the workers did not consider beregard-ing exposed to circumstances of workplace violence, and 41.7% denied changes in the weekly work load throughout the studied period.
Variable
Maintaining Aggravation Total
p-value*
n % n % n %
Sociodemographics
Gender
Female 281 72.6 154 72.6 435 72.6
0.993
Male 106 27.4 58 27.4 164 27.4
Age group
< 30 90 23.3 70 33.0 160 26.7
0.010
≥ 30 296 76.5 142 67.0 438 73.1
Not informed 1 0.3 0 0.0 1 0.2
Marital status
Single 144 37.2 90 42.5 234 39.1
0.420 Married/partner 201 51.9 99 46.7 300 50.1
Separated/divorced/widow(er) 38 9.8 20 9.4 58 9.7
Not informed 4 1.0 3 1.4 7 1.2
Monthly Family income
≥ 5.1 minimum wages 209 54.0 100 47.2 309 51.6
0.074 < 5.0 minimum wages 164 42.4 107 50.5 271 45.2
Not informed 14 3.6 5 2.4 19 3.2
Responsibility for underage children/
No 188 48.6 108 50.9 296 49.4
0.656 Sporadically/yes 188 48.6 100 47.2 288 48.1
Not informed 11 2.8 4 1.9 15 2.5
Health and functional capacity
Alcohol consumption
Sporadic consumption (0 – 1 day/
week) 355 91.7 192 90.6 547 91.3
0.736 Regular consumption (≥ 2 days/
week) 23 5.9 14 6.6 37 6.2
Not informed 9 2.3 6 2.8 15 2.5
Table 1. Descriptive statistics of sociodemographics, health and professional competence, according to changes in work ability, private hospital, São Paulo, 2009 – 2011.
409
Tabela 1. Continuation.
Variable
Maintaining Aggravation Total
p-value*
n % n % n %
Smoking
Never smoked/former smoker 345 89.1 199 93.9 544 90.8
0.135
Yes, I smoke 37 9.6 13 6.1 50 8.3
Not informed 5 1.3 0 0.0 5 0.8
Nutritional status
Eutrophic 203 52.5 126 59.4 329 54.9
0.249
Overweight 132 34.1 60 28.3 192 32.1
Obesity 46 11.9 23 10.8 69 11.5
Not informed 6 1.6 3 1.4 9 1.5
Practice of physical activities
Yes 143 37.0 78 36.8 221 36.9
0.994
No 235 60.7 128 60.4 363 60.6
Not informed 9 2.3 6 2.8 15 2.5
Work injury
No 335 86.6 193 91.0 528 88.1
0.032
Yes 35 9.0 9 4.2 44 7.3
Not informed 17 4.4 10 4.7 27 4.5
Professional competence
Educational Level
Elementary school 8 2.1 12 5.7 20 3.3
0.023
incomplete/inished high school 366 94.6 198 93.4 564 94.2
Not informed 13 3.4 2 0.9 15 2.5
Years in the profession
Less than 6 96 24.8 72 34.0 168 28.0
0.011
6 and more 285 73.6 133 62.7 418 69.8
Not informed 6 1.6 7 3.3 13 2.2
Position
Others 367 94.8 190 89.6 557 93.0
0.017
Technicians 20 5.2 22 10.4 42 7.0
Not informed 0 0.0 0 0.0 0 0.0
Total 387 100.0 212 100.0 599 100.0
*χ2 test.
Variable
Maintaining Aggravation Total
p-value*
n % n % n %
Values
Overcommitment
No changes 161 41.6 74 34.9 235 39.2
< 0,001
Aggravation 98 25.3 90 42.5 188 31.4
Improvement 120 31.0 43 20.3 163 27.2
Not informed 8 2.1 5 2.4 13 2.2
Work
Work violence (points)
0.602 7 (no violence) 254 65.6 134 63.2 388 64.8
8 67 17.3 29 13.7 96 16.0
9 34 8.8 23 10.8 57 9.5
10 or more 14 3.6 9 4.2 23 3.8
Not informed 18 4.7 17 8.0 35 5.8
Work sector
Corporate areas 34 8.8 12 5.7 46 7.7
0.320
Hotel 62 16.0 49 23.1 111 18.5
Other operations/services 13 3.4 6 2.8 19 3.2
Nursing services 207 53.5 103 48.6 310 51.8
Medical superintendence 32 8.3 16 7.5 48 8.0
Services of diagnosis and therapy 21 5.4 13 6.1 34 5.7
Supplies 18 4.7 13 6.1 31 5.2
Not informed 0 0.0 0 0.0 0 0.0
Work shit
Administration 102 26.4 43 20.3 145 24.2
0.246
Morning 101 26.1 55 25.9 156 26.0
Aternoon 75 19.4 53 25.0 128 21.4
Night 106 27.4 56 26.4 162 27.0
Not informed 3 0.8 5 2.4 8 1.3
Table 2. Descriptive statistics of personal values and work features , according to changes in work ability, private hospital, São Paulo, 2009 – 2011.
411
Tabela 2. Continuation.
Variable
Maintaining Aggravation Total
p-value*
n % n % n %
Work load
No changes 153 39.5 97 45.8 250 41.7
0.531
Aggravation 76 19.6 40 18.9 116 19.4
Improvement 89 23.0 45 21.2 134 22.4
Not informed 69 17.8 30 14.2 99 16.5
Work demands
No changes 180 46.5 110 51.9 290 48.4
0.010
Aggravation 123 31.8 73 34.4 196 32.7
Improvement 81 20.9 23 10.8 104 17.4
Not informed 3 0.8 6 2.8 9 1.5
Efort-reward imbalance
No changes 75 19.4 41 19.3 116 19.4
< 0.001
Aggravation 117 30.2 100 47.2 217 36.2
Improvement 181 46.8 59 27.8 240 40.1
Not informed 14 3.6 12 5.7 26 4.3
Social support
No changes 184 47.5 91 42.9 275 45.9
0.002
Aggravation 119 30.7 92 43.4 211 35.2
Improvement 82 21.2 26 12.3 108 18.0
Not informed 2 0.5 3 1.4 5 0.8
Control over work
No changes 208 53.7 115 54.2 323 53.9
0.524
Aggravation 84 21.7 51 24.1 135 22.5
Improvement 88 22.7 40 18.9 128 21.4
Not informed 7 1.8 6 2.8 13 2.2
Situations that favor pain/injury
No aggravation (delta < 15,0) 254 65.6 113 53.3 367 61.3
0.004 Aggravation (delta ≥ 15,0) 117 30.2 88 41.5 205 34.2
Not informed 16 4.1 11 5.2 27 4.5
Total 387 100.0 212 100.0 599 100.0
*χ2 test.
Tables 1 and 2 show the variables that were signiicantly associated with WA impairment in univariate analyses such as age group (p = 0.10), report of workplace injury (p = 0.032), all variables related to professional competence, overcommitment (p< 0.001), work demands (p = 0.010), ERI (p< 0.001), social support (0.002), and WRAPI (p = 0.004).
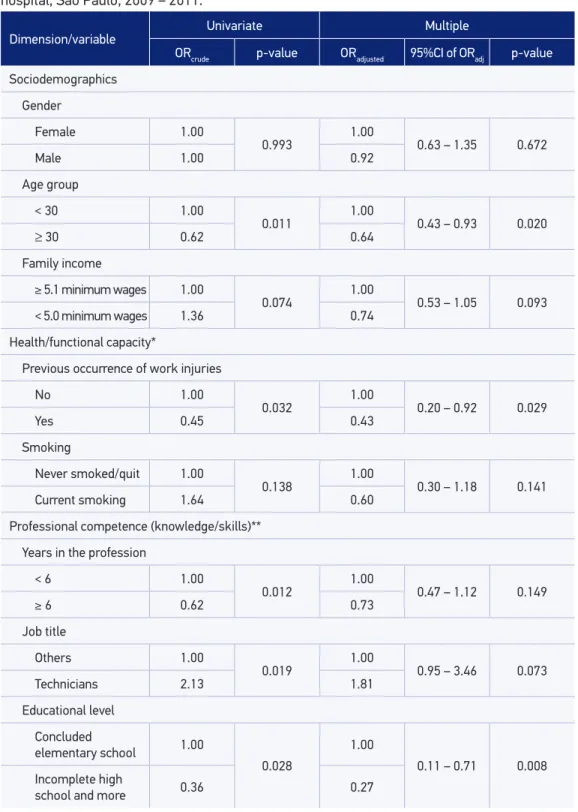
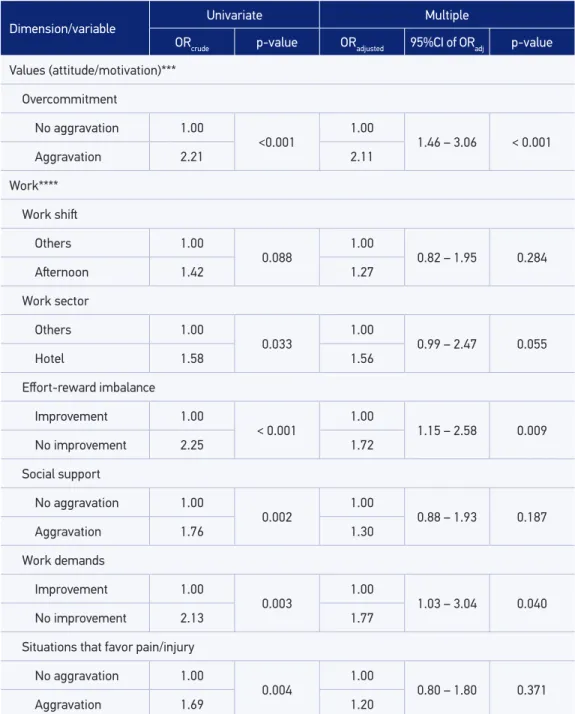
Table 3 presents the results of multiple hierarchical analyses. Among the demographic variables, the age group was kept in the modeling (OR = 0.64; p = 0.020). Regarding the dimension of health/functional capacity, previous occurrence of workplace injury was associated with WA impairment (OR = 0.43; p = 0.029). Regarding professional competence, educational level remained in the modeling (OR = 0.27; p = 0.008). Overcommitment, representing the values, remained associated with WA impairment (OR = 2.11; p < 0.001). Regarding work, the variables associated with changes in WA were ERI (OR = 1.72; p = 0.009) and work demands (OR = 1.77; p = 0.040). Some of the dimensions related with “values” and “work” showed higher chances of WA impair-ment, even after the adjustment by other variables. Gender was kept in the model as a control variable.
DISCUSSION
The results of this study conirmed the Work Ability House as a multidimensional model, in which characteristics of the individual, work and encircling environment are associated to WA. In this study, the factors that have been associated with changes in WA were age group, previous occurrence of workplace injury, years in the current profession, educational level, overcommitment, ERI, and work demands. Analyses were adjusted by the variables of each evaluated dimension (demographics, health, professional competence, values and work) in the hierarchical modeling. Moreover, in agreement with the theoretical model, the work dimension was the one with higher risk for WA impairment, with the variable regarding values (overcommitment).
413
Dimension/variable
Univariate Multiple
ORcrude p-value ORadjusted 95%CI of ORadj p-value
Sociodemographics
Gender
Female 1.00
0.993
1.00
0.63 – 1.35 0.672
Male 1.00 0.92
Age group
< 30 1.00
0.011 1.00 0.43 – 0.93 0.020
≥ 30 0.62 0.64
Family income
≥ 5.1 minimum wages 1.00
0.074 1.00 0.53 – 1.05 0.093 < 5.0 minimum wages 1.36 0.74
Health/functional capacity*
Previous occurrence of work injuries
No 1.00
0.032 1.00 0.20 – 0.92 0.029
Yes 0.45 0.43
Smoking
Never smoked/quit 1.00
0.138 1.00 0.30 – 1.18 0.141
Current smoking 1.64 0.60
Professional competence (knowledge/skills)**
Years in the profession
< 6 1.00
0.012 1.00 0.47 – 1.12 0.149
≥ 6 0.62 0.73
Job title
Others 1.00
0.019 1.00 0.95 – 3.46 0.073
Technicians 2.13 1.81
Educational level
Concluded
elementary school 1.00
0.028
1.00
0.11 – 0.71 0.008 Incomplete high
school and more 0.36 0.27
Tabela 3. Continuation.
Dimension/variable
Univariate Multiple
ORcrude p-value ORadjusted 95%CI of ORadj p-value
Values (attitude/motivation)***
Overcommitment
No aggravation 1.00
<0.001
1.00
1.46 – 3.06 < 0.001
Aggravation 2.21 2.11
Work****
Work shit
Others 1.00
0.088
1.00
0.82 – 1.95 0.284
Aternoon 1.42 1.27
Work sector
Others 1.00
0.033
1.00
0.99 – 2.47 0.055
Hotel 1.58 1.56
Efort-reward imbalance
Improvement 1.00
< 0.001
1.00
1.15 – 2.58 0.009
No improvement 2.25 1.72
Social support
No aggravation 1.00
0.002
1.00
0.88 – 1.93 0.187
Aggravation 1.76 1.30
Work demands
Improvement 1.00
0.003
1.00
1.03 – 3.04 0.040
No improvement 2.13 1.77
Situations that favor pain/injury
No aggravation 1.00
0.004
1.00
0.80 – 1.80 0.371
Aggravation 1.69 1.20
*Multiple analysis adjusted by the variables sex and age; **Multiple analysis adjusted by the variables sex, age,
and history of work accident; ***Multiple analysis adjusted by the variables sex, age, history of work accident, and educational level; ****Multiple analysis adjusted by the variables sex, age, history of work accident, educational level,
and overcommitment.
415
younger ones9,14. Another aspect is the possibility of the healthy worker efect, as those who remain active are the ones with better health.
The core structure of the House has the individual resources, including health and functional capacity, professional competence, and values4,5. The second set included the dimension of health/functional capacity. This dimension composes the irst loor of the House, the base that supports the building, because this is the resource that is more clearly related with WA4-6. In this dimension, the previous occurrence of work-place injury appeared as a protective factor against WA impairment. This result requires a careful interpretation. Workplace injuries generate temporary or permanent disabili-ties, so they can compromise the functional capacity of the workers15. Most work inju-ries involving health professionals are related to musculoskeletal disorders and hands needlestick/sharp objects injuries16,17. Musculoskeletal injuries may generate a prolonged or deinitive disability, and in the latter there is the risk for transmission of infectious dis-eases, leading to emotional and behavioral changes16,17. The healthy worker efect may have excluded those who presented more severe lesions, returning to work those with better health conditions.
The third set included variables representing the second loor of the House, concerning professional competence. In this dimension, workers with a higher educational level pre-sented lower WA impairment. A study conducted with Finnish workers showed that one out of three workers with lower schooling had WA compromise, while this relationship was lower than one for those with higher schooling18,19. These diferences must be interpreted from the point of view of the socioeconomic conditions relected by education, translated into economic, occupational, and social terms, along with health conditions and profes-sional specialization19.
The variables representing the third loor of the House concerns the internal aspects of the individual, manifested in values. Values were demonstrated by overcommitment. Overcommitment is deined as an individual motivational pattern of excessive search for accomplishment and high performance at work, which can become more intense owing to the pressure in the work environment, thereby making these professionals more prone to exhaustion and stress20. In this study, individuals with higher overcommitment presented higher WA impairment than the other workers, regardless of the other variables. This asso-ciation is identiied in other studies9,21.
social reciprocity, in which the imbalance between the efforts made and the rewards obtained can generate negative emotions, which is prone to neuroendocrine and auto-nomic activation. If these situations are maintained, they can trigger adverse effects on health20. Interventions in these aspects help to reduce the stress load, with favorable effects on health and WA10. The associations between the perceptions of aggravation in the exposure to psychosocial work demands and WA impairment reflect the fact that the more intense and frequent the work demands, the higher the risks to health and WA20,23 among healthcare workers8,10.
Studies with diferent methodologies conirm the theoretical considerations of the Work Ability House model6,7,23,which results agree with the ones found here. A study conducted in a population sample of Finnish workers showed the dimensions of work and health pre-sented higher power of explanation for the WA results6. Values, competence, and commu-nity surroundings also were associated with WA6, thus conirming the complex structure of the model. A study evaluating Finnish teachers identiied that the variables in the diferent dimensions of the House were associated with WA – use of medications, body mass index, percentage of body fat, aerobic capacity, muscle strength, stress, burnout, motivation, work organization, and work community24. In a systematic review, the authors emphasized the multifactorial nature of the construct, after identifying a variety of factors associated with WA impairment such as, lack of free time for physical activities, impaired musculoskeletal capacity, chronological aging, obesity, high mental and physical demands, lack of auton-omy, and precarious physical work place23.
WA impairment has a predictive value for negative outcomes for workers, institu-tions and society, resulting in absenteeism, lack of productivity, illnesses, early exit of the profession and higher mortality, including the health sector2,10,18,23. The knowledge of WA determinants allows subsidizing institutional and public policies in order to promote health and well-being for the workers, to protect and recover WA and favor employabil-ity2,5,10,18,23. A valid theoretical model to understand WA determinants represents a use-ful resource in the management of the worker’s health, applicable in planning, develop-ment, and evaluation of intervention actions addressed to the individual and collective aspects of work4,5,24.
417
the cohort; so, some measurements could not be assessed such as objective aspects of functional capacity. Finally, the study was conducted in a specific work group. Despite the limitations, the external validity can be extended for institutions with similar work characteristics and organization.
CONCLUSIONS
The results of this study among hospital workers confirmed the dimensions pro-posed for the Work Ability House model. It showed it is a valid model representing WA as a multidimensional construct, which is determined by different causes. These results have implications for institutional and public policies, because the tested model represents a useful tool in planning, development, and evaluation of actions addressed to the promotion and recovery of WA. More studies approaching other occupational groups are welcome.
1. Tuomi K, Ilmarinen J, Jahkola A, Katajarinne L, Tulkki A. Índice de capacidade para o trabalho. São Carlos: EduFSCar; 2005.
2. Ilmarinen J. Maintaining work ability. In: Towards a longer worklife! Ageing and the quality of worklife in the European Union. Helsinki: Finnish Institute of Occupational Health; 2006. p. 132-48.
3. Martinez MC, Latorre MRDO, Fischer FM. Validity and reliability of the Brazilian version of the Work Ability Index questionnaire. Rev Saúde Pública 2009; 43: 55-61.
4. Ilmarinen J, Gould R, Jäevikoski A, Järvisalo J. Diversity of work ability. In: Gould R, Ilmarinen J, Järvisalo J, Koskinen S, editors. Dimensions of work ability: Results of the Health 2000. Helsinki: Finnish Centre of Pensions, The Social Insurance Institution, National Public, Health Institute, Finnish Institute of Occupational Health; 2008. p. 13-24.
5. Ilmarinen J. 30 years’ work ability and 20 years’ age management. In: Nygård CH, Savinainen M, Kirsi T, Lumme-Sandt K, editors. Age Management During the Life Course: Proceedings of the 4th Symposium on Work Ability. Tampere: Tampere University Press; 2011. p. 12-22.
6. Ilmarinen J. Tuomi K, Seitsamo J. New dimensions of work ability. Int Congr Ser 2005; 1280: 3-7.
7. Järvelin S, Louhevaara V. Predictors of perceived work ability in mentally demanding work. In: Nordic Ergonomics Society’s annual conference: ergonomics for the future; 2007 oct 1-3; Lysekil/Sweden: Nordic Ergonomics Society, 2007.
8. Fischer FM, Martinez MC. Individual features, working conditions and work injuries are associated with work ability among nursing professionals. Work 2013; 45: 509-17.
9. Fischer FM, Martinez MC. Work ability among hospital food service professionals: multiple associated variables require comprehensive intervention. Work 2012; 41: 3746-52.
10. Hasselhorn H-M, Müller BH, Tackenberg P, NEXT-Study Group. NEXT Scientiic Report – July 2005. Wuppertal: University of Wuppertal, Wuppertal; 2005.
11. Alves MGM, Chor D, Faerstein E, Lopes CS, Wenerck GL. Versão resumida da “job stress scale”: adaptação para o português. Rev Saúde Pública 2004; 38: 164-71.
12. Chor D, Werneck GL, Faerstein E, Alves MGM, Rotenberg L. The Brazilian version of the effort-reward imbalance questionnaire to assess job stress. Cad Saúde Pública 2008; 24: 219-24.
13. Coluci MZO, Alexandre NMC. Adaptação cultural de instrumento que avalia atividades do trabalho e sua relação com sintomas osteomusculares. Acta Paul Enferm 2009; 22: 149-54.
14. Von Bonsdorf ME, Kokko K, Seitsamo J, von Bonsdorf MB, Nygård C-H, Ilmarinen J, Rantanen T. Work strain in midlife and 28-year work ability trajectories. Scand J Work Environ Health 2011; 37: 455-63.
15. Santana VS, Xavier C, Moura MCP, Oliveira R, Espírito-Santo JSE, Araújo G. Gravidade dos acidentes de trabalho atendidos em serviços de emergência. Rev Saúde Pública 2009; 43: 750-60.
16. Oliveira QB, Santos RS, Santos CMF. Acidentes de trabalho na equipe de enfermagem: uma revisão de literatura. Rev Enfermagem Contemp 2013; 2: 32-52.
17. Silva AID, Machado JMH, Santos EGOB, Marziale MHP. Acidentes com material biológico relacionados ao trabalho: análise de uma abordagem institucional. Rev Bras Saúde Ocup 2011; 36: 265-73.
18. Gould R, Ilmarinen J, Järvisalo J, Koskinen S. Dimensions of work ability – summary and conclusions. In: Gould R, Ilmarinen J, Järvisalo J, Koskinen S, editors. Dimensions of work ability: Results of the Health 2000. Helsinki: Finnish Centre of Pensions, Social Insurance Institution, National Public, Health Institute, Finnish Institute of Occupational Health; 2008. p. 165-75.
19. Martelin T, Sainio P, Koskinen S, Gould R. Education. In: Gould R, Ilmarinen J, Järvisalo J, Koskinen S, editors. Dimensions of work ability: Results of the Health 2000. Helsinki: Finnish Centre of Pensions, Social Insurance Institution, National Public, Health Institute, Finnish Institute of Occupational Health; 2008. p. 42-4.
20. Siegriest J. Efort-reward imbalance and health in a globalized economy. Scand J Work Environ Health 2008; 0(Suppl 6): 163-8.
21. Conway PM, Campanini P, Sartoria S, Dotti R, Costa G. Main and interactive efects of shiftwork, age and work stress on health in an Italian sample of healthcare workers. Appl Ergon 2008; 39: 630-9.
22. Bethge M, Radoschewski FM, Gutenbrunner C. Efort-reward imbalance and work ability: cross-sectional and longitudinal indings from the Second German Sociomedical Panel of Employees. BMC Public Health 2012; 12: 875.
23. Van den Berg TIJ, Elders LAM, Zwart BCH, Burdorf A. The efects of work-related and individual factors on the Work Ability Index: a systematic review. Occup Envron Med 2009; 66: 211-20.
24. Maltby T. Extending working lives? Employability, work ability and better quality working lives. Social Policy & Society 2011; 10: 299-308.
25. Oliveira SAO, Paiva RFR Possibilidade de diminuir o turnover da equipe de enfermagem nos serviços hospitalares. Rev Gestão & Saúde 2011; 2: 60-73.
Received on: 07/14/2014