A Comparative Case Study on the Norwegian Airline
Industry
The Effect of Social and Environmental
Sustainability on Firm Resilience
Name: Cathrine Andersen
Student ID: 1503
Program: Nova SBE/Maastricht SBE Double Degree
Study track: Strategy and Innovation
Supervisors: Prof Joana Story & Dr. Marc van Wegberg
1 RESILIENCE IN THE WORLD OF ”MEGA-CHALLENGES” 4
1.1 PROBLEM STATEMENT AND RESEARCH QUESTION 6
1.2 OVERVIEW OF THE TEXT 6
2 THEORY DEVELOPMENT AND LITERATURE REVIEW 7
2.1 ENVIRONMENTAL PRESSURE ON BUSINESS 7
2.1.1 THE DRIVERS OF ECOLOGICAL RESPONSIVENESS 8
2.2 THE POWER OF STAKEHOLDERS 9
2.3 INNOVATION FOR SURVIVAL 11
2.4 SINKING THE COST STRUGGLE 12
2.5 RESILIENCE 13
2.5.1 DISRUPTIVE INNOVATIONS 14
2.5.2 BLACK SWANS 14
2.6 CONCEPTUAL MODEL 15
3 THE AIRLINE INDUSTRY 16
3.1 AIRLINE EVOLUTION 16
3.2 THE BLACK SWANS OF THE AIRLINE INDUSTRY 17
3.3 DISRUPTIVE INNOVATIONS 17
3.4 SUSTAINABILITY 18
3.5 THE NORWEGIAN AIRLINE INDUSTRY 20
3.5.1 REGULATIONS 20
3.5.2 SCANDINAVIAN AIRLINES AB 21
3.5.3 NORWEGIAN AIR SHUTTLE ASA 21
3.5.4 DISRUPTIONS 22
4 METHODOLOGY 24
4.1 CASE STUDY 24
4.2 THE CHOICE OF THE NORWEGIAN AIRLINE INDUSTRY 24
4.3 QUANTITATIVE DATA COLLECTION AND ANALYSIS 25
4.4 QUALITATIVE DATA COLLECTION AND ANALYSIS 26
5 RESULTS 29
5.1 QUANTITATIVE RESULTS 29
5.2 QUALITATIVE RESULTS 32
6 DISCUSSION 37
6.1 ENVIRONMENT 37
6.2 STAKEHOLDERS 38
6.3 INNOVATION 40
6.4 COST 42
6.5 CONCEPTUAL MODEL 42
7 LIMITATIONS 43
8 CONCLUSIONS 44
BIBLIOGRAPHY 45
TABLE OF FIGURES
FIGURE 1: PRELIMINARY CONCEPTUAL MODEL 16
FIGURE 2: SAS SHARE PRICE 21
FIGURE 3: NORWEGIAN SHARE PRICE 21
FIGURE 4: TERRORIST ATTACK 9/11 29
FIGURE 5: FINANCIAL CRISIS 30
FIGURE 6: RYANAIR ENTRY 30
FIGURE 7: EYJAFJALLAJÖKULL 31
FIGURE 8: SUSTAINABILITY PERFORMANCE 31
FIGURE 9: CONCEPTUAL MODEL 43
TABLE 1: LOW-COST CARRIERS 18
1
RESILIENCE IN THE WORLD OF ”MEGA-CHALLENGES”
In the last 50 years, the corporate growth model has brought economic and civil revolution to the
western world and “western” is now a synonym with developed economy and prosperous wealth.
With a population of 7 billion people, urbanization and rising pollution is putting extreme
pressure on the environment and the world’s resources (The Global Commission on the
Economy and Climate, 2014). Global consumption of resources increased by 50% since 1990 and
with the current population growth, the global energy demand will require 80% more energy in
2050 (The Global Commission on the Economy and Climate, 2014, p. 46). The challenge now is
to create a global economy that the planet can sustain for years to come (Hart, 1997). Executives,
researchers and consumers alike are now questioning the viability of continuing the trajectory of
achieving profit maximization exclusively. According to Winston (2014) “business cannot succeed on a
planet that fails” (p.59) and with the existing levels of resource exploitation, our natural
environment is deteriorating. Traditional business or “business as usual” needs to move from
steadyresource deteriorating evolution towards transformation.
This study aims to explore the relationship between sustainability and resilience. The study refers
to resilience as a firm’s ability to survive and sustain its level of performance regardless of
disruptions from the macroeconomic environment. Hamel and Valikangas (2003) characterize a
resilient firm as “Any company that can make sense of its environment, generate strategic options, and realign its
resources faster than its rivals” (p.13).
The research setting of the study is the airline industry, which is characterized as highly volatile to
external events, strongly competitive and capital intensive. Due to its particularly intense nature,
the research was confined to explore the Norwegian airline industry, consisting of two main
players, Scandinavian Airlines AB (SAS) and Norwegian Air Shuttle ASA (Norwegian). SAS and
ABSTRACT
How does sustainability affect an airline’s resilience in increasingly turbulent environments? This
study develops a theory of four variables linking sustainability and resilience. The research is
conducted through a comparative case study on two players in the Norwegian airline industry,
Norwegian Air Shuttle ASA and Scandinavian Airlines AB. The research found that
sustainability can lead to resilience through environmental-, stakeholder-, innovation- and
cost-orientation. The airlines covered in this study that engage in sustainability through these four
Norwegian cover 73% of the total passenger market from Norway’s (Avinor run) airports1
(Avinor, 2013a). In the past 15 years, the Norwegian air transportation market has suffered from
extreme competitive powers and subsequent price wars resulting in decreased earnings and severe
survival challenges. Furthermore, the industry is under particular pressure from the external
natural and economic environment.
The study is structured around four main queries. The first is to find ways to evaluate to what
extent the two airlines are resilient to four selected disruptions occurring between 2001-2010.
Discovering any potential differences in resilience levels respective to the nature of the shock is
important in order to develop a picture of the airlines’ overall resilience. Secondly, the study
investigates what types of strategies the airlines pursued prior, during, and a priori the occurrence
of the shocks. This exploration is conducted in order to get a better understanding of the
strategies that might be attributable to resilient companies. Thirdly, the study attempts to explore
the levels of social and environmental engagement by turning to the sustainability initiatives and
corporate mindsets. Finally, the study combines the findings in order to find links between the
airlines’ sustainability measures and ability to develop resilience.
According to the transition pathway theory by Geels and Schot (2007), the occurrence of regime
shift depends on the nature and timing of multi-level interactions in combination with the
landscape pressure. The theory links the external environment and the development of the new
regimes, indicating that the external environment can cause complete market reorientation (Geels
& Schot, 2007). Winston (2014) argues that businesses have to adapt to the extreme social and
environmental challenges in order to survive. After all, “citizens are the ones who ensure the market
system on which companies depend” (Margolis, Elfenbein, & Walsh, 2009, p. 27).
Over the past years, we have seen hugely successful innovations leading companies to fame and
fortune while being sustainability oriented. Elon Musk’s electricity powered sports car Tesla
recently became the number one selling car in Norway (Dagenborg, 2013). The video-call service
Skype opened up the opportunity for virtual meetings and consequently limited necessary travel
time for many businesses (Skinner, 2010). According to Nidumolu, Prahalad, and Rangaswami
(2009) “Traditional approaches to business will collapse, and companies will have to develop innovative solutions”
(p.9). Sustainability is often about reducing consumption, which also is common ground for cost
cutting strategies. Being able to keep costs under control, may allow the flexibility to be resilient
1 Avinor AS is a state owned air traffic control entity under the ownership of the Norwegian Ministry of Transport
to shocks. For instance, De Geus (2002) argues that money can be useful in buying a firm time to
develop new growth strategies.
Given the limited research on the relationship between sustainability and non-financial
performance indicators, this study finds support for conducting a case study approach to theory
development. As we are now standing at the crossroads of continuing “business as usual” and
start turning to the critical social and environmental needs, discovering the role of sustainability in
the prospects of economic growth is becoming increasingly important. Given the highly
competitive, rapidly changing and unpredictable nature of the 21st century marketplace,
characteristics for survival and long-term prosperity is becoming increasingly difficult to identify.
1.1 Problem Statement and Research Question
The most pressing issue in today’s businesses is how to survive the increasingly competitive
market with a natural environment that is on the verge to collapse and billions of people
screaming for help. It is essential for business to attempt to discover ways in which we can create
mutual benefits for the environment, society and business, or famously referred to as the triple
bottom line (Elkington, 1997). The research question of this study aims to contribute to current
research in building a theory of how business can benefit from social- and environmental
sustainability. The research question is as follows:
“How does social and environmental sustainability affect a firm’s resilience?”
Overview of the Text
This study aims to extend current theories on sustainability and resilience. To do so, the current
literature on the topic is explored in the first part of the paper. The potential relationships
between the two concepts are visualized in a conceptual model. The choice of industry and firms
is carefully justified in the third section. Furthermore, methodological choices are thoroughly
described in the succeeding section and are written with the intention to offer transparency and
frankness into the research process. Lastly, the quantitative- and qualitative results are presented,
2
THEORY DEVELOPMENT AND LITERATURE REVIEW
Increasing global wealth, improved technology and shorter relative distances due to globalization
has left the competitive landscape more easily accessible (Rogoff, 2003). The number of entrant
firms is booming, essentially making profits from product and service ideas that many would
regard as unimaginable a few years ago (Downes & Nunes, 2014). Incumbent firms feel gradually
more pressured and profits become slimmer. To make matters worse, the long list of mega
problems coming to the forefront in global political discussions is generating a greater awareness
of the challenges ahead. The result is extreme competitive environments, price wars,
socio-political crisis and resource depletions (Hardin, 1968).
This chapter aims to discuss the existing research on the sustainable business strategies and the
possible commonalities with resilient capabilities. The chapter explores the links between
sustainability initiatives towards the environment, stakeholders, innovation, costs and their effect
on resilience. Lastly, the links will be presented in a preliminary conceptual model.
2.1 Environmental Pressure on Business
The relationship between the environmental performance and business performance has been
heavily debated over the past decades (Berry & Rondinelli, 1998; Christensen & van Bever, 2014;
Cochran & Wood, 1984; De Geus, 2002; Dyllick & Hockerts, 2002; Griffin & Mahon, 1997;
Karnani, 2007; Margolis et al., 2009; Seifert, Morris, & Bartkus, 2004; Teigão dos Santos &
Partidário, 2011; Walley & Whitehead, 1994). The traditional belief that environmental initiatives
are regarded as a cost rather than investment is both supported and disputed by many. According
to Walley and Whitehead (1994), environmental response will always be regarded as costly and
complicated by managers and provide little economic return. Freedman and Jaggi (1982) studied
the effect of pollution disclosure on pollution performance and economic performance. Whilst
large and poorly performing firms had detailed pollution disclosure, no evidence was found
indicating a relationship between performance and disclosure in small companies (Freedman &
Jaggi, 1982).
Fogler and Nutt (1975) tested the relationship between negative publicity and stock performance
in paper companies. The findings revealed no stock sell-offs when the companies were cited as
polluters, resulting in little or no effect on the stock price valuation (Fogler & Nutt, 1975). Whilst
environmentally conscious investors might sell stock after such publications, other irresponsible
investors will buy, hence such theory will only be valid under the assumption that all investors are
pressure from society potentially results in more environmentally conscious businesses and
investors (Tullberg, 2005).
On the other side of the debate, there is a general argument that engaging in environmental
incentives has a positive effect on business performance. Many researchers distinguish between
responsive and autonomous Corporate Social Responsibility (CSR) (Anderson & Tushman, 1990;
Dyllick & Hockerts, 2002; Tullberg, 2005). Responsive CSR includes both reactive and proactive
incentives and have been coined in the term “greening” by Hart (2010). Greening technologies
include acts such as pollution prevention and product stewardship that was introduced in the late
1980s and early 1990s (Hart, 2010). Reactiveness refers to initiatives introduced as a response to
public demand or the fear of bad publicity, whilst pro-activeness is a few steps ahead and include
initiatives implemented on the bases of criticism-avoidance (Tullberg, 2005). Autonomous CSR is
independent and is referred to by Hart (1997) as “beyond greening” technologies. Companies
pursuing autonomous CSR strategies attempt to be differentiated for fulfilling their own standards
and typically have no ambition to initiate additional general standards (Tullberg, 2005). According
to Hart (1997) many executives fail to realize the growth opportunities associated with
autonomous or “beyond greening” strategies. Incorporating the environment into the business
strategy is what constitutes clean technology, when companies invest in tomorrow’s strategies
(Hart, 1997).
More than 15 years ago, Berry and Rondinelli (1998) argued that firms incorporating the
environment in their strategies are more efficient and competitive. Investing in environmental
sustainability has been found to pay off (Orlitzky, Schmidt, & Rynes, 2003; Russo & Fouts, 1997)
and to an even greater extent in times of industry growth (Russo & Fouts, 1997). Whilst some
argue for the return on investment, researchers have also argued for sustainability investments as
a potential source for competitive advantage (Hart, 1997; Porter & Kramer, 2006). The Global
Commission on the Economy and Climate recently backed up the latter view in The New Climate
Economy Report, where they claim that combating climate change and economic growth are not
mutually exclusive strategies (The Global Commission on the Economy and Climate, 2014).
2.1.1 The Drivers of Ecological Responsiveness
Several studies have aimed at discovering the motives behind corporate greening (Pratima Bansal
& Roth, 2000; Berry & Rondinelli, 1998; Epstein & Roy, 2001; Nidumolu et al., 2009). Pratima
Bansal and Roth (2000) identified four main drivers of corporate ecological responsiveness:
Increasing penalties and legal acts towards companies who fail to comply with laws and
regulations has caused many executives to sharpen their environmental policies and introduce
consistent controls (Pratima Bansal & Roth, 2000). Furthermore, a wide range of stakeholders,
including local communities, customers and interest groups puts pressure on companies to engage
in corporate environmental responsibility (Pratima Bansal & Roth, 2000; Berry & Rondinelli,
1998). The economic opportunity is what encourages many business leaders to embark on the
environmental adventure (Hart, 1997; Porter & Kramer, 2011; The Global Commission on the
Economy and Climate, 2014). Prospects of cost-reductions, increasing efficiency and public
awareness can be achieved through green marketing, waste reduction and corporate reputation
(Pratima Bansal & Roth, 2000). Lastly, ethical motives account for much of the initiative
introduced in the recent years. Ecological initiatives are often attributable to one single person in
the organization, who decides to champion the organization’s current ecological performance
(Pratima Bansal & Roth, 2000).
By combining Pratima Bansal and Roth’s (2000) five drivers of economic performance with
resilience, overlaps become apparent. According to Winston (2014), the current environmental
challenges require fundamental restructuring of businesses. Although governments, activists,
consumers and researchers can promote the environmental agenda, businesses are the entities
with the talent, resources and innovation to tackle such challenges (Winston, 2014). Resilience
refers to long-term survival, shock avoidance and recovery (Gilbert, Eyring, & Foster, 2012).
Relying on strategies that are not actively contributing to the relief of global climate changes and
resource constraints consequently may affect resilience. As today’s businesses rely heavily on
nonrenewable resources and the world is approaching a time when these will be either limited or
obsolete, it will make good business sense to develop strategies that minimize our reliance on
such resources. According to Folke (2006), humanity’s pressure on the ecosystems can cause
sudden regime shifts towards less desirable states and hence affect firms’ resilience. After all,
“business cannot succeed on a planet that fails” (Winston, 2014, p. 59).
2.2 The Power of Stakeholders
Stakeholder management is an important part of business. In recent years, some claim that
stakeholders are becoming increasingly demanding due to rising incomes and spread of education
(Berry & Rondinelli, 1998). The deliberate debate on the relationship between social responsibility
and business is “one of the most researched, yet least understood topics within the field of business and society”
(Seifert et al., 2004, p. 136). Since the 1960s, the effect has been measured on financial
performance and researchers have taken several opposing stands (Cochran & Wood, 1984). The
increase profits (Friedman, 2007). In relation to this argument, Locke (1996) proclaims
shareholders to be the only stakeholders in the minds of business (Griffin & Mahon, 1997).
However, when arguing for the negative effect of CSR on financial performance, many
researchers use the value of shares to estimate financial performance (Clarkson, Li, Richardson, &
Vasvari, 2011; Davidson, Chandy, & Cross, 1987; Seifert et al., 2004; Vance, 2001). A study
conducted by Vance (2001) found that investing in socially responsible stocks does not yield a
higher return, but essentially yield lower returns (Vance, 2001). Assuming the findings by Vance
(2001) hold, investors who refrain from purchasing responsible stocks will be better off,
indicating a negative relationship between the share value and CSR.
Stakeholder management is crucial for building a favorable reputation (Hillman & Keim, 2001).
However, stakeholder groups do not only include powerful shareholders. Governmental
institutions, consumers, activist groups, employees and the general public also have significant
power. For instance, research shows that consumers who perceive a company’s socially
responsible efforts as genuine, will likely increase their choice of the brand (Barone, Miyazaki, &
Taylor, 2000). As many executives regard sustainability as an expense to the shareholders, the true
challenge of stakeholder management, is to “balance the competing demands of various stakeholders” (P.
Bansal & DesJardine, 2014, p. 72).
Interestingly, Porter and Kramer (2011) argue that creating shared value and corporate economic
value are not mutually exclusive. Milton Moskowitz (1972) claimed already during the early 1970s
that socially responsible firms have the potential to outperform competitors (Vance, 2001). The
belief that CSR has a positive effect on financial performance belongs to the majority of
publications on this topic (Cochran & Wood, 1984; Hart, 1995; Margolis et al., 2009; Orlitzky et
al., 2003; Prahalad, 2006; Servaes & Tamayo, 2013). Bowman (1978) found that the less successful
companies in the food industry showed evidence of coping badly with the environment.
Additionally, Servaes and Tamayo (2013) found CSR and firm value to be positively correlated,
while Orlitzky et al. (2003) found social responsibility to have an even greater pay-off than
environmental sustainability. More recent studies deal with the possibilities for enhanced growth
by focusing on new consumer markets. The debate even stretches to claims that businesses
should turn to the largely untapped market of the global population living on less than $2 a day
(Karnani, 2007; Prahalad, 2006). This proportion of the population is referred to as the Bottom of
the Pyramid (BOP) and can provide further growth for multinational corporations while
While various stakeholder groups have the power to push businesses in the direction of
sustainability, the downside may become apparent in the event of failure to comply with demands.
Failing to satisfy stakeholders could harm company resilience. Corporate sustainability has been
defined by Dyllick and Hockerts (2002) as “meeting the needs of a firm’s direct and indirect stakeholders
without compromising its ability to meet the needs of future stakeholders” (Dyllick & Hockerts, 2002, p. 131).
The definition is a good explanation of the potential relationship between sustainability and
resilience, in addition to identifying the role of stakeholders.
2.3 Innovation for Survival
According to Porter (2008), there are two ways one can achieve competitive advantage; through
cost leadership and differentiation. What both strategies have in common is the need for
innovation to achieve them. The aim of Porter’s Five Forces Framework is to ”raise the odds of
discovering a desirable strategic innovation” (Porter, 2008, p. 7). One of the problems developed over
time is that “western culture has a long history of introducing solutions (particularly technical ones) designed to
solve a specific problem, without considering the broader system impacts the solution might have” (Westley, 2013,
p. 7). As businesses rely on resources in order to innovate, the diminishing supply of certain
resources may act as a trigger for further innovation strategies (Westley, 2013). In fact,
diminishing resources have inspired substitutes to nonrenewable resources through technological
innovations2 (Hart, 1997)
Christensen and van Bever (2014) questioned why corporations, during a time of historically low
interest rates, maintain huge piles of cash reserves. They claim that the reason is certainly not due
to a lack of investment opportunities, but rather on an outdated assumption that capital is scarce
(Christensen & van Bever, 2014). This results is investments in short-term innovations, so-called
performance-improving or efficiency-enhancing innovations, rather then market-creating
innovations (Christensen & van Bever, 2014). The latter typically requires extensive capital in
addition to having a longer payback time, making them rather unpopular among investors and
managers. However, only market-creating innovations has the ability to encourage growth, new
market expansions as well as creating jobs for the common good (Christensen & van Bever,
2014). Although they are perceived to be more risky, in reality they aim at entirely new markets,
free from competition and should therefore be regarded as less risky (Christensen & van Bever,
2014).
Sustainable innovations typically share the same characteristics as market-creating innovations.
Beyond greening innovations require extensive use of capital and a long-term payback time,
making it unattractive to shareholders. According to Bain & Company (2012), it is time to renew
the system and encourage investors to see the potential of huge returns from long-term
investments and for managers to realize that long-term sustainable innovations can create a more
secure futuristic growth scenario. By encouraging sustainable innovations, companies can reap
additional benefits from reduced input, increase revenues and gain first-mover advantages
(Nidumolu et al., 2009).
Several of the benefits with sustainable investments have overlapping characteristics with
resilience. In order to be resilient, companies need to invest in long-term strategies and avoid
short-termism, according to Hart (1997). Christensen and van Bever (2014) argue that investing in
market-creating innovations positively affects resilience. The arguments fits well with the claim by
De Geus (2002) stating that failing companies only invest in a fraction of their potential.
Businesses are the only organizations with the resources, dedication and skill to develop these
innovations that have enormous relieving impact on society and the planet’s resources (Hart,
1997). According to Westley (2013), social innovation and resilience both share characteristics
such as evolution, adaptation and transformation, which also supports De Geus’ (2002) view that
businesses need to develop learning abilities in order to adapt to the changing world.
2.4 Sinking the Cost Struggle
Investments in sustainability initiatives may bring additional cost reducing benefits to companies.
Traditionally, many executives and managers viewed sustainability as additional costs to the
company and only introduced initiatives as a form of regulatory compliance. Even with such
justification for partaking in sustainability initiatives, companies protect themselves from costly
process changes, product amendments, fines or even lawsuits (Hart, 1997; Nidumolu et al., 2009).
Recent views also indicate that there are great cost-benefits associated with sustainability, as
companies rely on fewer resources or recycle used input (Nidumolu et al., 2009). According to
Berry and Rondinelli (1998), certain ways of engaging in sustainability will lead to cost savings in
relation to waste reduction. According to Porter and Kramer (2011) “environmental performance can
often be achieved with better technology at nominal incremental cost and can even yield net cost savings through
enhanced resource utilization, process efficiency, and quality” (p.69).
Hart (1997) suggests three stages in environmental strategies that can be sources of cost
reductions. Pollution prevention refers to strategies that eliminate the creation of waste and is
considered a highly cost-saving strategy as it limits costs associated with pollution clean ups and
waste management (Hart, 1997). The second stage is product stewardship and refers to complete
referred to as cradle-to-cradle, where producers take control of the product throughout its life
cycle. This can potentially reduce costs as it forces the company to carefully consider the entire
product life cycle and aim for making it as efficient as possible. Additionally, product stewardship
creates opportunities for revenue growth through product differentiation (Hart, 1997). The third
and last stage is clean technologies, which refers to long-term investments in new technology, i.e.
market-creating innovations (Christensen & van Bever, 2014; Hart, 1997).
Drawing upon the literature, it becomes apparent that much of the cost reductions occur in the
supply chain, allowing for the creation of links between sustainability and supply chain
management. Melnyk (2014) argues that ensuring resilience in the supply chain is crucial in today’s
turbulent and unpredictable world. Disruptions to the supply chain can pose great threats to
business survival by affecting the company’s resources, financials and efficiency in production
processes (Melnyk, 2014). Additionally, Melnyk (2014) makes the distinction between resistance
(proactive) and recovery (reactive) capabilities for resilience and lists a number of investments that
may strengthen a company’s resistance or recovery (p. 36). Heavy investments in discovery, or
market-orientation is estimated to have a very strong effect on avoidance, whilst companies found
in industries with high uncertainty will benefit from investments in operating flexibility as a
recovery strategy (Melnyk, 2014).
2.5 Resilience
C.S. Holling first coined the term resilience in 1973, and although referring to ecological resilience
among living organisms, it remains relevant today. Resilience can be describes as the critical
feature that reflects the capacity of a system to absorb disturbance and reorganize without
collapsing (Teigão dos Santos & Partidário, 2011). In this increasingly turbulent, unpredictable
and sensitive world, the importance of managing resilience is being increasingly recognized by
most businesses (Teigão dos Santos & Partidário, 2011). According to De Geus (2002), the
average life expectancy of Fortune 500 companies is between 40 and 50 years, raising the question
of what the companies that have been around for a hundred years, such as General Electric, IBM
and Lloyd’s, are doing so differently. De Geus (2002) identified four common characteristics of
longitudinal successful firms: sensitivity to their environment, strong sense of identity, tolerance
and conservative financing (De Geus, 2002, p. 6). The first characteristic refers to how resilient
companies reap benefits from adapting to the rapidly changing environment by continuously
turning to and successfully co-existing with its surroundings (De Geus, 2002). Resilient companies
also develop a strong sense of identity, culture and avoid exercising centralized decisions and
control (De Geus, 2002). Lastly, companies who believe in a rather conservative financial
opportunities (De Geus, 2002; Taleb, 2010). Company failure is often caused by too tight
economic focus and control of production and subsequently neglecting the fact that the company
exists of living organisms (De Geus, 2002).
The competitive landscape of the 21st century is increasingly being affected by several predictable
and unpredictable changes. These disruptions, whether technological or market oriented, tend to
create shocks and consequently restructure the competitive landscape. Markets for disruptive
technologies are unpredictable and “experts’ forecasts will always be wrong” (Christensen, 1997, p.154).
Sharing this view, Taleb (2010) claims that rather than attempting to predict the totally
unpredictable events, we have to adjust to their existence and avoid making ourselves vulnerable
to their occurrence.
2.5.1 Disruptive Innovations
The Innovator’s Dilemma by Christensen (1997) describes how great firms fail when faced by
certain market and technological changes. Incumbent firms generally focus on improving their
existing offering to better fit the demand from the customers and as a consequence often fail to
recognize disruptive technologies or new entrants at the horizon (Christensen, 1997). Disruptive
technologies typically have a steeper learning curve than sustaining technologies and reach the
quality level of incumbent firms much faster than forecasted (Christensen, 1997). Blindly
following the dogma that ‘one should keep close to ones customers’ may have fatal mistakes as
customers are often struck with the inability to anticipate new technologies (Christensen, 1997).
The challenge for managers is to find ways to tackle these disruptions in order for the companies
to survive (Dewald & Bowen, 2010).
2.5.2 Black Swans
In line with unpredictable disruptive innovations we find unpredictable events. Referred to as
Black Swans by Taleb (2010), these events are identified by three characteristics. It is an outlier,
positioned outside of our expectations because nothing of such nature has previously occurred
(Taleb, 2010). It comes with extreme impact and our human nature has a habit of seeking answers
post-factum, which makes us believe that the Black Swan is explainable and predictable (Taleb,
2010)3. The unpredictability of Black Swans makes survival in any business even more challenging.
Humans (e.g. business leaders) “need to be robust to negative Black Swans and exposed to positive ones”
(Taleb, 2010, p. xxi). The occurrence of the highly unlikely event can either bring devastating
effects or outstanding opportunities to the competitive landscape (Taleb, 2010).
Black Swans can have effects on businesses that typically would not be in any relation to the
actual event. For instance, how did the terrorist attacks on 9/11 affect the beauty product
industry? According to Cheng (2011), 9/11 initiated extreme growth in small-packaged beauty
products due to the increased global airport security. The result is an average annual increase of
10% in 3-ounce (or less) personal care packages since the introduction of the liquid restriction in
2006 (Cheng, 2011, p. 3). The researchers and experts in the beauty department would not at all
be able to predict the occurrence of such event, let alone the positive effect on sales.
Taleb (2010) argues that the only way we can limit the devastating effects of Black Swans is to
avoid exposing society to these totally unpredictable events. In times where companies already
find themselves in exposed positions, the most obvious way to handle is through limiting your
consequent risk through insurance (Taleb, 2010). As this is not always a plausible strategy, Taleb
(2010) suggests nine rules. One should learn to accept time and non-demonstrative knowledge,
supporting the previous discussion on long-termism and short-termism (Taleb, 2010). Secondly,
learning to appreciate redundancies refers to maintaining cash and savings in order to prepare
yourself for Black Swans (Taleb, 2010). Additionally, one should avoid specializing too deeply, in
case your area of expertise one day becomes obsolete (Taleb, 2010). Furthermore, Taleb (2010)
argues that one should avoid predicting results from the low-probability events. Expressing
caution is crucial when talking about the “atypicality” of occurrences, as they are largely based on
historic knowledge and fail to predict new events (Taleb, 2010). The last five rules are largely
based on the unreliability of metrics for predicting events. Rule number eight states; “Do not confuse
absence of volatility with absence of risk” is particularly important, as it has mislead many throughout
the years and resulted in devastating consequences (Taleb, 2010, p. 373).
2.6 Conceptual Model
The following preliminary conceptual model of the antecedents of resilience is derived from the
literature review. As seen in the model, sustainability can positively affect resilience through four
moderating variables. The remainder of the study aims to discover how and why these links do or
3
THE AIRLINE INDUSTRY
The global airline industry is often characterized as volatile and unstable (Dobruszkes, 2006;
Franke & John, 2011a, 2011b; John G. Wensveen, 2009; Wensveen & Leick, 2009).
Interchangeable times of growth and decline forces the airline industry to operate in times of
adaptation, survival and recovery (Wensveen & Leick, 2009). While airlines’ prosperity is closely
linked to the economic performance, fuel prices, regulations and the industry has also experienced
several Black Swans, making the survivors an interesting topic for investigation.
The following chapter covers the evolution of the airline industry, its challenges and adaptations.
Furthermore, it captivates the history of the two airlines included in this study.
3.1 Airline Evolution
The Golden 90s marked the starting point for an increasingly volatile airline industry (Franke &
John, 2011a, 2011b; Hamill, 1993). Separated by a period of fluctuating profit growths of 7-9%,
the industry encountered unforeseen, yet devastating events following 2000 (Franke & John,
2011a). The dotcom era of the 2000s was followed by three years of economic downturn. At this
point, air transportation still belonged to a category of premium products and demand was closely
linked to the global economic performance (Franke & John, 2011a). The approach of an
economic downturn in the beginning of 2000 therefore contributed to what is referred to as the
“perfect storm”, consisting of the financial economy, dotcom bubble, 9/11 and SARS (Franke &
John, 2011a). What was classified as the worst airline crisis ever in 2001 was followed by a
double-Sustainability
Resilience
Environment Stakeholders
Innovation Costs
dip recession in 2003 and recovery was reached in 2006, just in time for the devastating recession
of 2007-2008 (Wensveen & Leick, 2009).
The oil price in January 2008 was estimated at $90 per barrel (Franke & John, 2011a). As early as
in July the price increased to $140 per barrel, putting severe pressure on the global airline industry
(Franke & John, 2011a). When the economic meltdown hit with the collapse of the financial
sector in September, the oil prices of $40 per barrel did little for the decreasing demand for
business- and first-class airfare tickets.
3.2 The Black Swans of the Airline Industry
Both the terrorist attacks of 9/11 and the dotcom era were exogenous, unforeseen events leading
to several challenges for the industry. With the dotcom era, consumers are exposed to close to
perfect information through the Internet, making product and service decisions increasingly well
reasoned (Ward & Lee, 2000). In 2010, an eruption from Eyjafjallajökull volcano in Iceland
resulted in an enormous ash cloud and cancellation of flights in Northern Europe (Owen, 2010).
The more recent Black Swans was the devastating news of Malaysian Airlines Flight MH17 being
shot down by Russian or Ukrainian activist in July 2014 (BBC News, 2014) as well as the Ebola
breakout in West Africa in September 2014 (Centers for Disease Control and Prevention, 2014)
frightening global travelers.
3.3 Disruptive Innovations
Despite several unforeseen disruptions taking its toll on the performance of the airline market, the
industry has been struck by several disruptive innovations. These include platforms such as
Skyscanner and Trivago that allow customers to easily compare prices and tickets. Perhaps the
greatest, which this study will mainly focus on, was a business model innovation pioneered by
U.S. based Southwest airlines in 1973 (Dobruszkes, 2006). The premium business model was built
around the business- and first-class customer segment (Franke, 2004). The incumbent airlines
used highly discounted economy-class tickets to fill up the excess seats from first- and
business-class passengers, which initially financed the economy business-class tickets (Wensveen & Leick, 2009).
When demand for the premium tickets decreased, Southwest took to the skies to meet the needs
of the underserved economy-class market (Dobruszkes, 2006).
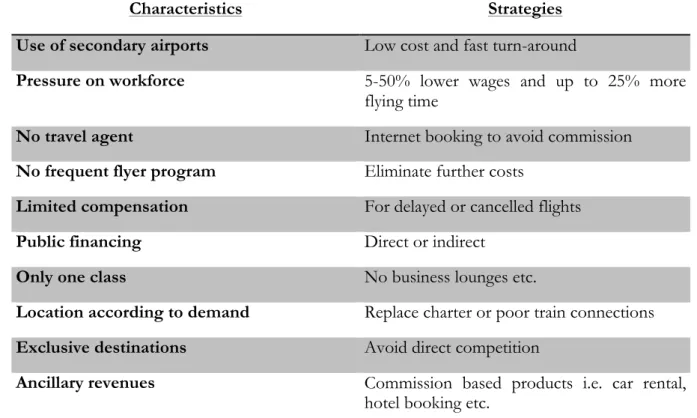
The Low-Cost Carriers (LCCs) has claimed to operate at a rate of 40-50% of the cost of the
Full-Service Carriers (FSCs) (Dobruszkes, 2006), and today this number is expected to be even lower.
For instance, Norwegian Airlines operating costs in 2006 was 0.52 NOK per produced seat
kilometer (ASK) and in 2013 the airline reported operating costs of 0.44 NOK per ASK, i.e. a
number of cost-saving strategies, including flying one standard of airplanes to enforce
standardization, point-to-point flying, abandoning hubs, one class only and no “frills” such as
meals, newspapers or assigned seating (Raynor, 2011). Further cost-cutting strategies can be
found in Table 1. Southwest’s groundbreaking business model led to several new entrants to the
market, such as Ryanair, Easyjet, JetBlue and Norwegian who all follow similar cost-cutting
strategies.
Table 1: Low-Cost Carriers
Characteristics Strategies
Use of secondary airports Low cost and fast turn-around
Pressure on workforce 5-50% lower wages and up to 25% more
flying time
No travel agent Internet booking to avoid commission
No frequent flyer program Eliminate further costs
Limited compensation For delayed or cancelled flights
Public financing Direct or indirect
Only one class No business lounges etc.
Location according to demand Replace charter or poor train connections
Exclusive destinations Avoid direct competition
Ancillary revenues Commission based products i.e. car rental,
hotel booking etc.
Source: (de Wit & Zuidberg, 2012; Dobruszkes, 2006; Raynor, 2011)
3.4 Sustainability
Growing concern for the effect of pollution on the environment and rising threat of global
warming has lead highly polluting industries towards the center for scrutiny and debate. High
capital costs- and entry barriers, tendency toward oligopolies and intense regulations makes the
airline industry comparable to the manufacturing industry (Lynes & Andrachuk, 2008). Airlines
are repeatedly excluded from environmental regulation4 (Lynes & Andrachuk, 2008; Raynor,
2011), despite its status as a major polluter of Carbon Dioxide (CO2) (Lee & Park, 2009). In
Norway, air transportation accounts for 3.02% of the total CO2 emissions (Miljødirektoratet,
2013, p. 1).
4 The Kyoto agreement (put in force in 2005) is a global initiative to reduce carbon emission. However, aviation is
The increasingly industrial society with higher educations, higher incomes, more holiday-time
combined with the increasing price-war in the airline industry is leading to growing mobility
patterns (Gössling & Peeters, 2007). People are travelling more frequently, longer and for shorter
periods of time, resulting in air travel continuing to outgrow any other form of transport. The
domestic and international flight traffic in Norway is estimated to increase by 97% from
2007-2025 in terms of passenger miles (Bærekraftig og Samfunnsnyttig Luftfart, 2011, p. 3). This
enormous growth has caused many to react, as air travel is considered as the “most environmentally
harmful form of tourism with respect to climate change” (Gössling & Peeters, 2007, p. 403).
The societal, economic and environmental impact of the airlines has been recognized by the
International Air Transport Association (IATA) (Lee & Park, 2009) and a growing awareness
among stakeholders is putting pressure on the airlines to act responsibly and increase their focus
on sustainability (Lynes & Andrachuk, 2008). Current developments of Corporate Social and
Environmental Responsibility (CSER) in the airline industry include investments in increasingly
fuel-efficient aircraft, carbon-offsetting programs5, internal social commitment, waste and water
reduction. CSER is defined as “the voluntary commitment of a firm to contribute to social and environmental
goals” (Lynes & Andrachuk, 2008 p. 378). However, there seems to be a lack of conformity
regarding the extent to which airlines choose to engage in CSER.
Lee and Park (2009) claim that social and environmental responsible strategies will become more
critical to a prospering future in the airline industry. Their study found a positive linear
relationship between CSR and value performance6, indicating that airline executives should
consider investing in CSER or CSR, as it may increase company value (Lee and Park, 2010).
Although there are a few studies on the topic of sustainability in the airline industry, it remains an
under-explored topic (Lynes & Andrachuk, 2008). A case study conducted on the motivations of
CSER in SAS found reasons to believe that CSER activities can enhance airlines’ market
performance (Lynes & Andrachuk, 2008). The main motivations for engaging in CSER included
financial benefits, ability to anticipate future legislation, being a good corporate citizen, increased
company value through image or branding, pressure from industry stakeholders and national
culture (Lynes & Andrachuk, 2008). As the study by Lynes and Andrachuk (2008) was the first to
look at such relationship in the airline industry, current research remains in an embryonic stage.
5 Carbon-offsetting programs have been introduced by British Airways, Scandinavian Airlines, Dragon Air and
Cathay Pacific, and are designed to let customers participating in the funding of environmental projects (Lee and Park, 2010).
3.5 The Norwegian Airline Industry
Norway is a geographically challenging country to travel in. The long stretches and hilly landscape
make automotive and train transportation difficult, especially during the harsh winter months.
Furthermore, the health of the economy and steady income from the oil industry makes
Norwegians well off in terms of personal economy. The average Norwegian person flies four
times a year, compared to twice a year for the average European (Norwegian Air Shuttle ASA,
2014) and the airline industry is largely controlled by to main airlines. Scandinavian Airlines AB
(SAS) and Norwegian Air Shuttle ASA (Norwegian) together account for 73% of the total
passenger market share (Avinor, 2013b, p. 12).
3.5.1 Regulations
Up until the end of the 1980s, the Norwegian airfare was heavily regulated. Before 1987,
individual national routes were limited to one airline (SAS) and prices, number and time of
departures were all regulated by the national government (Salvanes, Steen, & Sørgard, 2003). In
October 1987, a second airline (Braathens) was admitted to certain routes and in April 1994, all
routes7 were deregulated and open for competition (Salvanes et al., 2003). The two existing
airlines’ “50-50” market share was now open to competition from other players (Salvanes et al.,
2003).
CO2 emission tax was introduced on domestic flights in 1999 (Bærekraftig og Samfunnsnyttig
Luftfart, 2011). Progressive increase of the tax has been implemented, and in 2011 the tax
accounted for 0.69 NOK per liter of fuel (Bærekraftig og Samfunnsnyttig Luftfart, 2011, p. 24).
This totals in approximately 270 NOK per ton of CO2 emission
8, although it is slightly higher for
Jet A-1 (i.e. diesel and domestic heating oil) (Bærekraftig og Samfunnsnyttig Luftfart, 2011, p. 24).
Furthermore, an NOx-tax was introduced in 2007 (Bærekraftig og Samfunnsnyttig Luftfart, 2011,
p. 24). Airlines have the choice of paying the 17.33 NOK per kilogram NOx, or a 4 NOK per
kilogram to the N0x-bond where the money gets reinvested in emission reduction initiatives (Toll
Customs, 2014, p. 48). Identical tax on international flights remains absent due to its interference
with international regulations (Toll Customs, 2014, p. 11). In January 2012, all European air
transport was integrated in the European Union Emissions Trading System (EU ETS)
(Bærekraftig og Samfunnsnyttig Luftfart, 2011). Although the price of emission allowances has
remained stable after the financial crisis, these are expected to increase to €40 in 2020 and €100 in
2030 (Bærekraftig og Samfunnsnyttig Luftfart, 2011, p. 24).
7 Except for ”kortbanenettet”
3.5.2 Scandinavian Airlines AB
From Danske Luftfartselskab A/S (DDL), Det Norske Luftfartselskap A/S (DNL) and Svensk
Interkontinetal Lufttrafik AB (SILA), SAS was formed in 1946 (SAS Group, 2004). As the only
airline in the world with double environmental accreditation (ISO14001 and EMAS), SAS
consistently pride itself as one of the most environmentally conscious companies in the airline
industry (SAS Group, 2004).
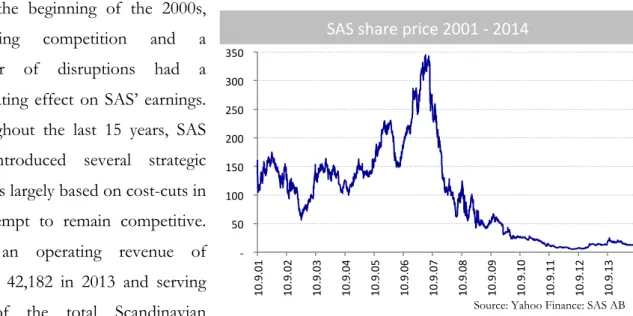
Since the beginning of the 2000s,
increasing competition and a
number of disruptions had a
devastating effect on SAS’ earnings.
Throughout the last 15 years, SAS
has introduced several strategic
changes largely based on cost-cuts in
an attempt to remain competitive.
With an operating revenue of
MSEK 42,182 in 2013 and serving
1/3 of the total Scandinavian
passenger market, SAS remains the largest airline in Scandinavia (SAS Group, 2013). Figure 2 is a
graphical representation of SAS’ share price from 2001 throughout 2014.
3.5.3 Norwegian Air Shuttle ASA
Norwegian is a low-cost airline
established in 1993 and with 416
routes, it is the second largest airline
in Scandinavia (Norwegian Air
Shuttle ASA, 2014). The airline
recently decided to renew and
extend its fleet park and invest
heavily in more fuel-efficient
aircraft. Norwegian currently has the
most modern and environmentally
friendly park with an average age of
4.8 years (Norwegian Air Shuttle ASA, 2014). Norwegian had an operating revenue of MNOK
15,580 in 2013 and a marked share at Oslo Gardermoen Airport of 40% (Norwegian Air Shuttle -‐
50 100 150 200 250 300 350
10.
9.
01
10.
9.
02
10.
9.
03
10.
9.
04
10.
9.
05
10.
9.
06
10.
9.
07
10.
9.
08
10.
9.
09
10.
9.
10
10.
9.
11
10.
9.
12
10.
9.
13
SAS share price 2001 -‐ 2014
Source: Yahoo Finance: SAS AB
0 50 100 150 200 250 300 350
18.
12.
03
18.
12.
04
18.
12.
05
18.
12.
06
18.
12.
07
18.
12.
08
18.
12.
09
18.
12.
10
18.
12.
11
18.
12.
12
18.
12.
13
Norwegian share price 2003 -‐ 2014
Source: Yahoo Finance: NAS ASA Figure 3: Norwegian share price
ASA, 2014). Figure 3 is a graphical representation of Norwegian’s share price from IPO in 2003
throughout 2014.
3.5.4 Disruptions
The study focus is on four selected shocks occurring in the period 2001 – 2010. The four selected
shocks are listed in Table 2.
Table 2: Shocks
Disruption Date Sustainability
Performance
Share price analyzed from
Terrorist Attack 9/11 11.09.2001 1999 - 2001 10.09.2001
Financial Crisis 2007 - 2008 2005 - 2008 08.08.2007
Ryanair open base in Norway 30.09.2009 2000 - 2002 30.04.2009
Eyjafjallajökull Eruption 04.04.2010 2008 - 2010 15.04.2010
September 11th, 2001
The financial year of 2000 was a promising year for the airline industry. Scandinavian Airlines
delivered an EBT of MSEK 2,773 with optimism for the future (SAS Group, 2000, p. 4). To
renew the fleet according to their 10% growth strategy over the next years, SAS invested in twelve
new Airbus A321s (SAS, 2000, p.4), an order which was claimed to contribute to making SAS the
most environmental friendly airline in Europe (SAS, 2000, p.4).
The promise of future growth and prosperity was soon put on hold when an economic downturn
became reality in the summer of 2001. The tragic and completely unexpected terrorist attack on
September 11th was followed by the Linate accident on October 8th, where SAS was involved and
118 people tragically lost their lives. Additionally, SAS and Maersk were fined by the European
Commission for infringement on European competition law and the year resulted in an EBT of
MSEK -1,140 (SAS, 2001, p.4).
Financial Crisis
The second shock under investigation in this study was purely of economic nature and might
consequently thrust certain differences. Norwegian went public in 2003, allowing us to
acknowledge their performance before, during and after this shock. In the years prior to the
financial crisis, Norwegian pursued an aggressive growth strategy. Although delivering red
stated in the annual report, “we are certain that the expansion is necessary to increase the value and
profitability on a longer term” (Norwegian, 2006, p.4). Norwegian delivered an EBT of MNOK 5.3 in
2008, down from MNOK 113 in 2007.
SAS Group was struggling with several ongoing internal conflicts in the years approaching the
financial crisis. However, there were no signs of an economic slowdown and SAS announced
several new routes. 2006 was also SAS’ best year in terms of environmental performance, low fuel
consumption per unit and a good environmental index. In the following year, both Danish and
Swedish cabin crew went on strike. Additionally, SAS experienced problems with the Dash 8
Q400s aircraft, when the landing gear collapsed during landing on three different occasions. The
devastating economic turmoil during the year of 2008, coupled with the SAS internal conflict and
production surge, led to an EBT of MSEK -395 (SAS Group, 2008, p. 2).
Ryanair
The third shock under investigation is Ryanair’s establishment of a base at Moss Rygge Airport.
Still recovering from the financial crisis, SAS and Norwegian delivered divergent results.
Norwegian passed their 10-million passenger mark, resulting in an EBT of MNOK 623 and
making it the best financial year in the airline’s history. IATA forecasted a loss of global airline
traffic equal to a total MUSD 11,000 in 2009, however Norwegian managed to oppose the norm
by increasing the total revenues, and traffic from Oslo Gardermoen Airport by 15% (Norwegian
Air Shuttle ASA, 2009, p. 18). SAS unfortunately experienced the negative earnings anticipated by
IATA. With an EBT of MSEK -1.7 the year 2009 was challenging for SAS (SAS Group, 2009, p.
2).
Eyjafjallajökull
The fourth and final shock undertaken by this research is the sudden and unexpected shock of the
Icelandic volcano eruption. SAS delivered an EBT of MSEK -435 in 2010, and Core SAS cost
saving program received an additional 2.5 billion SEK in funding (SAS Group, 2009, p. 6). In
2010, Norwegian had positive EBT of MNOK 243, down from MNOK 623 in 2009. A large
portion of this is due to their heavy investments associated with the aggressive growth strategy
(Norwegian Air Shuttle ASA, 2010).
This section uncovered all major events occurring in the timeframe of the shocks. The following
section covers a thorough description and explanation of the methodological choices made for
4
METHODOLOGY
As described in the previous chapter, the airline industry serves as a great example of a turbulent
market affected by technological innovations, business-model innovations, environmental
changes as well as several unexpected events. This chapter aims to give a thorough description of
the methodological choices of this study. Frankness and transparency are heavily emphasized
throughout the chapter. Firstly the chapter covers the case study approach and industry
justification, before a candid explanation of the quantitative and qualitative data collection
procedure and analysis is presented.
4.1 Case Study
The choice of conducting qualitative research is based on the nature of the topic. Current studies
on sustainability have largely been built on quantitative data with dependent variables associated
with financial and economic performance (Cochran & Wood, 1984; Griffin & Mahon, 1997;
Seifert et al., 2004; Wokutch & Spencer, 1987). This study aims to build a new theory on the
relationship between sustainability and resilience. As sustainability performance incurs costs and
resources to a different set of stakeholders than shareholders, the probability of seeing a direct
effect of sustainability on measures of financial performance is unlikely (Margolis et al., 2009).
According to the forefathers of grounded theory, conducting qualitative research is an attempt to
better understand the underlying factors, the structures, processes and deviances in more complex
systems (Glaser & Strauss, 1967), which accurately describes the nature of this study. At a later
stage of the theory development, quantitative studies will become a central part of testing the
developed theory. By taking on a comparative analysis approach, one generates conceptual
categories or evidence, which is later derived to describe a concept and altogether a theoretical
abstraction of the topic of study (Glaser & Strauss, 1967).
Given that the topic of research is rather new and not well defined, the approach of conducting a
case study is justified. Blumberg, Cooper, and Schindler (2011) describes case studies as “an
empirical inquiry that investigates a contemporary phenomenon within its real-life context [...]” (p. 256) and the
objective of a case study is to investigate a contemporary problem in order to develop “new
explanations and theoretical dispositions” (p. 256). The case study is built on extensive qualitative data
derived from semi-structured interviews and triangulated by quantitative analysis of the respective
firms.
4.2 The Choice of the Norwegian Airline Industry
Norway’s relatively stable economic performance, especially after 2008, allows the study to be
airline industry and its performance. The same year as the Brundtland Commission expressed
concerns for sustainable development; the Norwegian airline industry was strongly deregulated
and opened up for increased competition in 1987 (Salvanes, Steen and Søgard, 2003, p 386). The
stable economy and social system in Scandinavia allows people time to concentrate on issues,
such as the sustainability of firms, indicating that the Norwegian people might be more socially
and environmentally conscious than people from other nations (Lynes & Andrachuk, 2008, p.
382). The airline industry shows a strong push towards social and environmental consciousness
due to the heavy pollution typically associated with air travel (Lynes & Andrachuk, 2008, p.382).
The combination of the stable Norwegian economy, focus on sustainability and the number of
global disruptions, makes the Norwegian airline industry an ideal market for conducting such
study.
4.3 Quantitative Data Collection and Analysis
In order to secure validity and reliability of the study, the case study relies on multiple sources of
evidence (Blumberg et al., 2011). Following the suggestion from Glaser and Strauss (1967) the use
of both qualitative and quantitative methods is executed. The quantitative data is not testing the
qualitative data, instead they complement each other and are used for mutual verification in order
to build a well-rounded theory (p.18). Applying multiple sources of data is also referred to as
triangulation by Blumberg et al. (2011).
The most recent annual reports of SAS and Norwegian are analyzed and the most recent
quantitative data on sustainability performance is collected from the two airlines. SAS publishes
annual sustainability reports and have done so since 1996. Norwegian has at the time of writing
no publicly available sustainability reports. A thorough analysis of the company’s annual report
from the period of 2002 (Norwegian IPO was 2003) is conducted as a means of discovering
sustainability-related performance indicators. The “Environment” and “Corporate Governance”
sections are analyzed in order to determine Norwegian’s sustainability performance. SAS’
sustainability reports from the period 1999-2013 are analyzed and data on sustainability
performance indicators is extracted. The data extracted distinguishes between social (internal and
external) and environmental sustainability.
Resilience is measured in term of stabilization of the share price after four major shocks of
different nature. The share prices of SAS in the period of 2001-2014 and of Norwegian from
2003-2014 is collected from Yahoo Finance. By creating an indexed share price chart it is possible
to accurately compare the share price reaction to the shocks, controlling for the differences in size
just before the occurrence of the individual disruptions, e.g. 10.09.2001 for the September 11th
terrorist attacks. The date where the share price re-bounces and reaches its pre-disruption level is
identified and the number of months from the occurrence of the disruption is calculated. With
this approach, the analysis provides a better understanding of the resilience of airlines, i.e. their
ability to return to equilibrium after a disturbance (Pimm, 1991). The longevity of decreased share
price is analyzed together with data on sustainability performance.
Through the selection of a variety of disruptions ranging from financial, environmental, market
and terrorism shocks, the validity of the findings is greater. The chosen dates assume all
shareholders have perfect information, thus an efficient market. For instance, although threats
from Al Qaeda were sent to US intelligence agencies prior to 9/119, no investors had inside
information and thus the share price resembles that of an efficient market (Fama, 1970, p. 383).
The first initial indicator of the severity of the 2008 credit crunch was discovered when the
European Central Bank (ECB) created loans available to 49 banks and financial institutions on
August 9th, 2007 (BBC News, 2007). Conducting an analysis starting from August 8th 2007 is
therefore justified.
Although Ryanair started flying to Norway in 1997, their activity was limited to one airport and a
few destinations. On September 30th, 2009, Ryanair opened base at Moss Rygge Airport
south-east of Oslo (Center for Aviation, 2009). Given the large amount of speculations and publicity,
the decision was made to analyze the share price a priori, starting six months before the base was
opened. Lastly, the Icelandic volcano eruption took place on April 4th 2010 and the ash cloud
halted the air traffic a few days late on April 15th (Ormsby, 2010).
4.4 Qualitative Data Collection and Analysis
The qualitative analysis takes the form of semi-structured in-depth interviews. As the case study is
used to understand the issues related to the situation or get a better understanding of the thoughts
behind the sustainability processes, the qualitative interviews prove appropriate (Blumberg, 2011,
p.265).
A total number of five interviews were conducted over a period of three weeks, with each
interview lasting approximately 60 minutes. In order to limit bias, the respondents are chosen
from a wide variety of functional areas, groups and hierarchical levels (Eisenhardt & Graebner,
2007). The interviewees were contacted via e-mail and LinkedIn and received information limited