A simple model for solute–solvent separation through
nanopores based on core-softened potentials
Cláudia K.B. de Vasconcelos
a,b, Ronaldo J.C. Batista
c, McGlennon da Rocha
Régis
d, Taíse M. Manhabosco
c, Alan B. de Oliveira
c,∗ aEscola de Minas, Universidade Federal de Ouro Preto, Ouro Preto, MG 35400-000, Brazil bDepartamento de Física e Química, PUC Minas, Belo Horizonte, MG 30535-901, Brazil cDepartamento de Física, Universidade Federal de Ouro Preto, Ouro Preto, MG 35400-000, Brazil dInstituto Federal de Minas Gerais – Campus Congonhas, Congonhas, MG 36415-000, Brazilh i g h l i g h t s
• Simple model for solute–solvent separation based on core-softened potentials.
• Molecular dynamics simulations of complex fluids.
• Reverse osmosis for water desalination.
a r t i c l e i n f o
Article history:
Received 1 December 2015
Received in revised form 11 January 2016 Available online 26 February 2016
Keywords:
Solute–solvent separation Core-softened potentials Molecular dynamics Water desalination Reverse osmosis
a b s t r a c t
We propose an effective model for solute separation from fluids through reverse osmosis based on core-softened potentials. Such potentials have been used to investigate anoma-lous fluids in several situations under a great variety of approaches. Due to their simplic-ity, computational simulations become faster and mathematical treatments are possible. Our model aims to mimic water desalination through nano-membranes through reverse osmosis, for which we have found reasonable qualitative results when confronted against all-atoms simulations found in the literature. The purpose of this work is not to replace any fully atomistic simulation at this stage, but instead to pave the first steps towards coarse-grained models for water desalination processes. This may help to approach problems in larger scales, in size and time, and perhaps make analytical theories more viable.
©2016 Elsevier B.V. All rights reserved.
1. Introduction
The separation of dissolved solute from a solution is an important subject from both technological and scientific perspectives. The canonical example is the purification of water, in which water must be separated from solutes, as ions or heavy metals, for example, in order to be suitable for consumption. Processes for obtaining clean water are generally inefficient and in most cases tend to be prohibitively expensive. The seawater desalination seems to be a promising alternative: despite approximately 97% of the water is concentrated in the oceans and seas the percentage of potable water obtained through salt–water separation is still very small [1]. Examples of water–salt separation processes are distillation, reverse osmosis (RO), thermal desalination and freezing [1–6]. Reverse osmosis is particularly important and it consists
∗Corresponding author. Tel.: +55 31 3559 1677.
E-mail address:[email protected](A.B. de Oliveira).
http://dx.doi.org/10.1016/j.physa.2016.02.035
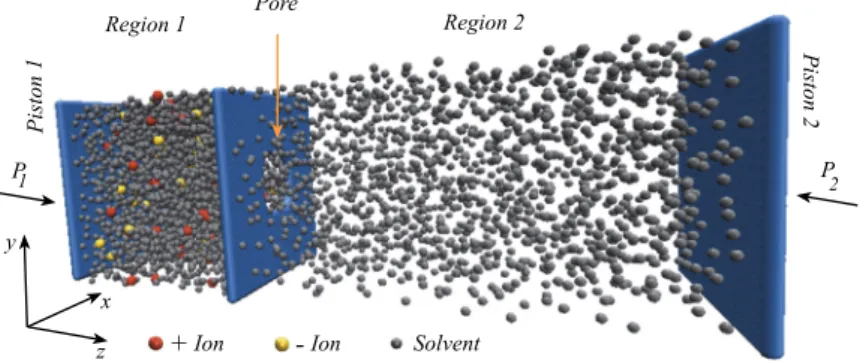
Fig. 1. System model we used for separating solute from solvent through nanopores. The mixture of solvent and ions, initially localised in the Region 1, is pushed by a piston against a middle membrane. The circular pore in its center prioritises the passage of solvent once ions are effectively bigger than solvent particles.
of forcing water to pass through a semipermeable membrane by applying an external pressure bigger than the osmotic pressure of the fluid, while the membrane is responsible to retain most of the particles dissolved in the water. Conventional RO membranes used for this purpose are expensive and not very efficient: water transport is slow and there are issues in controlling the membrane selectivity [7]. Researches in this area generally aim to reduce the specific energy consumption, increasing water recovery and lowering the pressure difference between feed and permeate sides [8–11].
RO mechanisms for water desalination based on nanostructures as semipermeable membranes have obtained encouraging results [7,12–21]. The size exclusion promoted by nanopores seems to be an important ingredient when such structures are used as filters.
In this context, the water–ions separation through nanostructures subject gained attention from scientific community, who have intensified the efforts in order to understand the main mechanisms responsible for water desalination in such a nanometric level [7,13,14,17,18,22–37].
For example, Qi Chen and Xiaoning Yang have recently reported a molecular simulation study of pyridinic nitrogen doped nanoporous graphene as desalination membrane [20]. Their results indicate that these membranes are capable of rejecting salt ions and increase the water flow and permeability in several orders of magnitude if compared with existing processes of water–salt separation. The authors have established that the desalination performance is sensitive to pore size and membrane’s hole chemical functionalisation [20].
Despite the cited encouraging results, the water desalination problem is typically macro. Considering the modern computational power available, it is literally impossible to study this problem using an all-atoms approach in a macro size scale. In this sense, it is important to seek for cheaper, alternative procedures to tackle this problem. An alternative to computationally model water-like fluids in an effective manner relies on core-softened potentials. Systems modelled through these potentials generally present several features present in water. For example, they possess density, diffusion, and structural anomalies. Many core-softened potential based systems show a liquid–liquid critical point separating a high density liquid phase from a low density liquid one, as hypothesised for liquid water [38–58]. Core-softened potentials treat anomalous fluids (water being the most famous case) in an effective way, in a manner that there is no directionality (interactions between particles are pairwise only) neither the presence of charges. No major arguments seem necessary in order to convince the reader that the absence of these ingredients turn core-softened models extremely cheap to simulate. Those kinds of models were explored in depth not only by computer but also by means of theoretical tools due to their simplicity [57–68]. Successive good results gave support to the use of core-softened potentials in more complicated environments, such as mimicking a salty solution [69], water in nanotubes [70,71], confined between plates [72–74] and in contact with nanopores [75]. Following this spirit, we propose in this work the use of core-softened potentials as a building block for a simple system able to reproduce the main features of water–salt separation all-atoms simulations. We show that it is possible to build a system which qualitatively reproduces the results of more sophisticated systems in a fraction of time. Even though some work are still necessary to fine tuning the core-softened based model presented in this work, we believe this study is a first step to extrapolate the water desalination through nanostructures process to a more realistic number of particles scale.
This paper is organised as follows. Computational details are given in Section2while the results and discussion are made in Section3. Section4ends the text with the conclusions of the work.
2. Computational details
Energies and lengths are given in terms of well-known Lennard-Jones parameters
ϵ
(energy) andσ
(length), respectively. All the other quantities investigated here can be reduced to dimensionless forms if written in terms ofϵ
,σ
,mand Boltzmann constantkB. For example, pressurePis given in terms ofϵ/σ
3, timeτ
is written in terms of
m
σ
2/ϵ
, and temperature in terms ofϵ/
kB.Molecular dynamics simulations were performed with the LAMMPS package [76] in the canonical ensemble using the Nosé–Hoover thermostat [77]. We have investigated two cases as follows. (i) Case 1, in which the Piston 2 is kept immobile while Piston 1 compresses the fluid. (ii) Case 2, where we have applied external pressures in both Piston 1 and Piston 2. The simulations were divided into equilibration and production stages. In both Case 1 and Case 2, the equilibration stage was subdivided into two substages as follows. First, the solute–solvent system was evolved during 150,000 steps with initial temperatureT
=
2 and final temperatureT=
1 (the pore was kept blocked during the whole equilibration stage in order to prevent particle permeation). Secondly, the system was simulated for further 150,000 steps atT=
1, when configurational energy and pressure showed to be stable, i.e., fluctuate around average values. Additionally, in the Case 2 the system was simulated for further 200,000 steps atT=
1 with an external pressure applied in the Piston 2. This pressure was chosen so that it equals the osmotic pressure of the fluid. For determining such a pressure, we allowed the Piston 2 to fluctuate and investigated pressures applied upon it (P2) from 0.1 up to 3 in reduced units, at intervals of 0.1, when 1500 solvent particles are confined in Region 2 atT=
1. We found that forP2=
2.
3ϵ/σ
3 the Piston 2 fluctuates around its initial position, demonstrating that the pressure exerted by the fluid equals the external applied pressure.Following the equilibration stage, the production stage consisted in (i) deleting atoms responsible for blocking the pore located in the middle wall, (ii) applying an external pressure in the Piston 1, and (iii) simulating the whole system for up to 5
×
106steps, depending on the quantity of interest under investigation. The timestep used in all runs was 0.001 in reduced units. All quantities of interest were averaged over five independent simulations and error bars are smaller than symbols in all figures.For the interaction between solvent particles we used the core-softened potential proposed by de Oliveira and collaborators [43,78], which reads
Uss
ϵ
=
4
σ
rss
12−
σ
rss
6
+
α
exp
−
1γ
2
rss
−
r0σ
2
(1)
σ
andϵ
are Lennard-Jones parameters whileα
=
5,γ
=
0.
7, andr0=
σ
are related to the shape of the gaussian term.rss is the distance between pairs of solvent particles.The ion–ion potential was described by the repulsive part of the Lennard-Jones potential plus a Coulombic interaction as
Uii
ϵ
′=
C z1z2rii
+
Θ
(σ
′−
rii)
uLJ(
rii),
(2)whereΘ
(
R)
is the Heaviside step function, in whichΘ(
R<
0)
=
0 andΘ(
R≥
0)
=
1, anduLJ
(
rii)
=
4
σ
′ rii
12−
σ
′ rii
6
.
z1andz2can take values
+
1 or−
1, corresponding to the valence of ions. Here,σ
′=
3σ
andϵ
′=
ϵ
.C/σ
′=
1/
4 is a constant associated to the strength of the Coulombic term. The cutoff distance for the Coulomb potential was 7.
5σ
′[79]. Interactions were directly computed between pairs of particles for distances less than the cutoff. For distances greater than the cutoff, Particle Particle–Particle Mesh scheme was adopted [80].The interaction between the solvent and ion particles was described by a Lennard-Jones potential,
Usi
ϵ
′′=
4
σ
′′ rsi
12−
σ
′′ rsiwith
σ
′′=
(σ
+
σ
′)/
2=
2σ
. Forϵ
′′we have followed Luk˘si˘c and coworkers approach [69], in which they defined the solvent–ion interaction asϵ
′′/
kBT=
(
T∗sTel∗
)
−1/2.Ts∗=
kBT/ϵ
is the reduced solvent temperature,Tel∗=
σ
′/λ
Bis the reduced temperature of the restricted primitive model for electrolyte solutions andλ
B=
Cϵ/
kBT is the Bjerrum length. After little calculation, one findsϵ
′′=
ϵ
√
C/σ
′=
ϵ/
2.This entire solvent–solute model was conceived based on the work of Luk˘si˘c and coworkers [69], where structural and thermodynamic properties of a very similar solvent–solute model were investigated. In their work it was investigated by means of Monte Carlo and Integral Equations, how the presence of ions interferes in the appearance of density, diffusion, and structural anomalies. Following Luk˘si˘c and colleagues considerations, we are aware that the knowledge of properties of this ion–solvent simple model is far from complete. It is necessary to explore the solubility of ions, isothermal compressibility, heat capacity at constant pressure, and the effects of solvent/solute size ratios in order to compare our results to more complex approaches. Such an investigation goes beyond the purposes of our work. For now, we believe our results give reasonable evidences that we are on the right track for building a simple, effective ion–solvent model which can capture the salty water main dynamic and thermodynamic features in a RO process.
Particles composing pistons and wall interact with solvent and solute ones through the repulsive part of the Lennard-Jones potential with energy strength
ϵ
. Size of pistons and wall particles was set to 2σ
.In order to compare our results with the ones from all-atoms simulations, we focused on three quantities of interest as follows. (i) Solute rejection against external applied pressure for different pore areas, (ii) number of filtered ions as a function time, and (iii) the dependence of solvent volume flow rate with external applied pressure. This quantity is the volume of filtered fluid per time and gives an estimate of the efficiency of the system setup.
The solute rejectionRis calculated using the following equation
R
=
1
−
N1/2 N0
,
(3)whereN0is the initial number of solute particles in the Region 1 andN1/2is the number of solute particles in Region 2 at the time in which half of solvent particles have passed from Region 1 to Region 2. This definition forRcoincides with the one used by Chen and collaborators [20] and Zhu and colleagues [21]. Both have used molecular dynamics simulations to study a solution of water and ions passing through nano-membranes. According to Eq.(3), ifN1/2
=
0 (which means zero permeate ion) a membrane shows 100% solute rejection orR=
1. On the other hand, for a zero rejection membrane the number of solute particles in the Region 2 must be identical toN0andR=
0.3. Results
3.1. Case 1: Piston 2 fixed
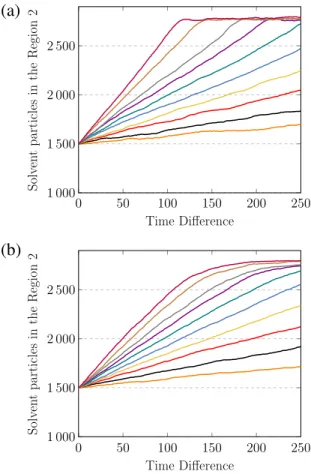
Our results for this case are shown inFigs. 2–4. The number of solvent particles in the Region 2 as a function of time for two different pore areas is summarised inFig. 2. Each curve corresponds to a different value of external pressure applied to the Piston 1 and from bottom to top they are 2.0, 3.0,. . . , 9.0, 11.0 and 13.0 in units of
ϵ/σ
3. For determining the initial time in this figure, i.e.t=
0, we wait until half of solvent particles have passed to Region 2 in order to assure an steady state flow regime. The dependence between the number of solvent particles filtered and time assumes a consistent linear regime, having bigger slopes for bigger external pressures, as expected. After a certain time, the flow of solvent through the pore stops due to the finitude of system and this effect is represented by the saturation seen in the curves. Naturally, this point is reached sooner for bigger holes. Our results are very similar to those reported in the literature for simulation of water desalination processes through nano-membranes [13,20,37].Regarding the volume flow rate
φ
as a function of applied pressure, we see fromFig. 3that the dependence between these two quantities is also well described by a linear function. We present this figure for different pore areas and the symbols were obtained by calculating the number of filtered solvent particles over time, dN/
dt, (the slope of curves shown inFig. 2) times 1/ρ
1, whereρ
1 is the solvent number density in the Region 1. Lines in this figure are linear regressions through simulated data. This result is expected since it will pass more solvent with increasing hole sizes. The linear dependence for such a parameter with pore area is not straightforward at first sight and the physics behind this result can be developed by Hagen–Poiseuille’s model as follows. The quantity of fluid per timeΦwhich flows in a tube of internal radiusRand lengthℓ
is proportional to the pressure differences between the two sides,1P, asΦ=
D1P, where the constantDdepends on R,ℓ
and fluid’s viscosityη
. This model may hold for a case of an effective tube of very smallℓ
around the pore.Fig. 2. Number of solvent particles in the Region 2 as a function of the time difference (see the text for details regarding the definition for time difference). Each curve corresponds to a different value of external pressure applied to the Piston 1 and from bottom to top they are 2.0, 3.0,. . . , 9.0, 11.0 and 13.0 in units ofϵ/σ3. The results are shown for two different pore areas: (a) 46.3σ2and (b) 17.7σ2.
Fig. 3. Solvent flow rateφas a function of applied pressure for different pore areas. Symbols are simulated data and lines are linear fittings through the data.
3.2. Case 2: Piston 2 under external pressure
Fig. 4. Solute rejection percentage as a function of applied pressure for different areas. Symbols are simulated data and lines are linear fittings through the data.
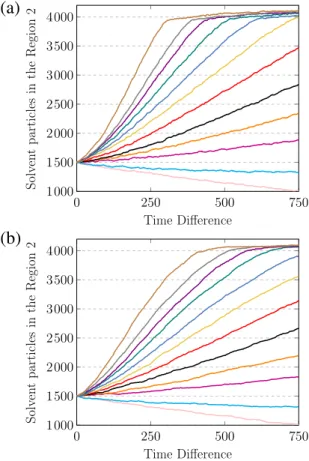
Fig. 5. Number of solvent particles in the Region 2 as a function of time difference for pore areas (a) 46.3σ2and (b) 17.7σ2. Each curve corresponds to a
pressure differences1P=P1−P2= −1.0,0,1.0, . . . ,9.0, and 11.0 in units ofϵ/σ3(from bottom to top).
not present in a liquid-to-liquid system and will likely overestimate salt rejection and underestimate water permeation. In this sense, we believe the Case 2 presented here is more realistic.
Fig. 6. Same curve shown inFig. 5(a) (1P=8ϵ/σ3) stressing the different regimes seen for solvent filtered over time. This result agrees with the findings
of Nicolaï, Sumpter, and Meunier for studying water desalination across graphene oxide framework membranes [18].
Fig. 7. Solvent flow rate as a function of applied pressure for different pore areas for the case with two pistons under external pressures. When pressures in the feed side (P1) and permeate side (P2) become the same (1P=P1−P2=0) the solvent flow tends to vanish. Symbols are simulated data and lines
are linear fittings through simulated data.
flow is negative, i.e., particles go from Region 2 to Region 1, as expected. The overall picture seen in this figure resembles the results of Hu et al. who have used imidazolate framework-8 as a reverse osmosis membrane for water desalination [16]. Borrowing Nicolaï, Sumpter, and Meunier terminology for studying water desalination across graphene oxide framework membranes [18], we define short times behaviour as equilibration regime, in which the flow in solvent particles is not yet constant in time. For longer times, the curves saturate due to the already mentioned finitude of the system. The three regimes are evident inFig. 6, in which we show the curve for1P
=
8ϵ/σ
2(same curve shown inFig. 5(a)).Fig. 7shows the solvent flow rate as a function of applied pressure for different pore areas. The behaviour is similar to that presented inFig. 3. Here curves must cross the origin since it is expected that
φ
=
0 at1P=
0.Fig. 8. Solute rejection percentage of a porous membrane as a function of the applied pressure for different areas. Symbols are simulated data and lines are linear fittings through data.
are generally passivated with hydrogen, hydroxyl groups, nitrogen and other substances, which we did not take under consideration. We may further explore this point by changing the interactions between fluid and pore border in order to mimic pore functionalisation with different elements.
4. Conclusion
In this work we propose a simple computational model for solvent–solute separation through reverse osmosis using a membrane with a circular pore. This system aims to mimic the water desalination reverse osmosis through semi-permeable nano-membranes. Despite we still must investigate thermodynamic and dynamic details of our solvent–solution model, as for example solubility of ions, isothermal compressibility, heat capacity at constant pressure, and the effects of solvent/solute size ratios, we have reasonable qualitative results which agree with fully atomistic simulations found in the literature. The quantities we have investigated are number of solvent particles filtered over time as a function of pressure and pore area, solute rejection against pressure for different pore areas, and solvent flow rate, a quantity which is proportional to the volute of solvent filtered over time, as a function of applied pressure and pore area. We do not aim at this stage to replace any fully atomistic simulation neither we are able to givequantitativeresults based on our model. Our purpose is to pave the first steps towards coarse-grained models so that the nanoscale barrier, in size and time, can comfortably be crossed when simulating the separation of solute from fluids. For doing that, we have used core-softened potentials which have been successfully used to describe anomalous fluids (like water) for at least a decade in a wide variety of situations, from bulk to highly confined environments as into nanotubes.
Acknowledgements
A.B.O thanks the Brazilian science agency CNPq by financial support through the grant number 459852/2014-0. C.K.B.V. thanks CAPES for her Ph.D. fellowship. R.J.C.B. thanks FAPEMIG for financial support through the Pesquisador Mineiro grant.
References
[1] M. Elimelech, W.A. Phillip, The future of seawater desalination: energy, technology, and the environment, Science 333 (6043) (2011) 712–717.
[2] K. Spiegler, Y. El-Sayed, The energetics of desalination processes, Desalination 134 (1) (2001) 109–128.
[3] D. Zhou, L. Zhu, Y. Fu, M. Zhu, L. Xue, Development of lower cost seawater desalination processes using nanofiltration technologies—a review, Desalination 376 (2015) 109–116.
[4] G. Blandin, A.R. Verliefde, C.Y. Tang, P. Le-Clech, Opportunities to reach economic sustainability in forward osmosis–reverse osmosis hybrids for seawater desalination, Desalination 363 (2015) 26–36.
[5] K.C. Ng, K. Thu, S.J. Oh, L. Ang, M.W. Shahzad, A.B. Ismail, Recent developments in thermally-driven seawater desalination: Energy efficiency improvement by hybridization of the med and ad cycles, Desalination 356 (2015) 255–270.
[6] C. Xie, J. Sun, Q. Lv, C. Miao, S. Chu, L. Zhang, High efficient seawater freezing desalination technology by utilizing cold energy of lng, IDA J. Desalin. Water Reuse 6 (1) (2014) 5–9.
[7] J. Kou, X. Zhou, H. Lu, F. Wu, J. Fan, Graphyne as the membrane for water desalination, Nanoscale 6 (3) (2014) 1865–1870.
[8] T.H. Chong, S.-L. Loo, W.B. Krantz, Energy-efficient reverse osmosis desalination process, J. Membr. Sci. 473 (2015) 177–188.
[9] A. Zhu, P.D. Christofides, Y. Cohen, Effect of stream mixing on ro energy cost minimization, Desalination 261 (3) (2010) 232–239.
[10]A. Zhu, P.D. Christofides, Y. Cohen, Minimization of energy consumption for a two-pass membrane desalination: effect of energy recovery, membrane rejection and retentate recycling, J. Membr. Sci. 339 (1) (2009) 126–137.
[11]A. Zhu, P.D. Christofides, Y. Cohen, Effect of thermodynamic restriction on energy cost optimization of ro membrane water desalination, Ind. Eng. Chem. Res. 48 (13) (2008) 6010–6021.
[12]F. Perreault, A.F. de Faria, M. Elimelech, Environmental applications of graphene-based nanomaterials, Chem. Soc. Rev. 44 (2015) 5861–5896.
desalination, Desalination 336 (2014) 97–109.
[23]J. Kou, X. Zhou, Y. Chen, H. Lu, F. Wu, J. Fan, Water permeation through single-layer graphyne membrane, J. Chem. Phys. 139 (6) (2013) 064705.
[24]D. Rish, S. Luo, B. Kurtz, T. Luo, Exceptional ion rejection ability of directional solvent for non-membrane desalination, Appl. Phys. Lett. 104 (2) (2014) 024102.
[25]Y. Liu, X. Chen, Mechanical properties of nanoporous graphene membrane, J. Appl. Phys. 115 (3) (2014) 034303.
[26]M.V. Ramallo, An effective-charge model for the trapping of impurities of fluids in channels with nanostructured walls, Nanoscale Res. Lett. 8 (1) (2013) 1–7.
[27]Z.-Y. Yang, L.-J. Jin, G.-Q. Lu, Q.-Q. Xiao, Y.-X. Zhang, L. Jing, X.-X. Zhang, Y.-M. Yan, K.-N. Sun, Sponge-templated preparation of high surface area graphene with ultrahigh capacitive deionization performance, Adv. Funct. Mater. 24 (25) (2014) 3917–3925.
[28]D. Cohen-Tanugi, R.K. McGovern, S.H. Dave, J.H. Lienhard, J.C. Grossman, Quantifying the potential of ultra-permeable membranes for water desalination, Energy Environ. Sci. 7 (3) (2014) 1134–1141.
[29]M. Hu, B. Mi, Enabling graphene oxide nanosheets as water separation membranes, Environ. Sci. Technol. 47 (8) (2013) 3715–3723.
[30]Z.E. Hughes, C.J. Shearer, J. Shapter, J.D. Gale, Simulation of water transport through functionalized single-walled carbon nanotubes (SWCNTs), J. Phys. Chem. C 116 (47) (2012) 24943–24953.
[31]P. Sun, H. Liu, K. Wang, M. Zhong, D. Wu, H. Zhu, Selective ion transport through functionalized graphene membranes based on delicate ion–graphene interactions, J. Phys. Chem. C 118 (33) (2014) 19396–19401.
[32]H. Chen, E. Ruckenstein, Nanomembrane containing a nanopore in an electrolyte solution: A molecular dynamics approach, J. Phys. Chem. Lett. 5 (17) (2014) 2979–2982.
[33]M. Bartolomei, E. Carmona-Novillo, M.I. Hernández, J. Campos-Martínez, F. Pirani, G. Giorgi, K. Yamashita, Penetration barrier of water through graphynes? pores: First-principles predictions and force field optimization, J. Phys. Chem. Lett. 5 (4) (2014) 751–755.
[34]C. Sun, M.S. Boutilier, H. Au, P. Poesio, B. Bai, R. Karnik, N.G. Hadjiconstantinou, Mechanisms of molecular permeation through nanoporous graphene membranes, Langmuir 30 (2) (2014) 675–682.
[35]D. Konatham, J. Yu, T.A. Ho, A. Striolo, Simulation insights for graphene-based water desalination membranes, Langmuir 29 (38) (2013) 11884–11897.
[36]M. Thomas, B. Corry, T.A. Hilder, What have we learnt about the mechanisms of rapid water transport, ion rejection and selectivity in nanopores from molecular simulation? Small 10 (8) (2014) 1453–1465.
[37]M. Heiranian, A.B. Farimani, N.R. Aluru, Water desalination with a single-layer mos2 nanopore, Nature Commun. 6 (2015) 8616.
[38]M.R. Sadr-Lahijany, A. Scala, S.V. Buldyrev, H.E. Stanley, Liquid-state anomalies and the stell-hemmer core-softened potential, Phys. Rev. Lett. 81 (22) (1998) 4895.
[39]G. Franzese, G. Malescio, A. Skibinsky, S.V. Buldyrev, H. Stanley, Generic mechanism for generating a liquid–liquid phase transition, Nature 409 (6821) (2001) 692–695.
[40]S.V. Buldyrev, H.E. Stanley, A system with multiple liquid–liquid critical points, Physica A 330 (1) (2003) 124–129.
[41]G. Franzese, G. Malescio, A. Skibinsky, S.V. Buldyrev, H.E. Stanley, Metastable liquid–liquid phase transition in a single-component system with only one crystal phase and no density anomaly, Phys. Rev. E 66 (5) (2002) 051206.
[42]A.B. de Oliveira, M.C. Barbosa, Density anomaly in a competing interactions lattice gas model, J. Phys.: Condens. Matter 17 (3) (2005) 399.
[43]A.B. de Oliveira, P.A. Netz, T. Colla, M.C. Barbosa, Thermodynamic and dynamic anomalies for a three-dimensional isotropic core-softened potential, J. Chem. Phys. 124 (8) (2006) 084505.
[44]P.J. Camp, Structure and phase behavior of a two-dimensional system with core-softened and long-range repulsive interactions, Phys. Rev. E 68 (6) (2003) 061506.
[45]P.J. Camp, Dynamics in a two-dimensional core-softened fluid, Phys. Rev. E 71 (3) (2005) 031507.
[46]G. Malescio, G. Franzese, A. Skibinsky, S.V. Buldyrev, H.E. Stanley, Liquid–liquid phase transition for an attractive isotropic potential with wide repulsive range, Phys. Rev. E 71 (6) (2005) 061504.
[47]P. Hemmer, G. Stell, Fluids with several phase transitions, Phys. Rev. Lett. 24 (23) (1970) 1284.
[48]E. Velasco, L. Mederos, G. Navascués, P. Hemmer, G. Stell, Complex phase behavior induced by repulsive interactions, Phys. Rev. Lett. 85 (1) (2000) 122.
[49]P. Hemmer, E. Velasco, L. Mederos, G. Navascués, G. Stell, Solid–solid transitions induced by repulsive interactions, J. Chem. Phys. 114 (5) (2001) 2268–2275.
[50] E.A. Jagla, Phase behavior of a system of particles with core collapse, Phys. Rev. E 58 (1998) 1478.http://dx.doi.org/10.1103/PhysRevE.58.1478. [51] N.B. Wilding, J.E. Magee, Phase behavior and thermodynamic anomalies of core-softened fluids, Phys. Rev. E 66 (2002) 031509.http://dx.doi.org/10.
1103/PhysRevE.66.031509.
[52]P. Kumar, S.V. Buldyrev, F. Sciortino, E. Zaccarelli, H.E. Stanley, Static and dynamic anomalies in a repulsive spherical ramp liquid: Theory and simulation, Phys. Rev. E 72 (2) (2005) 021501.
[53]L. Xu, P. Kumar, S.V. Buldyrev, S.-H. Chen, P.H. Poole, F. Sciortino, H.E. Stanley, Relation between the widom line and the dynamic crossover in systems with a liquid–liquid phase transition, Proc. Natl. Acad. Sci. USA 102 (46) (2005) 16558–16562.
[54]H.M. Gibson, N.B. Wilding, Metastable liquid–liquid coexistence and density anomalies in a core-softened fluid, Phys. Rev. E 73 (2006) 061507.
[55]Z. Yan, S.V. Buldyrev, N. Giovambattista, H.E. Stanley, Structural order for one-scale and two-scale potentials, Phys. Rev. Lett. 95 (13) (2005) 130604.
[56]R. Sharma, S.N. Chakraborty, C. Chakravarty, Entropy, diffusivity, and structural order in liquids with waterlike anomalies, J. Chem. Phys. 125 (20) (2006) 204501.
[57]J.B. Caballero, A.M. Puertas, Density anomaly and liquid–liquid transition from perturbation theories, Phys. Rev. E 74 (5) (2006) 051506.
[58]K.R. Hadley, C. McCabe, Coarse-grained molecular models of water: a review, Mol. Simul. 38 (8–9) (2012) 671–681.
[59]A.B. de Oliveira, E.B. Neves, C. Gavazzoni, J.Z. Paukowski, P.A. Netz, M.C. Barbosa, Liquid crystal phase and waterlike anomalies in a core-softened shoulder-dumbbells system, J. Chem. Phys. 132 (2010) 164505.
[60]S. Egorov, Structural and dynamical properties of a core-softened fluid in a supercritical region, J. Chem. Phys. 129 (2) (2008) 024514.
[61]S. Egorov, Waterlike dynamic anomalies in a liquid described by a core-softened potential, J. Chem. Phys. 128 (17) (2008) 174503.
[62]A.B. Adib, Algebraic perturbation theory for dense liquids with discrete potentials, Phys. Rev. E 75 (6) (2007) 061204.
[64]S. Zhou, A. Lajovic, A. Jamnik, Local structures of fluid with discrete spherical potential: Theory and grand canonical ensemble monte carlo simulation, J. Chem. Phys. 129 (12) (2008) 124503.
[65]O. Pizio, H. Dominguez, Y. Duda, S. Sokołowski, Microscopic structure and thermodynamics of a core-softened model fluid: Insights from grand canonical monte carlo simulations and integral equations theory, J. Chem. Phys. 130 (17) (2009) 174504.
[66]L.A. Shall, S.A. Egorov, Structural and dynamical anomalies of a gaussian core fluid: A mode-coupling theory study, J. Chem. Phys. 132 (18) (2010) 184504.
[67]S. Zhou, New free energy density functional and application to core-softened fluid, J. Chem. Phys. 132 (19) (2010) 194112.
[68]S. Egorov, Hydrophobic interactions with coarse-grained model for water, J. Chem. Phys. 134 (23) (2011) 234509.
[69]M. Lukšič, B. Hribar-Lee, V. Vlachy, O. Pizio, Structural and thermodynamical properties of charged hard spheres in a mixture with core-softened model solvent, J. Chem. Phys. 137 (24) (2012) 244502.
[70]J.R. Bordin, A.B. de Oliveira, A. Diehl, M.C. Barbosa, Diffusion enhancement in core-softened fluid confined in nanotubes, J. Chem. Phys. 137 (8) (2012) 084504.
[71]J.R. Bordin, A. Diehl, M.C. Barbosa, Relation between flow enhancement factor and structure for core-softened fluids inside nanotubes, J. Phys. Chem. B 117 (23) (2013) 7047–7056.
[72]L.B. Krott, M.C. Barbosa, Anomalies in a waterlike model confined between plates, J. Chem. Phys. 138 (8) (2013) 084505.
[73]L.B. Krott, J.R. Bordin, Distinct dynamical and structural properties of a core-softened fluid when confined between fluctuating and fixed walls, J. Chem. Phys. 139 (15) (2013) 154502.
[74]L.B. Krott, M.C. Barbosa, Model of waterlike fluid under confinement for hydrophobic and hydrophilic particle-plate interaction potentials, Phys. Rev. E 89 (1) (2014) 012110.
[75]J.R. Bordin, L.B. Krott, M.C. Barbosa, Surface phase transition in anomalous fluid in nanoconfinement, J. Phys. Chem. C 118 (18) (2014) 9497–9506.
[76]S. Plimpton, Fast parallel algorithms for short-range molecular dynamics, J. Comput. Phys. 117 (1) (1995) 1–19.
[77]W.G. Hoover, Canonical dynamics: equilibrium phase-space distributions, Phys. Rev. A 31 (3) (1985) 1695.
[78]A.B. de Oliveira, P.A. Netz, T. Colla, M.C. Barbosa, Structural anomalies for a three dimensional isotropic core-softened potential, J. Chem. Phys. 125 (12) (2006) 124503.
[79] One of the referees argued that a smaller cutoff should be used seen that we employed the PPPM scheme for calculation of the Coulombic interaction for distances beyond the cutoff. Indeed, we found the referee is right by repeating some of our calculations using a cutoff of 3σ′obtaining virtually the same results and saving computational time.