Abstract
This paper discusses the implementation of federal and municipal assessment
systems in Brazil, and how it has inluenced the educational debate and newly shaped policies. The empirical analyses focus on public municipal schools in Rio de Janeiro and test the plausibility of the school composition efect theory. The approach combines different datasets provided by the Rio de Janeiro
Educational Department: a) Prova Rio – longitudinal assessment for all public
schools; b) Pupil Profile – longitudinal assessment with information on all pupils, including family proile and school placement. Evidence from diferent models suggests the plausibility of school-mix efect theory. Data corroborates the claim that at least part of a purported “school efect” could be explained by a particular mix of pupils.
Keywords: Educational assessment. School segregation. School composition efect.
1 Introduction
This papers aims to test the plausibility of the school composition efect theory or school-mix efect in Rio de Janeiro public schools1. Since Coleman’s (1961) pioneering
report there has been increasing concern about the social composition of schools and its
relation to pupils’ outcomes. Coleman was most interested in understanding the nature
of school efectiveness and appropriateness of policies to raise school efectiveness. The studies that followed that report identiied two ideal-typical positions. The irst claims that school efectiveness is a function of school management and teacher performance,
a Universidade Federal do Rio de Janeiro, Programa de Pós-Graduação em Educação – PPGE-UFRJ. Rio de Janeiro, Rio de Janeiro, Brasil.
Recebido em: 29 jan. 2016 Aceito em: 25 abr. 2016
1 The outcomes presented in this paper are the result of the PhD thesis “School Segregation in Rio de Janeiro Public Schools: Causes and Consequences” – Post Graduation Program in Education at the Federal University of Rio de Janeiro. The authors thank Stephen Gorard, Durham University, for helpful suggestions. Study supported by CAPES (Observatório da Educação), CNPq (produtividade de pesquisa) and Santander Mobility Grant, Durham University.
Evidence of a school composition
effect in Rio de Janeiro public schools
while the latter claims that social factors (social background) determine pupils’ outcomes in schools (THRUPP; HIRSCH, 2006). In this respect, the social composition2 of
schools can be seen as one more factor that can determine pupils’ outcomes.
The study can be divided into three parts. The irst part discusses, initially, the
implementation of national and municipal assessment systems in Brazil and how it
has inluenced the educational debate and newly shaped policies in the past twenty years. The aim is not to present a detailed historical analysis, but to reveal how the availability of reliable comparable data across schools (standardized tests and educational census information) has inluenced the implementation of new policies and the educational debate regarding assessment, especially in the public sector.
The second part describes Rio de Janeiro public municipal system and presents the debate about school segregation. There is extensive literature about the subject, covering measurement of the overall levels, and highlighting the impact of educational policies. Previous studies have been focused on understanding
the causes of segregation (especially the role of the current educational policies)
and have not explored any potential impact on pupils’ achievement and life chances.
The third and last part presents two complementary models to test the school
composition efect theory in Rio de Janeiro public schools (RAUDENBUSH; BRYK, 2002; HARKER, 2004; GORARD, 2006).
The school composition efect will be taken as an intermediate theory, in between those featured in the schematic model above. Dealing with “school-mix” means taking into account both school management (decisions on enrolment, pupils and teacher allocation, as well as the array of speciic activities performed in each school) and pupils’ social background (language, motivation and all other cultural and economic characteristics of pupils’ social environments). The social
composition of a school stems from these two sources.
The subject of school segregation should be taken seriously by educational researchers. It is closely linked to the debate about the quality and equity of educational systems and to the subject of social justice. Public schools in modern societies have become central institution that should provide, at least in theory, equal opportunities for all individuals, enabling social mobility. Evidence from diferent educational systems suggests that clustering pupils with similar characteristics can inluence how they are treated at school, the quality of teaching,
the aspiration to advanced education subsequent to the compulsory level, and an increasing association between academic achievement and socio-economic status. (HAAHR ET AL., 2005; EGGRES, 2005; ROSENTHAL; JACOBSON, 19683).
The indings presented in this paper can be of relevance for policy makers and
educational researchers, since pupil composition impact on school performance
assumes a central position in the debate about school efectiveness. Usually, the school composition efect does not enter into oicial judgments about school performance. This has even more relevance for countries, or cities like Rio de Janeiro, that have implemented high-stake policies. It may be that schools, or even teachers, are being wrongly held responsible for their school’s performance. The school composition efect could explain part of the variance that is usually attributed to school management and teacher performance. The evidences and arguments
presented here are intended to enhance prudent use of educational assessment.
2 Educational assessment in Brazil
Large-scale assessment policies have been implemented in Brazil since the 1990s, and, ever since then, have provoked signiicant controversy. The Ministry of Education
introduced the Sistema de Avaliação da Educação Básica, formed of mathematics
and Portuguese tests applied to a representative sample of students at this school level, throughout the country’s 27 states. Speciically, out of the total of 12 Basic4
Education grades, the testing involved the 5th, 9th and 12th. Progressively, the majority of the states and many large cities created their own test-based assessment systems.
As of 2005, in the public school sytems, the national tests began to be applied to all students in the 5th and 9th grades, taking place every two years. On the other hand, in private schools, testing continues to be conducted in a sampling regime. In an interval of two decades, under the command of two government coalitions with intense rivalry between5, the country has shifted from educational systems
with a predominance of pedagogic currents, averse to the idea of assessment, to full incorporation of large-scale testing as part of the school quotidian and of the process of educational policy-making. Furthermore, it may be said that the
federal educational assessment system is one of the elements that characterize
some stability observed in the Brazilian educational policies in this period.
3 A controversial study referred here to recognize its importance in order to highlight the possible efects of grouping pupils.
4 There are nine grades – fundamental – and three more – corresponding to high school (Ensino Médio), in Brazil. 5 In 2003, President Fernando Henrique Cardoso, who, during his 8-year period in oice, had had a single Minister of
In 2009, Rio de Janeiro city, following the example of several states and some other large Brazilian cities, established its own test-based student educational
assessment system. To this system, from which part of the data used in this article
originates, has been added an already existing computerized system of school and student records, established in 2003, which can be considered to be of good quality, and has constantly undergone improvement since then. Thus, the Rio de Janeiro Municipal Education Department has preliminary mechanisms at its disposal for adoption of evidence-based policies, and has indeed been adopting them since 2009. Only in 2007 the Federal Government implemented an educational database at student level for all schools in the country, but, since the 1930s, it has availed itself of educational censuses featuring condensed information at school level.
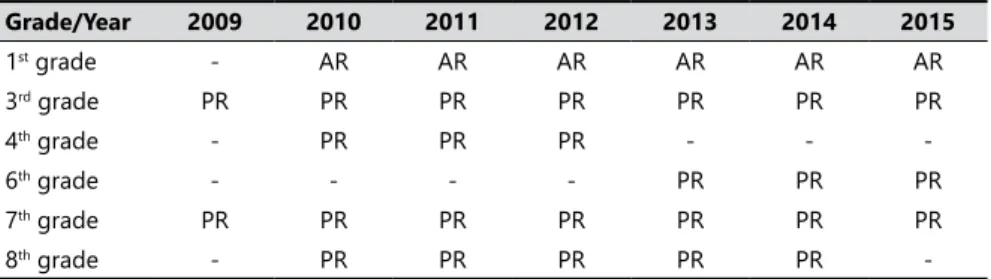
The speciic test conducted in Rio de Janeiro city, Prova Rio, has been applied since 2009 to the whole universe of 3rd and 7th grades students in the compulsory
school system, in attendance on the examination date. From 2009 to 2015, a few changes have been implemented in the assessment system. Table 1 presents the
years and grades where Rio de Janeiro Educational Department applied its own
standardized tests: a) Alfabetiza Rio (AR) for 1st graders and; b) Prova Rio (PR)
for subsequent grades.
Considering its compulsory character, the fact its results are measured on the same
scale as SAEB and Prova Brasil, and the grades to which it is applied, Prova Rio can be regarded as complementary to Prova Brasil, generating the possibility of longitudinal analyses, as a cohort can be followed throughout at least two years.
Just as around the world, the information derived from these assessments, almost always the average results of the tests, receive much publicity in the press, above all, when the overall results observed are poor. If there is consensus that the Brazilian
Table 1. Grades and years when Prova Rio (PR) and Alfabetiza Rio (AR) were administered.
Grade/Year 2009 2010 2011 2012 2013 2014 2015
1st grade - AR AR AR AR AR AR
3rd grade PR PR PR PR PR PR PR
4th grade - PR PR PR - -
-6th grade - - - - PR PR PR
7th grade PR PR PR PR PR PR PR
8th grade - PR PR PR PR PR
educational indicators are hardly bearable (VELOSO et al., 2009), incompatible with the country’s level of economic development, when it comes to the issue of the relevance of the assessment systems, there is wholesale controversy. The debate may be divided into two major currents. The irst, involving a broad majority in the academic sphere, rejects the assessment systems, above all, on the grounds of political and ideological arguments. It highlights supposed imposition by international bodies, supposed privatizing interests against the ideals of public education: universal, free and a social leveler. A more trade unionist line of this
current, opposed to the tests, emphasizes their incapacity to faithfully portray the
reality of schools, their supericiality and the stress they cause in the professional ambit, a line close to Ravitch’s (2010) arguments.
We shall not occupy ourselves here with majority current’s position, as it exceeds the objectives of this article, but we do consider it indispensable to deal with the questions it presents, above all in the trade unionist line6.
We align ourselves among those who consider the creation of assessment systems a great advance in view of the immense challenges facing Brazilian education. However, we are critical of some aspects of the policies that are taken as cornerstones, above all, due to technical questions scarcely discussed in our context. The caution in the interpretation of the results, above all, regarding the adoption of sophisticated mathematical models that should provide precise information about the quality and development of schools, does not seem to integrate suiciently well into our spectrum of debate (GORARD, 2010; GORARD; HORDOSY; SIDDIQUI, 2012). Minimalist
scales are adopted, generally disregarding high margins of error in the measurements.
In the ambit of the human sciences in general, more particularly in the ield of education, almost no Brazilian university provides reasonably good training in
the research methods area, especially those needed to deal with data on a large
scale. This lack hinders the understanding of results that are the fruit of a long maturation period in educational assessment and facilitates the easiest vein of strictly political discourse, with fragile support in terms of data. On the other hand, among the minority segments of the academic world with a background indispensable for technical discussion of the assessment models adopted and their results, there are few individuals who are not linked directly or indirectly to the few large agencies that dispute the huge educational assessment market. Within the educational systems, in their bureaucracies, purchasers of assessment packages in this thriving market, it is extremely rare to come across qualiication
that allows the codiication in depth, the debate, the questioning of the results and the policy decisions derived from them.
The relections developed in this article, adopting information from a large-scale educational assessment system, but arising from a strictly academic ield, are intended to contribute to thinking about our educational challenges, taking assessment on a large-scale as indispensable for such, but presenting some possible gaps in theories about school-efect and in the value-added models
they often adopt. The emphasis on school segregation aspects, on dimensions
directly conditioned by bureaucratic educational action, is not aimed at replacing school-eicacy approaches, but rather at contributing to their improvement.
3 School segregation in an open enrolment system
The city of Rio de Janeiro has the largest municipal educational system in Brazil.
There are around 1,400 schools providing nursery, pre-school and fundamental education. The organization of grades and levels at the schools is as follows: a) Pre-School for pupils 4–5 years old and was not compulsory; b) Fundamental Education is compulsory, attended by pupils 6–14, usually divided into ive initial grades (First Segment) and the last four grades (Second Segment); c) High School, caters for pupils aged 15–17 and was not compulsory7.
Harris (2012) highlights that social segregation between schools has to be considered as a consequence of residential segregation, admission policies and
parental choice, which are presumed to correlate with social, economic and
cultural isolation. It is relevant to mention that this phenomenon is observed in every single educational system in which there are available data. In some countries, for example Germany, it is possible to observe policies that would presumably increase segregation by pupil ability (tracking policies). However, other countries with very diverse policies show a similar picture. Why is that? What are the possible causes of school segregation?
The real challenge in this type of research is to disentangle each one of these
elements (explanation variables) and to show how they impact segregation. Maybe the most relevant question for the educational ield is: what is the role of policy on the levels of school segregation? There are three key elements that have been analyzed in Rio de Janeiro: a) irst enrolment; b) unfettered movement of pupils across schools; b) “school shift” allocation (BARTHOLO, 2014).
7 Pre-School and High School are now mandatory, starting in 2016. Rio de Janeiro’s Municipal system does
not ofer high school, as almost the whole municipal systems in Brazil. Public High Schools are usually under
In general terms, the municipal public system, not only in Rio de Janeiro, but also in other cities in Brazil, can be described as a comprehensive school system. There are no big diferences between schools and, at least in theory, all public schools should provide the same curriculum. However, municipal and state schools are attended just by the lower classes. The middle and upper classes, with very few exceptions, are enrolled in private schools. This fact has some implications for our analyses. In Rio de Janeiro, since 2009, the enrolment in private schools, considering Fundamental Education (pupils from 6 to 14 years old), has been increasing around 1% per year and in 2014 adds up to 33% of all enrolments.
Despite the fact that there are no formal school choice policies in Rio de Janeiro,
the current legislation allows parents to exercise choice (open enrolment). Some additional policies, such as free public transport for pupils, potentially increase the possibility of attending a school far from home (BARTHOLO, 2014).
If parents’ purported freedom of choice can be proven, it is also crucial to highlight that school staf (usually represented by the principal) has some control over their intake, especially in the case of oversubscription. Logic suggests that schools with better reputations, on average, present higher oversubscription rates and, therefore, could potentially select their pupils. It is a vicious circle where: a) school intakes are correlated to school reputation; and b) the potential to select
pupils can enhance the school reputation.
The unfettered movement of pupils across schools should be a concern for policy makers. Saporito (2003), analyzing the impact of Magnet Schools in Philadelphia, showed that the transfers were not random and could have an impact on school segregation. Bartholo (2014) observed a similar outcome in Rio de Janeiro public schools. Around one third of pupils change schools between the 1st and 5th grade.
Admission practices that combine social selection with patrimonialistic practices by civil servants have been reported in Rio de Janeiro since 1950 (Consorte, 1959). Recent evidence has shown that a personal connection between the pupil’s family and a member of the administrative staf was a common strategy to gain access to the most prestigious schools (COSTA; PRADO; ROSISTOLATO, 2013).
for the lack of new schools construction. There are reports about Rio de Janeiro during the 1970s, when there were schools that presented four daytime “shifts”, with short student journeys.
Today, the most common situation is a school with two daytime “shifts” (morning and afternoon), but it is still possible to observe schools with a third – known as the “night shift”. The night classes are mostly for high school students, and
complementary for youths and adults in primary and secondary education.
Undoubtedly, there is an efort to increase the total time pupils spend at school each day, which necessarily demands one “shift” for each school.
Maybe the most relevant information for research purposes is the criteria to allocate pupils into “shifts”. Since there is no speciic regulation or clear criteria, it is the school bureaucracy that makes the inal decision. It is possible to state that the school staf has control over: a) the access to a school; b) the allocation of pupils to a “school shift”. In reality, what characterizes the “shift policy” is the absence of any regulation regarding the allocation of pupils.
Bartholo and Costa (2014) has shown that the allocation of potentially disadvantaged pupils across “school shifts” is far from being a random distribution. The author used the Dissimilarity Index (D) (Duncan; Duncan, 1955) and the Segregation Index (GS) (GORARD; TAYLOR; FITZ, 2003) to capture the “net efect” of the school “shift” allocation8. The research design compares the segregation levels,
where every “school shift” is a single unit, difering from the usual approach that considers the “school building” as a single unit (disregarding the allocation of pupils across the “shifts”). Any diferences observed in every year should be considered the “shift efect”.
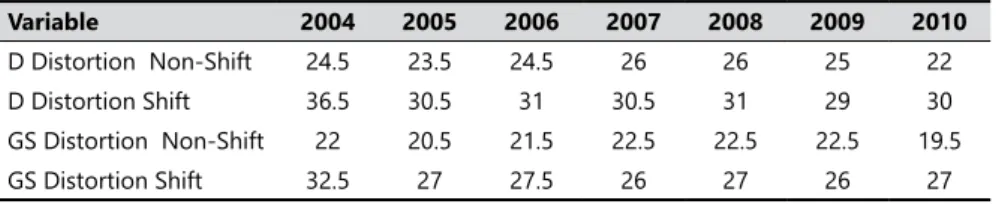
Evidence suggests that pupils are being systematically selected based on prior educational attainment (variable: age/grade distortion). The non-random allocation can increase the nominal levels of school segregation by 50%. Table 2 presents the igures for the Dissimilarity Index and the Segregation Index considering all pupils enrolled in the irst segment of fundamental education
(1st to 5th grade) for one key variable: age/grade distortion. The calculations
where replicated throughout seven years to test for robustness. This is a clear example of legislation inluencing the social composition of schools (Bartholo; Costa, 2014).
So far, there is no clear evidence about the potential impact of school segregation on pupils’ achievement and life chance. Most of the studies conducted in Rio de Janeiro observed a very limited number of schools, and used interviews or observations to analyze any potential impact. The next section presents a simple model to test the school-mix efect theory, using data for all municipal schools.
4 Evidence of school composition effect
This section presents evidence about the potential impact of school composition on pupils’ achievement in Rio de Janeiro municipal public schools. This section is divided into three parts. The irst part initially presents the basis of the theory about the school composition or school-mix efect and an overall view about previous studies in diferent countries. The second part discusses in detail the type of data available, their
main limitation and the means designed to test the theory. The third part presents the
results and highlights the implications for policy-makers and educational researchers.
It is clear that schools difer in their proportions of potentially disadvantaged pupils, and these igures are associated with overall levels of attainment. Thus, a school with pupil intake with high prior attainment and low levels of family poverty (for example), generally produces higher outcomes compared to schools with a less favorable pupil intake proile. The nature of school intake should be considered in a value-added analysis to estimate the “school-efect”.
It is reasonable to assume that some schools function better than others and produce better results (pupils’ attainment level). The next step is to observe the characteristics of the more efective schools. It is possible that they were disproportionately distributed, with large clusters of students with desirable characteristics. The least efective schools might be those with disproportionately large clusters of disadvantaged pupils (perhaps family poverty). This is the claim for a school composition efect, which means that at least part of the school efect can be explained by a particular mix of pupils (GORARD, 2006).
Table 2. Dissimilarity Index (%) and Segregation Index (%) for Distortion age/grade Considering All Pupils Enrolled in the 1st Segment.
Variable 2004 2005 2006 2007 2008 2009 2010
D Distortion Non-Shift 24.5 23.5 24.5 26 26 25 22
D Distortion Shift 36.5 30.5 31 30.5 31 29 30
GS Distortion Non-Shift 22 20.5 21.5 22.5 22.5 22.5 19.5
GS Distortion Shift 32.5 27 27.5 26 27 26 27
The literature about school-mix efect has been extensive in many countries, and, while it is probably correct to state that most evidence favors the existence of such an efect, there is no consensus (THRUPP, 1997; NASH, 2003; GORARD, 2006). The basis of the disagreement relies on theoretical and methodological issues.
Not many studies have given substantive considerations on how (the mechanism) school composition might afect pupil outcome. Thrupp (1999), in an ethnographic study on working and middle class schools, outlined three diferent mechanisms: a) peer subculture; b) teaching and the curriculum; c) school policies.
The author claims that peer subcultures might either support school aims and processes or resist them. Schools with a disproportionate share of disadvantaged pupils (pupils living in poverty, for instance) are more likely to face classroom disruption. In turn, teaching and curriculum might be changed to seek to capture their interest, or to deal with daily problems in school. More time is spent, at the policy level, on issues of discipline and ways of funding activities that are not related to traditional disciplines. Thrupp (1999) believes that school composition has a signiicant impact on school and individual performance.
Nevertheless, other authors claim that there might also be an indirect efect of clustering disadvantaged pupils in speciic schools. Perhaps the most important point is the relationship between teacher allocation and school composition (Lauder et al., 2010). Some might argue that “ghetto schools”, or the so-called “sinking schools”, might recruit less experienced or less motivated teachers. Often, and this is the case of the Rio de Janeiro public system, more experienced teachers have priority in choosing their school of preference, and this creates the basis for an association between teacher proile and school composition. This is called an “indirect” efect of school composition on pupils’ performance, because it impacts other elements (in this case, the quality of teaching) that are also associated with school efectiveness.
There are two major issues with respect to the methodology: sampling and techniques. Thrupp, Lauder and Robinson (2002) have established what they agree would be ideal with respect to modelling and sampling for school-mix efect. It is reasonable to assume that at least part of the disagreement regarding the efects of school composition can be attributed to diferences in the techniques used in previous studies.
This is relevant because school composition efects are more likely to appear in more segregated schools. For example, the peer subculture efect is more probable
in schools that concentrate a large proportion of pupils with shared characteristics.
Second, a full set of individual variables, including prior attainment, need to be
included in the model. The authors suggest measurements of social class and
not simply measurements of Free School Meal, which has been typically used in the UK and the US. Kounali et al. (2007) have shown that Free School Meals Measurement is not a good predictor of subsequent performance.
Third, the authors highlight that there should be measurements to capture the possible correlations among the theoretical dimensions of school composition (for example, school organizational and management processes, peer group processes, teaching, etc.). Unfortunately, there are no reliable measurements in the datasets for these dimensions. Fourth, the studies should, whenever possible, be longitudinal. Fifth, the studies should conduct their analysis using appropriate
statistical methods that respect the dependence structure characterizing such data
(for example, multi-level modelling).
The next section will discuss in detail the data used to test the hypotheses about school-mix efect and their main limitations. Not all the criteria described here are met in the study for two main reasons. First, there is a limitation in the variables available. There is not much information about the schools’ operation and the teaching in the classroom. Second, there is a limitation regarding the data quality, more speciically, the large number of missing data.
5 Research design: How to test the school-mix
effect theory?
The variables available to test the school-mix-efect theory are limited. There are three major sources of problems. First, there is no good information about
school management and classrooms teaching. Second, despite the fact that all
pupils in a speciic cohort are eligible to participate in Prova Rio, there is large
proportion of missing data – around 18% – referring to the number of pupils who did not take the test, or there is lack of or no information at all on their family background. Because the model is longitudinal, the total number of pupils excluded from the analysis can reach 30%. Third, the standardized measurement
for pupil’s attainment (Prova Rio) was designed using Item Response Theory
in each individual test does not cover the entire scale of IRT. This means that the error at individual level is high, which could make any attempt to estimate individual scores or longitudinal models misleading.
In order to test the plausibility of the school-mix efect theory, three distinct characteristics of potentially disadvantaged pupils were chosen based on previous research in the Rio de Janeiro public schools: a) non-white pupils; b) pupils’ parents that have not inished high school; c) families that are eligible to receive “Bolsa Família” – proxy of poverty – conditional cash transfer policy from the Federal Government (BARTHOLO, 2014).
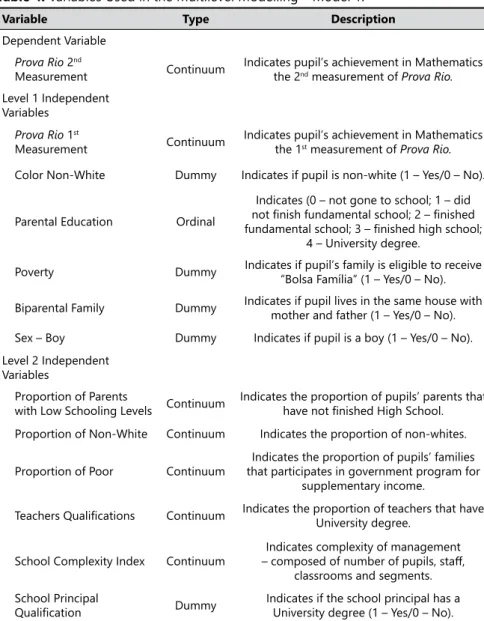
The limitations mentioned above impose the construction of two diferent models. A two level hierarchical model aims to observe if the school social composition helps to explain part of the variance in pupils’ achievement. The model estimates pupils’ achievement in mathematics at 4th grade using prior attainment (3rd grade)
and other key variables as covariant in the irst level: 1) sex; 2) color9; 3) parental
education; 4) poverty; and 5) biparental family (child lives with both father and mother, not necessarily biological). The second level variables (school level) include: 1) proportion of poor pupils; 2) proportion of non-white pupils; 3) proportion of parents’ who did not inish fundamental education; 4) Teachers qualiication; 5) School principal’s qualiication; and 6) School Complexity Index10.
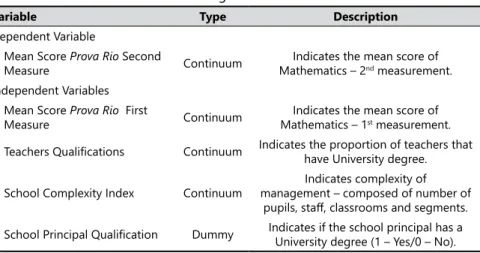
The second model uses the mean scores of Prova Rio for one year to predict the scores
for the next year in a cross-sectional design. The residues of the linear regression are correlated with the proportion of disadvantaged pupils for each school. This is a simple model to measure the strength and direction of the association between the residues of the regression and the proportion of disadvantaged pupils. In order to corroborate the initial hypothesis, the correlation coeicients must be negative and constant along diferent characteristics of disadvantaged. This model has the advantage of using Prova Rio scores at school level, which provides a more reliable measure (smaller error compared with pupil level scores).
The models presented are not a deinitive test and do not “prove” the existence of school-mix efect, mainly because they do not rule out one important alternative
9 American or European studies tend to use “ethnic background”. We think that “color” is more appropriate
to the Brazilian situation, where it is more diicult to assign the cultural dimension present in the “ethnic
background” concept.
10 The index was calculated using Factor Analysis and is composed of four variables: a) number of pupils
enrolled; b) number of classes; c) number of staf (including teachers and support staf); d) “educational segments” ofered: preschool, irst segment and second segment of Fundamental Education. The index was
explanation: school efectiveness. Schools overrepresented with pupils with desirable characteristics could, on average, despite any claim of school-mix efect, be more efective than others. The opposite could also be true. Schools overrepresented with disadvantaged pupils could be less efective. The models presented here provide the basis to demonstrate the plausibility of the school-mix efect theory.
A quick review of the criteria highlighted by Thrupp, Lauder and Robinson (2002) shows that the models proposed here fulil part of the demands. There are data available for all schools that enhance the validity of the study. The design is longitudinal, but only tracks pupils for one year. Future studies will track pupils for longer periods (for example, from the 4th to the 7th grade). The downside is
the lack of measurements related to school management and classroom teaching. This limitation should not be underestimated, since it makes it really hard to assess school efectiveness.
6 Variable construction and missing data
The variables used in this paper were described in detail by Bartholo (2014) and had been used in previous research to measure between-school segregation in Rio de Janeiro. In order to minimize the problem of missing data, all pupils who were retained at the end of the school year 201011 were tracked and incorporated into
the sample12. The main source of missing data is the Prova Rio dataset. Table 3
presents the proportion of missing data for key variables at pupil level.
The large proportion of missing data is a real problem. There is no way to ensure that pupils who did not take the test are equivalent to those who have successfully completed the assessment. Entering the independent variables in the model, the coeicients will be estimated using between two thirds and three quarters of the total population. Because of this, one strategy would be to only use prior attainment – by far the best predictor in the model – disregarding other variables at pupil level to estimate the second measurement. For this reason, all the regressions were conducted twice, that is, irst ignoring and then using pupils’ prior attainment. Table 4 presents the variables used in the multi-level model and Table 5 the variables used in the second model – school level linear regression.
11 Retention is still a major problem in public education in Brazil. In the cohort chosen (3rd grade 2010) 9% of all pupils
were retained at the end of the school year.
12 We conducted the regressions with and without pupils that were retained and the results were consistent. Coeicients
Table 4. Variables Used in the Multilevel Modelling – Model 1.
Variable Type Description
Dependent Variable
Prova Rio 2nd
Measurement Continuum
Indicates pupil’s achievement in Mathematics
the 2nd measurement of Prova Rio.
Level 1 Independent Variables
Prova Rio 1st
Measurement Continuum
Indicates pupil’s achievement in Mathematics
the 1st measurement of Prova Rio.
Color Non-White Dummy Indicates if pupil is non-white (1 – Yes/0 – No).
Parental Education Ordinal
Indicates (0 – not gone to school; 1 – did
not inish fundamental school; 2 – inished fundamental school; 3 – inished high school;
4 – University degree.
Poverty Dummy Indicates if pupil’s family is eligible to receive
“Bolsa Família” (1 – Yes/0 – No).
Biparental Family Dummy Indicates if pupil lives in the same house with
mother and father (1 – Yes/0 – No).
Sex – Boy Dummy Indicates if pupil is a boy (1 – Yes/0 – No).
Level 2 Independent Variables
Proportion of Parents
with Low Schooling Levels Continuum
Indicates the proportion of pupils’ parents that
have not inished High School.
Proportion of Non-White Continuum Indicates the proportion of non-whites.
Proportion of Poor Continuum
Indicates the proportion of pupils’ families that participates in government program for
supplementary income.
Teachers Qualiications Continuum Indicates the proportion of teachers that have University degree.
School Complexity Index Continuum
Indicates complexity of management
– composed of number of pupils, staf,
classrooms and segments.
School Principal
Qualiication Dummy Indicates if the school principal has a University degree (1 – Yes/0 – No). Source: Municipal Educational Department of Rio de Janeiro – Table drawn up in 2015.
Table 3. Proportion of Missing Data for Prova Rio Scores and Pupil Characteristics.
Variable 1
st Measurement
Prova Rio
2nd Measurement
Prova Rio Color
Parental Education
3rd Grade 2010 19% 25% 3% 9.1%
7 Is there any evidence of school-mix effect?
The results will be presented in a specific order: a) Two level hierarchical model – Model 1; b) School level regression – Model 2. Table 6 presents descriptive statistics for key variables used in Model 1 – total of 41.137 cases (pupils). Three diferent steps in developing the multilevel modelling are presented: 1) speciication of the null, or no prediction model; 2) speciication of level 1 model (pupil level); 3) speciication of level 2 model (school level). In this paper, the main interest is related to variables at the second level – social composition of schools.
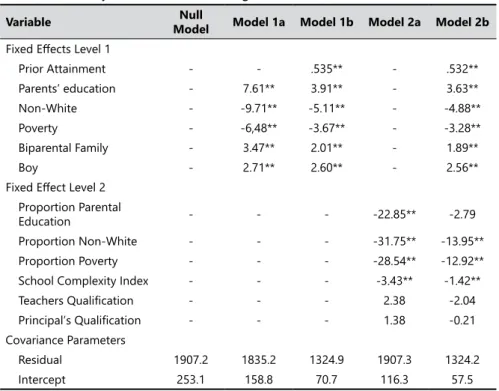
Table 7 presents a summary of all three steps. The covariance parameters indicate the proportion of variance in achievement that lies between schools is .12. The initial results of the null or no-predictors model suggest that the development of a multilevel model is warranted. The Model 1a indicates that diferent pupil’s characteristics accounts for about 4% of within-school variability in pupils’ achievement. This is one more indication that the error of measurement at pupil level is high. For this reason, Model 1b includes prior attainment (which also contains large error) in order to estimate the parameters. It is possible to observe that within-school variability is largely afected, with an increase to 30.5%.
Nonetheless, the main interest is in the efects of level 2 variables, most speciically, those that describe the social composition of schools. It is possible to observe that the proportions of disadvantaged pupils and the School Complexity Index explain about 51% of between-school variance (Model 2a). Teachers and school Table 5. Variables used in the Linear Regression – Model 2 School Level.
Variable Type Description
Dependent Variable
Mean Score Prova Rio Second
Measure Continuum
Indicates the mean score of
Mathematics – 2nd measurement.
Independent Variables
Mean Score Prova Rio First
Measure Continuum
Indicates the mean score of
Mathematics – 1st measurement.
Teachers Qualiications Continuum Indicates the proportion of teachers that have University degree.
School Complexity Index Continuum
Indicates complexity of management – composed of number of
principal’s qualiication were not signiicant (not even at .10) in both Models 2a and 2b. It should be highlighted that the distribution of teachers across public schools in Rio is quite homogeneous, creating a scenario with very little variation. Future studies should test not the qualiication of teachers and school principals,
Table 7. Summary of Multilevel Modelling – Model 1.
Variable Null
Model Model 1a Model 1b Model 2a Model 2b
Fixed Efects Level 1
Prior Attainment - - .535** - .532**
Parents’ education - 7.61** 3.91** - 3.63**
Non-White - -9.71** -5.11** - -4.88**
Poverty - -6,48** -3.67** - -3.28**
Biparental Family - 3.47** 2.01** - 1.89**
Boy - 2.71** 2.60** - 2.56**
Fixed Efect Level 2
Proportion Parental
Education - - - -22.85** -2.79
Proportion Non-White - - - -31.75** -13.95**
Proportion Poverty - - - -28.54** -12.92**
School Complexity Index - - - -3.43** -1.42**
Teachers Qualiication - - - 2.38 -2.04
Principal’s Qualiication - - - 1.38 -0.21
Covariance Parameters
Residual 1907.2 1835.2 1324.9 1907.3 1324.2
Intercept 253.1 158.8 70.7 116.3 57.5
** Coeicient is signiicant at the 0.01 level.
Source: Municipal Educational Department of Rio de Janeiro – Table drawn up in 2015.
Table 6. Descriptive Statistics of Key Variables.
Variable Mean Standard Deviation Proportion
1st Measurement Mathematics 3rd grade 161,7 47,4
-2nd Measurement Mathematics 4th grade 185,3 45,9
-Parents with Low Schooling Levels - - 0.62
Non-White - - 0.64
Poverty - - 0.36
Boys - - 0.52
Biparental Family - - 0.49
but, instead, how stable the academic staf across schools is. There is some initial evidence from qualitative studies suggesting that the most prestigious schools present low levels of academic staf turnovers. Moreover, “sinking schools” face high levels of staf turnovers, including the school’s principal (BRITO, 2009).
Model 2b allows a better understanding about the potential efect of aggregated
student characteristics in mathematics scores. Two characteristics of potentially
disadvantaged pupils were signiicant in the model even after controlling for all individual characteristics (including prior attainment). The model, therefore, suggests that the efects of student characteristics (non-white and poverty) are signiicant both within schools and between schools. This result can be interpreted as an indication of a composition efect, that is, compositional efect occurs when the aggregate of a person-level characteristic is related to the outcome, even after controlling for the efect of the individual level variable (RAUDENBUSH; BRYK, 2002; HARKER, 2004).
The initial evidence from the multilevel modelling suggests a small impact of school-mix efect on pupils’ achievement. One of the main limitations in this irst attempt is the error in math scores at individual level (SOARES, 2007).
The assessment, Prova Rio, was designed to produce reliable evidence at
school level and there is a considerable risk of misleading interpretations using individual scores.
A diferent approach tries to deal with this limitation. The aim here is to estimate
school performance using the mean scores of Prova Rio and to observe if
the residues from the linear regressions are associated with the proportion of
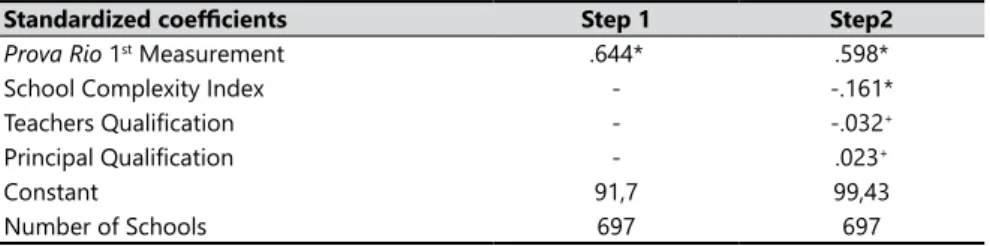
disadvantaged pupils in each school. Table 8 presents the coeicients of the linear regression. For the purpose of the research, the regression coeicients are important only to observe if they are signiicant. Once again, teachers and principal’s qualiication were not signiicant at 0.1, but the School Complexity Index appears to explain part of the variation in school performance after
controlling for prior attainment.
The real interest is to correlate the residuals from the regressions with the proportion
The total number of cases (schools) included in this correlation was 697. All correlation coeicients are signiicant at 0.01 and corroborate the initial hypothesis about a potential impact of school composition. Schools with a higher proportion of disadvantaged pupils present, on average, more negative residuals. It means that the predicted scores were overestimated in relation to the actual observations
in the second measurement of Prova Rio (dependent variable). This can also be
interpreted as a plausible evidence of school composition efect.
The data from both models fully corroborate the initial hypothesis. The fact that the study presents two distinctive approaches to test the school-mix efect theory enhances the validity of the initial results. The coeicients suggest that the potential impact of the aggregate of an individual level characteristic is small. However, it should be remembered that this particular study only used data from the public municipal schools in Rio and that it is very likely that the outcomes are underestimated, mainly because the majority of upper and middle class, with very few exceptions, being enrolled in private schools.
8 Conclusions
There is an increasing use of standardized assessment in high-stake policies across diferent cities and states in the country. These newly shaped policies have incorporated the demand for value-added models to measure school efectiveness, Table 8. Linear Regression Estimating Proiciency in Prova Rio 2011 – Cohort 3rd Grade, 2010 – Mathematics.
Standardized coeicients Step 1 Step2
Prova Rio 1st Measurement .644* .598*
School Complexity Index - -.161*
Teachers Qualiication - -.032+
Principal Qualiication - .023+
Constant 91,7 99,43
Number of Schools 697 697
* Coeicient is signiicant at the 0.01 level; + Not signiicant at 0.1.
Source: Municipal Educational Department of Rio de Janeiro – Table drawn up in 2015.
Table 9. Correlation Coeicients between Regression Residuals and Proportions of Disadvantaged Pupils – Cohort 3rd Grade, 2010.
Variable Proportion of disadvantaged pupils
Non-White Poverty Parental Education
Mathematics Step 1 -.26* -.29* -.21*
* Correlation is signiicant at the 0.01 level (2-tailed).
and they represent a second “generation” of policies that have started ranking schools by their raw scores in standardized tests. The dilemma is that, even before the irst “generation” of policies was fully debated, a new one had already been implemented.
The paper intends to stimulate the debate about Brazilian national and sub-national educational assessment systems. By pointing out the paucity of well-qualiied
technicians, our intention is to highlight that there is not enough critical mass to
enhance the use of data generated by an ever-improving educational information structure. It would not be fair to disregard the eforts being made to provide better data. INEP (the federal agency in charge of educational data) and several sub-national administrations (Rio de Janeiro must be emphasized in this set) have extended the range and consistency of our data collection.
Nevertheless, the focus on performance in the standardized tests – the results that most reverberate in the mass media – probably hides severe problems of inequality of opportunities. We believe that, nowadays, concerns regarding quality/equality are not well balanced.
The data we have used do not inform about the greatest social background diferences among Brazilian schools: those related to public/private sectors. But, even in a more homogeneous system, it is possible to ind evidence of the role of state bureaucracy, adding further sources of inequality to the most known ones (COSTA; KOSLINSKI, 2011; BARTHOLO; COSTA, 2014).
By depicting segregation between and within schools, and by advancing in research on its possible efects on pupils’ achievement, we presume to be raising
attention to a phenomenon usually not recognized in the realms of our academia
Evidências do impacto da composição social das escolas
no desempenho dos alunos na rede pública do Rio de
Janeiro
Resumo
O artigo testa a plausabilidade da teoria do “efeito mistura” ou da composição social das escolas no desempenho dos alunos. Discute também a implementação dos sistemas federal e municipais de avaliação externa e como inluenciaram o debate educacional e ajudaram a formulação de novas políticas públicas. O estudo utiliza duas bases de dados principais disponibilizadas pela secretaria municipal de educação da cidade do Rio de Janeiro: a) Prova Rio – avaliação externa que permite acompanhamento longitudinal dos alunos; b) Base Cadastro de Alunos – possui informações sobre o peril das famílias de todos os alunos matriculados na rede pública. Evidências iniciais de diferentes modelos analíticos sugerem a plausabilidade da teoria do “efeito mistura”. Os dados corroboram a hipótese que pelo menos parte do que hoje é interpretado como um “efeito escola” poderia ser explicado pela composição social das escolas.
Palavras-chave: Avaliação educacional. Segregação escolar. Efeito mistura.
Evidencia del efecto de la composición de las escuelas
públicas de Río de Janeiro
Resumen
El artículo se pone a prueba la plausibilidad de la teoría del “efecto de mezcla” o la composición social de las escuelas en el rendimiento de los estudiantes. También se analiza la aplicación de los sistemas federal y locales de evaluación externa y cómo inluyeron en el debate educativo y ayudaron a formular nuevas políticas públicas. El estudio utiliza dos bases de datos principales proporcionadas por el consejo municipal de educación de la ciudad de Río de Janeiro: a) Prueba de Río – evaluación externa que permite el seguimiento longitudinal de los estudiantes; b) Base de Estudiantes de Registro – tiene información sobre el peril de las familias de todos los estudiantes matriculados en público. La evidencia inicial de diferentes modelos de análisis sugieren la plausibilidad de la teoría del “efecto de mezcla”. Los datos apoyan la hipótesis de que al menos parte de lo que ahora se interpreta como un “efecto de la escuela” podría explicarse por la composición social de las escuelas.
References
ALVES, M. T. G.; SOARES, J. F. Contexto escolar e indicadores educacionais: condições desiguais para a efetivação de uma política de avaliação educacional. Educação e Pesquisa, São Paulo, v. 39, n. 1, p. 177-94, 2013. doi:10.1590/S1517-97022013000100012
ANDRADE, F. M. A rotatividade de diretores no contexto de responsabilização. 2015. 92 p. Dissertação (Mestrado em Educação) – Universidade Federal do Rio de Janeiro, Rio de Janeiro.
BARTHOLO, T. L. Segregação escolar na rede municipal do Rio de Janeiro: análise da movimentação de estudantes. Estudos em Avaliação Educacional,
São Paulo, v. 25, n. 58, p. 242-71, 2014. doi:10.18222/eae255820142927 BARTHOLO, T. L.; COSTA, M. Shift efect and school segregation:
discussing intra-school segregation. Cadernos de Pesquisa, São Paulo, v. 44, p. 670-92, 2014. doi:10.1590/198053142771
BRITO, M. S. Práticas e percepções docentes e suas relações com o prestígio e clima escolar das escolas públicas do município do Rio de Janeiro. 2009. 144 p. Dissertação (Mestrado em Educação) – Universidade Federal do Rio de
Janeiro, Rio de Janeiro.
COLEMAN, J. S. Social climates in high schools. Washington, DC: U.S.
Dept. of Health, Education, and Welfare, Oice of Education, 1961.
CONSORTE, J. G. A criança favelada e a escola pública. Educação e Ciências Sociais, Rio de Janeiro, v. 5, n. 11, p. 45-60, 1959.
COSTA, M.; KOSLINSKI, M. C. A Hidden-quasi-market: dispute for
common schools in Brazil. Cadernos de Pesquisa, São Paulo, v. 41, n. 142,
p. 246-66, 2011. doi:10.1590/S0100-15742011000100013
COSTA, M.; PRADO, A. P.; ROSISTOLATO, R. Talvez se eu tivesse algum conhecimento...?: caminhos possíveis em um sistema educacional público e estratiicado. Interseções, Rio de Janeiro, v. 14, n. 1, p. 165-93, 2013. DUNCAN, O. D.; DUNCAN, B. A methodological analyses of segregation indexes. American Sociological Review, v. 20, n. 2, p. 210-7, 1955.
Liége: Department of Theoretical and Experimental Education, University of Liège, [2015].
GORARD, S. Is there a school mix efect? Educational Review, Edinburgh v. 58, n. 1, p. 87-94, 2006. doi:10.1080/00131910500352739
________. Serious doubts about school efectiveness. British
Educational Research Journal, Birmigham, v. 36, n. 5, p. 745-66, 2010. doi:10.1080/01411920903144251
GORARD, S.; HORDOSY, R.; SIDDIQUI, N. How unstable are ‘school efects’ assessed by a value-added technique? International Education Studies, Toronto, v. 6, n. 1, p. 1-9, 2012. doi:10.5539/ies.v6n1p1
GORARD, S., TAYLOR, C.; FITZ, J. Schools, markets and choice policies.
London: Routledge Falmer, 2003.
HAAHR, J. et al. Explaining student performance: evidence from the international PISA, TIMSS and PIRLS surveys. Taastrup Danish Technological Institute, 2005. Disponível em: <https://www.oecd.org/edu/ school/programmeforinternationalstudentassessmentpisa/35920726.pdf>. Acesso em: 20 abr 2016.
HARKER, R. Compositional effects in school effectiveness studies: a New Zealand case study. In: AERA ANNUAL CONFERENCE, 12., 2004, San Diego, CA. New Delhi, Agricultural Economics Research Association, 2004.
HARRIS, R. Local indices of segregation with application to social
segregation between London’s secondary schools. Environment and Planning A, London, v. 44, n. 3, p. 669-87, 2012. doi:10.1068/a44317
KOUNALI, D. et al. The probity of free school meals as a proxy measure for disadvantage. 2007. Disponível em: <http://www.bristol.ac.uk/cmm/ publications/fsm.pdf>. Acesso em: 20 abr 2016.
LAUDER, H. et al. Pupil composition and accountability: and analysis in
English primary schools. International Journal of Educational Research, v. 49
n. 2-3, p. 49-68, 2010. doi:10.1016/j.ijer.2010.08.001
RAUDENBUSH, S. W.; BRYK, A. S. Hierarchical linear models:
applications and data analysis methods. Thousand Oaks: Sage, 2002. RAVITCH, D. The death and life of the great American school system: how
testing and choice are undermining education. New York: Basic, 2010. ROSENTHAL, R.; JACOBSON, L. Pygmalion in the classroom: teacher expectation and pupils’ intellectual development. New York: Holst, Rinehart & Winston, 1968.
SAPORITO, S. Private choices, public consequences: magnet school choice and segregation by race and poverty. Social Problems, Knoxville, v. 50, n. 2, p. 181-203, 2003. doi:10.1525/sp.2003.50.2.181
SOARES, J. F. Improving cognitive performance of students enrolled in
elementary school. Cadernos de Pesquisa, São Paulo, v. 37, n. 130, p. 135-60,
2007. doi:10.1590/S0100-15742007000100007
THRUPP, M. Schools making a diference: let’s be realistic. Buckingham: Open University Press, 1999.
_________. The school mix efect: the history of an enduring problem in
educational research, policy and practice. British Journal of Sociology of
Education, Sheggield, v. 16, n. 2, p. 183-203, 1997.
THRUPP, M.; HIRSCH, D. The limits of managerialist school reform: the case of target setting in England and the USA. In: LAUDER, H.; BROWN, P.; DILLABOUGH, J.-A.; Halsey, A. H. (Eds.). Education, globalization and social change. Oxford: Oxford University Press, 2006. p. 642-53.
THRUPP, M.; LAUDER, H.; ROBINSON, T. School composition and peer efects. International Journal of Educational Research, v. 37, n. 5, p. 483-504, 2002. doi:10.1016/S0883-0355(03)00016-8
Informações dos autores
Tiago Lisboa Bartholo: Doutorado em educação, Universidade Federal do Rio de
Janeiro. Professor do Programa de Pós-Graduação em Educação da UFRJ. Contato: [email protected]
Marcio Costa: Doutorado em sociologia, Instituto Universitário de Pesquisa do Rio de