Factors associated with user satisfaction
regarding treatment ofered in Brazilian
primary health care
Fatores associados à satisfação de usuários com
a atenção primária à saúde no Brasil
Factores asociados a la satisfacción de usuarios
con la atención primaria de salud en Brasil
Ane Polline Lacerda Protasio 1
Luciano Bezerra Gomes 1
Liliane dos Santos Machado 1
Ana Maria Gondim Valença 1
Abstract
The Program for Access and Quality Improvement in Primary Care (PMAQ-AB) aimed to improve healthcare public service quality. The purpose of this study was to identify the main factors that influence user satisfaction in Bra-zilian primary health care services. This research was carried out using sec-ondary data from the first cycle of the PMAQ-AB. A cluster analysis was carried out to find the dependent variable of user satisfaction; and logistic re-gression was applied in order to obtain the decision model. From the resulting regression model, two factors can be highlighted as regards influencing user satisfaction in Brazil: the user’s perception that the team did not attempt to address their needs/problems within the health unit; and the user not feeling respected by the professionals in relation to cultural habits, customs, and reli-gion or only sometimes feeling so. This study revealed the importance of con-tinued commitment of teams and managers to improving care access, meeting user needs, and improving organizational aspects and the health professional-user relationship.
Primary Health Care; Health Services Evaluation; Consumer Behavior
Correspondence A. P. L. Protasio
Rua Vandick Filgueiras 385, apto. 1001, João Pessoa, PB 58042-110, Brasil.
The 1988 Brazilian Federal Constitution instituted as some of its main objectives the reduction of social and regional inequalities, the promotion of the common good and the building of a caring and egalitarian society 1. As a result, in 1990, Brazil established a new health system called the Brazilian
Unified National Health System (SUS), which featured principles including universal access, equity, comprehensive care, prioritization of problems, adoption of a health system hierarchical structure, administrative decentralization of actions, and social participation and control 1.
To strengthen primary health care, in 1994 the Brazilian Ministry of Health established the Fam-ily Health Strategy (FHS) as the user’s first contact with the entire health system. Primary health care in Brazil was thus strengthened and included increased coverage of health teams running the FHS, known as family health teams, in all Brazilian states. This action had the full support of local, state and federal governments, advancing what had been established in the Brazilian Constitution2. In
2015, 5,423 Brazilian municipalities were served by the FHS, including 39,106 family health teams and a population coverage estimated at 62.32% (Portal da Saúde. Histórico de cobertura da Saúde da Família. http://dab.saude.gov.br/portaldab/historico_cobertura_sf.php, accessed on 18//Jun/2015).
To better evaluate primary health care activities, in 2011 the National Access and Quality Improve-ment Program – Primary Care (Programa Nacional de Melhoria do Acesso e da Qualidade – Atenção Básica;
PMAQ-AB) was implemented, which, in addition to establishing new evaluation mechanisms, also established new forms of financial incentives. The PMAQ-AB focuses on the incremental change of services offered in primary health care 3, and its primary aim is to increase access to and improve the
quality of primary care in Brazil to reach a national quality standard 4,5. The PMAQ-AB is organized
into cycles containing four phases 5: (1) adherence and contracting, (2) development, (3) external
evaluation, and (4) recontracting. The PMAQ-AB external evaluation phase comprises a set of actions that verify the access conditions and quality of health services in cities and in PMAQ-AB-registered primary care teams through the monitoring of contracted indicators and the verification of a set of quality standards at the team’s place of operation 5. The information obtained in this phase across the
country has been made available for analysis by the Brazilian Ministry of Health. One of the issues raised in this evaluation was the satisfaction of users regarding health services offered in primary health care with regard to access and use.
This study aimed to identify the main factors that influence user satisfaction in Brazil regarding health services to assist the health care manager to define facilitative actions that enhance health ser-vice quality from the user’s perspective and to make decisions that strengthen these actions.
Methods
The data used in this study are secondary and were obtained by the Brazilian Ministry of Health from the 1st PMAQ-AB external evaluation cycle (1st PMAQ-AB cycle) that was held between 2012 and the first half of 2013. These data include the responses of all contracted primary health care teams and were obtained using the external assessment tool: Health Closer to You (Saúde Mais Perto de Você) 6,
which was applied by researchers and professors from a number of Brazilian universities, and educa-tion and research institueduca-tions.
PMAQ-AB rules, that is, it should be a total of 68,814 users. However, only 65,391 users were inter-viewed totaling 3.8 users per team (5% missing). The user distribution (n = 65,391) of Brazil and its regions according to age and gender is shown in Table 1.
The PMAQ data used in this work was based on two criteria for analysis: variables that had up to 10% missing data were excluded; and users were included who had complete data in regard to the variables chosen in criterion 1. Thus, of the 91 pre-selected variables, the study considered 46 vari-ables, and of the 65,392 users interviewed in Brazil, 46,991 were considered.
A logistic regression model was fit to obtain the factors that influenced user satisfaction with the health service; user satisfaction was the dependent variable and the selected data were the indepen-dent variables.
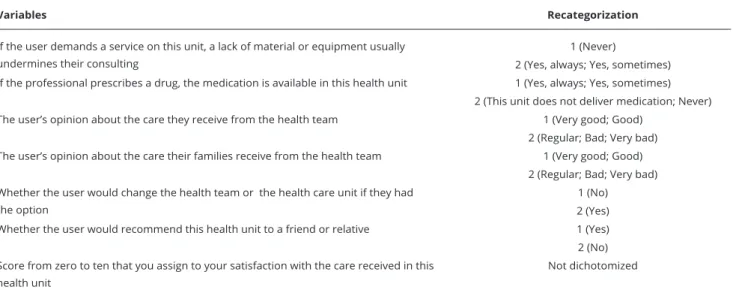
To obtain the dichotomized dependent variable “user satisfaction”, the multivariate analysis tech-nique two-step cluster analysis was performed, with the user satisfaction variables re-categorized into satisfied and unsatisfied and adapted according to the variable selection criteria, as described in Table 2. With this technique, two clusters were identified with an optimum silhouette value of 0.4.
Having removed the variables used to obtain the dependent variable, the Module III variables that passed the selection criteria and that could influence user satisfaction regarding care received in the PHU were pre-selected to become explanatory or independent variables. These pre-selected variables are described in Table 3.
For the construction of the logistic model, associations were first determined between the depen-dent variable and the other variables using the chi-square test with a 20% significance level; all 32 independent variables were significantly associated with the outcome. The model was then fit using the stepwise forward method and Bayesian information criterion (BIC). The final model was obtained assuming a significance level of 5%. The goodness of fit of the final logistic regression model was analyzed using an analysis of deviance, a classification matrix and an ROC (receiver operating characteristic) curve; a cross-validation was performed for the analysis of the predictive power of the resulting models.
For the analysis of the most important factors that were associated with user satisfaction, those with an odds ratio (OR) of approximately 0.4 were considered based on OR effect size guidelines, which consider a moderate effect to be represented by an OR of 0.4 7. The literature also indicates that
this value is flexible and that it is up to the discretion of the researcher to determine the importance of a factor, taking into account the context of the field of study 8.
All of the statistical analyses were performed using the software R, version 2.13.0 (The R Foun-dation for Statistical Computing, Vienna, Austria; http://www.r-project.org), except the two-step cluster analysis, which was performed using version 20.0 of the statistical software SPSS (SPSS Inc., Chicago, USA). The study was submitted to and approved by the Ethics Research Committee at the Federal University of Rio Grande do Sul (UFRGS; protocol n. 21904).
Table 1
User distribution (n = 65,391) of Brazil and its regions by age and gender (initial sampling).
Regions Age Gender
Male Female Total
Mean (SD) n (%) n (%) n
Brazil 44.03 (17.3) 14,600 (22.3) 50,791 (77.7) 65,391
Central 46.12 (18.7) 1,002 (23.1) 3,335 (76.9) 4,337
Northeast 40.51 (15.9) 3,465 (16.1) 18,091 (83.9) 21,556
North 39.50 (16.2) 780 (20.9) 2,948 (79.1) 3,728
Southeast 46.83 (18.1) 5,922 (23.3) 19,484 (76.7) 25,406
South 45.20 (16.0) 3,431 (33.1) 6,933 (66.9) 1,0364
Variables re-categorized for the multivariate analysis technique two-step cluster analysis.
Variables Recategorization
If the user demands a service on this unit, a lack of material or equipment usually undermines their consulting
1 (Never)
2 (Yes, always; Yes, sometimes) If the professional prescribes a drug, the medication is available in this health unit 1 (Yes, always; Yes, sometimes)
2 (This unit does not deliver medication; Never) The user’s opinion about the care they receive from the health team 1 (Very good; Good)
2 (Regular; Bad; Very bad) The user’s opinion about the care their families receive from the health team 1 (Very good; Good)
2 (Regular; Bad; Very bad) Whether the user would change the health team or the health care unit if they had
the option
1 (No) 2 (Yes) Whether the user would recommend this health unit to a friend or relative 1 (Yes) 2 (No) Score from zero to ten that you assign to your satisfaction with the care received in this
health unit
Not dichotomized
Note: 1 = satisied; 2 = dissatisied.
Results and discussion
User satisfaction may be observed by a user’s reaction to the context, process, and overall result of their experience of a service, and it can also partially include a broad domain represented by previ-ous expectations and overall values 9. The user’s satisfaction with the service provided can lead to an
improvement in quality of life because adherence to the prescribed treatment becomes more intensi-fied, and there is continuity in the use of health services. Moreover, in addition to being important for successful treatment, understanding user satisfaction is a way to evaluate and control the quality of service over a period of time 10.
This research offers a study based on data from all Brazilian regions in which users were inter-viewed during the external evaluation of the 1st PMAQ-AB cycle, which aimed to establish the factors that influence user satisfaction with respect to primay health care. In the final sampling, which can be observed in Table 4, there is a prevalence of adults (38.60 to 45.44 years) and females (68.5% to 85.9%). Taking into consideration the data from Table 1 and Table 4, the characteristics of the initial sampling are maintained in the final sampling.
In the first stage of this study, a two-step cluster analysis was performed, which indicated a preva-lence of 76.7% (36,027) of users who were satisfied with the care received at their PHU as opposed to 23.3% of dissatisfied users (10,964). This expressive high level of user satisfaction, even when the Brazilian health public service is considered precarious 11,12, was also observed in other studies. This
high level of user satisfaction may be justified by the high amount of user satisfaction influencing fac-tors that are directly related to humanized care ruled by the FHS. The influence of humanized care in user satisfaction has been observed in other studies 13,14,15,16.
Table 5 shows the logistic model fit in which 28 variables were directly associated with the out-come user satisfaction with primary health care services in Brazil.
This study corroborates the studies of Moimaz et al. 12 and Gouveia et al. 17 because it showed
Table 3
Variables used as independent variables in the study.
Independent variables
1. Gender
2. Age
3. Whether user can read and write 4. Whether user is retired 5. Currently in paid employment
6. Opinion of the distance from the user’s home to the health unit
7. Whether the user thinks the signage identifying places within the unit makes it easy to find those places (offices, bathrooms, vaccination rooms, etc.)
8. Whether the health unit operates five days a week 9. Periods and days the health unit operates
10. Whether the hours of operation of the unit suit the user’s needs 11. How the user makes appointments at the health unit
12. Available times for making appointments at the health unit 13. Whether the user can obtain a consultation on the same day
14. How the consultation is made (by appointment, at defined times or periods during the day, first come-first serve, being fit in, other(s)) 15. Whether user is able to be heard regarding any problem
16. Whether the user feels respected by the professionals with regard to cultural habits, customs, and religion
17. When the user is treated in this health unit, do they think that the team tries to meet their needs/solve their problems in the health unit itself?
18. Whether the consulting room is private
19. Whether the health professionals ask questions about other health needs that the user has or may have in addition to those related to the reason for the consultation
20. The user’s opinion as to whether, during consultations, the team members suggest solutions that are appropriate to their reality 21. Whether the doctor leaves enough time for the user to talk about their concerns or problems during treatment at the health unit 22. Whether the user in the observed health unit is treated by the same doctor
23. Whether the professionals of this unit usually ask after the user’s family
24. Whether the professionals remember what happened in the user’s past consultations
25. When the user needs to resolve issues after consultations, whether it is easy to talk with the professionals who treated him
26. When the user stops treatment for some reason or does not attend a consultation at the health unit, do practitioners attempt to make contact to find out what happened and resume treatment?
27. Whether the user feels comfortable talking with the team about their concerns, social or family problems or other issues 28. When the user needs it, can the professional team make an appointment with other professionals or experts
29. Whether the user finds it easy to find out the results of examinations at the health facility 30. Whether the user’s community health worker (CHW) visits their home
31. Whether other health team members visit the user’s home
32. Whether the user can make a complaint or suggestion at the health unit
This study found that being female increases a user’s chance of being satisfied by 17% compared to being male, which was consistent with other studies 18,19,20. This association may be because the
woman’s health was a priority action and some studies claim that health services are mostly fre-quented by women, particularly within the FHS 21,22,23,24. Women also comprised the majority of
respondents in this study, representing 77.7% of users. This scenario points to challenges faced by the Brazilian public health service as to how it can be structured in a way that makes it possible to know men’s health needs 25,26.
User distribution (n = 46,991) of Brazil and its regions by age and gender (inal sampling).
Regions Age Gender
Male Female Total
Mean (SD) n (%) n (%) n
Brazil 42.79 (19.9) 9,722 (20.7) 37,269 (79.3) 46,991
Central 44.41 (18.5) 605 (20.6) 2,336 (79.4) 2,941
Northeast 39.19 (15.2) 2,159 (14.1) 13,165 (85.9) 15,324
North 38.60 (15.6) 488 (19.2) 2,056 (80.8) 2,544
Southeast 45.44 (17.9) 4,053 (21.9) 14,458 (78.1) 18,511
South 44.37 (15.6) 2,417 (31.5) 5,254 (68.5) 7,671
SD: standard deviation.
age 17,21,24,27,28,29. This result can be explained due to the fact that older users use the public health
services more frequently, establishing continuous and trusting professional-patient relationships and also because they use the public health services not only to treat their particular health problems but also for other necessities 30. In addition, this result is also important as it shows that adjustments to
Brazilian public health programs and policies are needed in order to consider younger users. If the user is not in paid employment, the chance of being satisfied decreases by 15% when com-pared to users who are employed. This result corroborates those from Novaes et al.31, who concluded
that the satisfaction level increased proportionately to the user’s income. However, other studies 21,32
show the opposite, that is individuals who have higher incomes have higher expectations regarding services and are therefore more likely to be frustrated with what is offered and to be less satisfied.
The present study revealed that in Brazil, if the distance from a user’s home to the health facil-ity is moderate or far, it reduces the chance of the user being satisfied by 32% and 16%, respectively, compared to a user for whom the distance is short. This study corroborates the studies of Arain et al. 27 and Perez et al. 15. Santos et al. 33 observed the following causes for satisfaction in Brazil: the
good location of the FHS, a short distance from the FHS to the home, a short amount of time spent going to the FHS; and no need to use transport.
In our study, it was revealed that when signage is precarious in the PHU, the chance of the user being satisfied decreases by 19% compared to when the signage facilitates movement. When there are no signs in the PHU or when users do not notice the signs, the chance of satisfaction decreases by 20%.
Based on the model obtained in this study, if the PHU fails to operate five days a week, the chance of user satisfaction decreases by 29% compared to a that is open five days a week. If the operating hours do not meet user needs, satisfaction decreases by 46%, corroborating with findings from Santos et al. 33.
As Table 5 shows, if a user’s appointment is made by a community health worker, this decreases the chance of satisfaction compared to making the appointment by phone which is the reference category. It can also be observed that in Brazil, when appointments cannot be made on all days of the week, user satisfaction decreases by 16% and when the user is able to make the appointment but it is not for the same day, the chance of the user being satisfied decreases by 16%.
This study found that only having to come to the unit with an appointment decreased the chance of user satisfaction by 18% and not receiving health care without an appointment decreased the chance of being satisfied by 42% when compared to those who usually receive care without an appointment. This is consistent with Santiago et al.24 who found that the accessibility dimension was
Table 5
Logistic regression model it considering data from Brazil.
Variable β SD p-value OR (95%CI)
Intercept 3.58 0.1323 < 0.0001 * 35.70 (27.63-46.42)
III.4.6 – Gender
Male (reference) 1.00
Female 0.16 0.0366 < 0.0001 * 1.17 (1.09-1.26)
III.4.7 – What is your age? 0.01 0.0009 < 0.0001 * 1.01 (1.01-1.01)
III.4.14 – Are you currently in paid employment?
Yes (reference) 1.00
No -0.17 0.0298 < 0.0001 * 0.85 (0.80-0.90)
III.5.2 – What do you think of the distance between your home and the health unit?
Close (reference) 1.00
Moderate -0.38 0.0331 < 0.0001* 0.68 (0.64-0.73)
Far -0.18 0.0394 < 0.0001 * 0.84 (0.77-0.90)
III.5.3 – Do you think that the signage identifying places within the unit makes it easy to find these places? (e.g. consulting rooms, bathrooms,
vaccination rooms, etc.)
Yes (reference) 1.00
No -0.21 0.0507 < 0.0001 * 0.81 (0.73-0.89)
Yes, some signs 0.01 0.0601 0.8415 1.01 (0.90-1.14)
I did not notice or there are no signs in the unit -0.23 0.0501 < 0.0001 * 0.80 (0.72-0.88) III.5.4 – Does the health unit operate 5 days per week?
Yes (reference) 1.00
No -0.35 0.0642 < 0.0001 * 0.71 (0.62-0.80)
III.5.7 – Do the operating hours of this unit meet your needs?
Yes (reference) 1.00
No -0.61 0.0363 < 0.0001 * 0.54 (0.51-0.58)
III.6.1 – How do you typically make an appointment in the health unit?
By telephone 1.00
I go to the unit and can be seen at any time -0.46 0.1113 0.0001 * 0.63 (0.51-0.78) I go to the unit but must get a ticket -0.51 0.1119 < 0.0001 * 0.60 (0.48-0.75) I go to the unit, and to get a ticket, I must stand in line in front of the health
unit
-0.67 0.1109 < 0.0001 * 0.51 (0.41-0.63)
The community health worker makes the appointment -0.44 0.1170 0.0002 * 0.64 (0.51-0.81) I do not make appointments in this unit -0.54 0.1336 < 0.0001 * 0.58 (0.45-0.75) III.6.2 – Generally, can an appointment be made in this unit on any day of
the week?
Yes (reference) 1.00
No -0.17 0.0282 < 0.0001 * 0.84 (0.80-0.89)
III.6.3 – When you make an appointment, is it usually for the same day?
Yes (reference) 1.00
No -0.18 0.0286 < 0.0001 * 0.84 (0.79-0.89)
III.7.1 – Usually, if you come to the unit without an appointment to resolve any type of issue, are you seen?
Yes (reference) 1.00
No -0.55 0.0342 < 0.0001 * 0.58 (0.54-0.62)
I have never needed to come without an appointment -0.20 0.0406 < 0.0001 * 0.82 (0.75-0.88)
Variable β SD p-value OR (95%CI)
III.7.6 – Do you feel respected by the professionals with regards to your cultural habits, customs and religion?
Yes, always (reference) 1.00
Yes, sometimes -0.71 0.0478 < 0.0001 * 0.49 (0.45-0.54)
No -0.82 0.0845 < 0.0001 * 0.44 (0.37-0.52)
III.8.1 – When you are treated in the unit, do you feel that the team attempts to resolve your needs/problems within the unit itself?
Yes (reference) 1.00
Yes, sometimes -0.58 0.0318 < 0.0001 * 0.56 (0.52-0.59)
No -0.95 0.0546 < 0.0001 * 0.39 (0.35-0.43)
III.8.2 – Is the consulting room in a reserved area (is it private?)
Yes (reference) 1.00
No -0.53 0.0546 < 0.0001 * 0.59 (0.53-0.66)
III.8.7 – Do the health professionals ask questions about health needs that you have or may have other than those relating to the purpose of your consultation?
Always (reference) 1.00
Most times -0.07 0.0421 0.1067 0.93 (0.86-1.01)
Almost never -0.31 0.0516 < 0.0001 * 0.73 (0.66-0.81)
Never -0.32 0.0348 < 0.0001 * 0.73 (0.68-0.78)
III.8.8 – In your opinion, during consultations, do the health team professionals offer solutions that are appropriate to your reality?
Always (reference) 1.00
Most times -0.09 0.0388 0.0212 ** 0.91 (0.85-0.99)
Almost never -0.25 0.0507 < 0.0001 * 0.78 (0.70-0.86)
Never -0.31 0.0352 < 0.0001 * 0.73 (0.68-0.79)
III.9.1 – During treatment in this unit, does the doctor allow sufficient time for you to talk about your concerns or problems?
Yes (reference) 1.00
Yes, sometimes -0.23 0.0453 < 0.0001 * 0.80 (0.73-0.87)
No -0.28 0.0415 < 0.0001 * 0.76 (0.70-0.82)
III.9.7 – Are you treated by the same doctor in this unit:
Always (reference) 1.00
Most times -0.12 0.0357 0.0006 * 0.89 (0.83-0.95)
Almost never -0.20 0.0408 < 0.0001 * 0.82 (0.76-0.89)
Never -0.22 0.0629 0.0004 * 0.80 (0.71-0.91)
III.9.12 – Do the professionals in this unit usually ask about your family?
Always (reference) 1.00
Most times 0.07 0.0469 0.1122 1.08 (0.98-1.18)
Almost never -0.22 0.0543 0.0001 * 0.80 (0.72-0.89)
Never -0.43 0.0366 < 0.0001 * 0.65 (0.60-0.70)
III.9.13 – Do the professionals remember what happened in your previous consultations?
Yes (reference) 1.00
Yes, sometimes -0.03 0.0407 0.3937 0.97 (0.89-1.05)
No -0.32 0.0327 < 0.0001 * 0.73 (0.68-0.77)
Table 5 (continued)
Variable β SD p-value OR (95%CI)
III.9.14 – When you have questions that you need answered after the consultation, is it easy to speak with the professionals who treated you?
Always (reference) 1.00
Most times -0.05 0.0427 0.2010 0.95 (0.87-1.03)
Almost never -0.29 0.0584 < 0.0001 * 0.75 (0.67-0.84)
Never -0.40 0.0469 < 0.0001 * 0.67 (0.61-0.73)
Never needed questions answered -0.09 0.0367 0.0159 ** 0.92 (0.85-0.98)
III.9.16 – When you have interrupted treatment for any reason or did not attend a consultation in this health unit, did the professionals attempt to contact you to find out what happened and make a new appointment?
Yes (reference) 1.00
Yes, sometimes -0.11 0.0776 0.1414 0.89 (0.77-1.04)
No -0.33 0.0429 < 0.0001 * 0.72 (0.66-0.78)
Never interrupted or missed appointment 0.00 0.0404 0.9277 1.00 (0.93-1.09)
III.9.18 – Do you feel free to talk with the team about your concerns, social or family problems or other issues?
Always (reference) 1.00
Most times -0.13 0.0420 0.0019 * 0.88 (0.81-0.95)
Almost never -0.29 0.0518 < 0.0001 * 0.75 (0.67-0.83)
Never -0.42 0.0341 < 0.0001 * 0.65 (0.61-0.70)
III.9.19 – When you need it, are the professionals able to make appointments for you with other professionals or specialists?
Yes, always (reference) 1.00
Yes, sometimes -0.23 0.0392 <0.0001 * 0.79 (0.73-0.86)
No -0.31 0.0454 < 0.0001 * 0.74 (0.67-0.80)
Never needed -0.07 0.0347 0.0421 ** 0.93 (0.87-1.00)
III.9.22 – Do you find it easy to obtain the results of your exams when you come to the unit?
Yes, always (reference) 1.00
Yes, sometimes -0.22 0.0368 < 0.0001 * 0.80 (0.74-0.86)
No -0.30 0.0354 < 0.0001 * 0.74 (0.69-0.79)
III.9.23 – Does your community health worker (CHW) visit you at your home?
Yes (reference) 1.00
No -0.29 0.0368 < 0.0001 * 0.75 (0.70-0.81)
There is no CHW in this unit or in my neighborhood -0.20 0.1501 0.1867 0.82 (0.61-1.11) III.9.24 – Do other health team professionals visit you in your home?
Yes (reference) 1.00
Yes, sometimes -0.08 0.0574 0.1515 0.92 (0.82-1.03)
No -0.27 0.0422 < 0.0001 * 0.76 (0.70-0.83)
III.19.1 – When you wish to make a complaint or suggestion at the health unit, are you able to do so?
Yes (reference) 1.00
Yes, but with difficulty -0.54 0.0679 < 0.0001 * 0.58 (0.51-0.66)
No -0.24 0.0453 < 0.0001 * 0.78 (0.72-0.86)
Never needed to 0.31 0.0365 < 0.0001 * 1.36 (1.27-1.47)
95%CI: 95% conidence interval; OR: odds ratio; SD: standard deviation. * Category signiicant at 1%;
by the professionals regarding their cultural habits, customs or religion, the chance of satisfaction decreases by 56% and 51%, respectively, compared to those who always feel respected. These results confirm those obtained by other studies who found this association between user satisfaction and the user feeling respected and well regarded by professionals 13,14.
Regarding privacy, user satisfaction decreases by 41% when the consulting room is not in a separate area. Villadsen et al. 34 and Mendoza Aldana et al. 14 also found an association between user
satisfaction with the health service and the privacy of the consulting room.
This study revealed that if the team only sometimes resolves the patient’s needs or problems in the health unit itself, the chance of satisfaction decreases by 44% compared to when the user’s problems are resolved by the team. Not being able to resolve the patient’s problem decreases the chance of satisfaction by 61%. This result corroborates those from Bernhart et al. 35 and Groenewegen et al. 36
who found that the main aspect for service satisfaction was that the user felt that their problem had been resolved.
In Brazil, satisfaction level decreases by 27% when health professionals rarely or never ask ques-tions about other health needs of the user. In addition, the model showed that if team members sug-gest solutions that are appropriate to the user’s reality most of the time, rarely or never, as opposed to if they always suggest solutions, the chance of satisfaction decreases by 9, 22 and 27%, respectively.
The professional’s lack of commitment, respect and attention are among the main causes of user dissatisfaction 12, and it has been established that user satisfaction is directly linked to health care,
regardless of location or resources made available by the PHU 22. Thus, attention should be focused
on a growing need to develop more open communication between healthcare professionals and users, facilitating a higher quality of relationship. A better doctor-patient relationship not only has positive effects on user satisfaction and health service quality but also directly influences the patient’s health status 37. Danielsen et al. 38 found that the professional-patient relationship and the success of
treat-ment were associated with health clinic user satisfaction in Norway. Given Brazil’s cultural diversity, an understanding of the user’s reality is a duty of FHS professionals in forming the professional-patient relationship.
Based on the professional-user relationship, this study revealed that when a doctor only some-times leaves, or does not leave enough time for the user to talk about their concerns or problems during treatment at the PHU, this decreases the chance of satisfaction by 20% and 24%, respectively, compared to when the user feels the doctor leaves enough time for this purpose. In this regard, many studies have found that there is a significant association between consultation time and user satisfac-tion 13,14. In addition, it was observed that the satisfaction level decreases by 12% when the user feels
free to talk with the team about their concerns, social problems, family or other issues. When the user rarely or never feels at ease to do so, satisfaction decreases by 25% and 35%, respectively. In this regard, this study also revealed that the habit of asking users about their family had an effect on user satisfaction. Professionals who rarely or never asked about family members decreased the chance of satisfaction by 20% and 35%, respectively. However, if the professional asks most of the time, the chance of satisfaction increases by 8% in relation to always asking. These results show that users’ evaluations of health services are affected by the importance of medical knowledge about the patient, coordination of care, interpersonal communication and valuing continuity of care 39,40.
This study revealed that being cared for by the same doctor is an influential factor in user sat-isfaction in Brazil. Users who were often, almost never and never cared for by the same doctor had decreased satisfaction by 11, 20 and 22%t, respectively. Another study obtained the same result with respect to prenatal care, noting that maintaining the same team of professionals is an important fac-tor in user satisfaction 41. Another aspect was that if a health professional does not remember what
happened in the user’s previous consultations, user satisfaction decreases by 27%.
studies that claim that continuity of care is a fundamental aspect of primary care and must be ensured 21,39,40,42.
It should be understood that the professional’s responsibility in resolving health actions is critical to the success of the FHS and enables more accurate diagnoses and more effective treatment 43. An
integral part of continuity of care is that after a consultation, the professional answers the user’s ques-tions, offers a receptive approach, values complaints and seeks possible solutions to their problem 44.
In this regard, when users do not always find it easy to talk with the professionals who treated them, the chance of satisfaction was found to drop by 14%.
The PMAQ-AB encourages the strengthening of primary health care as the first contact, meeting health needs in a receptive and resolute manner and enabling the creation of established conditions for guaranteeing and coordinating continuity of health care objectives prioritized in the SUS health care networks. In this respect, this study revealed that when team professionals are only sometimes able to make an appointment with other professionals or specialists or cannot do so, the chance of satisfaction decreases by 21% and 26%, respectively, and when they have never needed to make an appointment with a specialist, the chance of satisfaction decreases by 7%. Arakawa et al. 45 noted that
the most frequent user complaint was difficulty in accessing specialized services, which is in agree-ment with other studies 24,46,47.
This study shows that when users obtain the results of their exams with ease sometimes or not at all when coming to the unit, the chance of satisfaction decreases by 20% and 26%, respectively, compared to when such results are always easy to obtain. However, the most significant problems in relation to access to specialized consultations and examinations stem from management shortcom-ings, such as lack of planning regarding its provision and managers’ low regulatory capacity. If referral cannot be fully performed, the service’s organizational strategies must be reviewed 48. In addition, for
a network of health services to be effective, secondary health care must ensure user access to special-ized consultations and examinations that are indispensable for carrying through the diagnosis that originated from primary health care 49.
Another factor raised in our study was the existence of the home visit. If the community health worker does not visit the user’s home, the chance of satisfaction is reduced by 25%. On this subject, Mues et al. 50 noted that for users who reported that health workers made one or more home visits
per month, the chance of satisfaction regarding access to the FHS was 5.25 times greater than for those who received home visits less than once per month. The FHS provides the space and incentive for home visits to occur more frequently in Brazil, and opens a door to dialogic interface between health professionals, the individual under their care and the family, and produces and strengthens a real bond so that users and their families feel valued and supported in their needs and feel safe and comfortable with the care received 51.
Regarding mechanisms for user participation and interaction,only one variable, whether the user can make a complaint or suggestion at the health unit, met the inclusion and exclusion criteria and was significant in the model. It was observed that if the user cannot make a complaint or suggestion in the health unit or may only sometimes be able to do so, the chance of satisfaction decreases by 22% and 42%, respectively. It was also found that for those who never needed to make a complaint or suggestion in the facility, the chance of satisfaction increases by 38% compared to those who could make a complaint or suggestion in the health unit. This finding indicates that the possibility of making complaints is essential to the user because this is a key element in the evaluation process of services provided by the units 24.
A limitation of this study was the difficulty encountered in the data analysis as a result of the use of secondary data. Additionally, the database was not tabulated by the authors, and there was a high number of non-responses for some variables. However, this was solved by the development of a variable exclusion criterion and by including only complete data that does not compromise the rep-resentativeness of the sample. Additionally, this criterion does not compromise the possibility of any inference in the obtained results due to the similarities of user characteristics encountered in different Brazilian regions and the narrow values of sampling loss distributed in these regions.
program itself.
When reviewing the factors from the model that were obtained in this study, two can be highlight-ed as the most important in terms of influencing user satisfaction in Brazilian primary health care: the user’s perception that the team did not attempt to address their needs/problems within the health unit (OR = 0.39; 95%CI: 0.35-0.43) and the user not feeling respected by the professionals in relation to cultural habits, customs, and religion (OR = 0.44; 95%CI: 0.37-0.52) or feeling so only sometimes (OR = 0.49; 95%CI: 0.45-0.54). These are factors that managers should follow when making decisions to achieve improved user satisfaction with regard to health services.
It is important to point out that this was the first study where factors relating to user satisfac-tion with primary care services have been identified within a representative and official sample of an entire country such as Brazil that is continental in size, and that these findings can scientifically support health care managers to make optimal decisions in order to increase primary health care user satisfaction in the SUS. This is an important scientific study because previous studies about user satisfaction with health services were conducted with restricted and localized populations 15,20,27,34,50
and previous studies that include questions related to user satisfaction using PMAQ-AB data were not based on statistical techniques for decision-making.
Finally, this study revealed the importance of the continued commitment of teams and manag-ers to improving care access, meeting user needs and improving aspects of organization and work process dynamics. In particular, this study highlights the importance of improving the relationship between users and health professionals. This study also considered the contribution and importance of socio-geographic and socio-economic analyses. The results obtained can be used to support ini-tiatives aimed at reorganizing work processes, involving changes that do not require large financial investments but can provide important improvements to the health system.
Contributors
A. P. L. Protasio, L. B. Gomes, L. S. Machado and A. M. G. Valença contributed in the conception, plan-ning, data analysis and interpretation, writing of the article, critical revision of content and approval of the final version of the manuscript.
Acknowledgments
References
1. Brasil. Lei no 8.080, de 19 de setembro de 1990.
Dispõe sobre as condições para a promoção, proteção e recuperação da saúde, a organização e o funcionamento dos serviços corresponden-tes e dá outras providências. Diário Oficial da União 1990; 20 set.
2. Mendonça CS. Saúde da família, agora mais do que nunca! Ciênc Saúde Coletiva 2009; 14:1493-7.
3. Fontenelle LF. Mudanças recentes na Política Nacional de Atenção Básica: uma análise crí-tica. Rev Bras Med Fam Comunidade 2012; 7:5-9.
4. Departamento de Atenção Básica, Secretaria de Assistência à Saúde, Ministério da Saúde. Programa Nacional de Melhoria do Acesso e da Qualidade da Atenção Básica (PMAQ): ma-nual instrutivo. http://www.saude.mt.gov.br/ upload/documento/165/pmaq-manual-instru tivo-%5B165-040412-SES-MT%5D.pdf (ac-cessed on 19/Nov/2013).
5. Departamento de Atenção Básica, Secretaria de Assistência à Saúde, Ministério da Saúde. Saúde Mais Perto de Você – acesso e qualida-de. Programa Nacional de Melhoria do Acesso e da Qualidade da Atenção Básica (PMAQ-AB): documento síntese para avaliação externa. Bra-sília: Ministério da Saúde; 2012.
6. Departamento de Atenção Básica, Secretaria de Assistência à Saúde, Ministério da Saúde. Saúde Mais Perto de Você – acesso e qualidade. Programa Nacional de Melhoria do Acesso e da Qualidade da Atenção Básica (PMAQ-AB): ins-trumento de avaliação externa do saúde mais perto de você – acesso e qualidade. Brasília: Ministério da Saúde; 2012.
7. Hammond F, Buschbacher R. Handbook for clinical research: design, statistics, and imple-mentation. New York: Demos Medical Publish-ing; 2014.
8. Rosenthal JA. Qualitative descriptors of strength of association and effect size. J Soc Serv Res 1996; 21:37-59.
9. Pascoe GC. Patient satisfaction in primary health care: a literature review and analysis. Eval Program Plann 1983; 6:185-210.
10. Brunero S, Lamont S, Fairbrother G. Using and understanding consumer satisfaction to ef-fect an improvement in mental health service delivery. J Psychiatr Ment Health Nurs 2009; 16:272-8.
11. Giovani MSP, Vieira CM. Longitudinalidade do cuidado diante da rotatividade de profissionais na Estratégia Saúde da Família. RECIIS (On-line) 2013; 7(4). http://www.reciis.icict.fiocruz. br/index.php/reciis/article/view/866.
12. Moimaz SAS, Marques JAM, Saliba O, Garbin CAS, Zina LG, Saliba NA. Satisfaction and per-ception of SUS’s users about public health care. Physis (Rio J.) 2010; 20:1419-40.
13. Bastos GAN, Fasolo LR, Bastos GAN, Fasolo LR. Factors that influence outpatient service user satisfaction in a low-income population: a population-based study. Rev Bras Epidemiol 2013; 16:114-24.
14. Mendoza Aldana J, Piechulek H, Al-Sabir A. Client satisfaction and quality of health care in rural Bangladesh. Bull World Health Organ 2001; 79:512-7.
15. Perez LG, Sheridan JD, Nicholls AY, Mues KE, Saleme PS, Resende JC, et al. Professional and community satisfaction with the Brazilian fam-ily health strategy. Rev Saúde Pública 2013; 47:403-13.
16. Freitas CASL, Albuquerque IMN, Gifoni DP, Santiago AX, Silva MJ. Atenção à saúde do ido-so na Estratégia Saúde da família, Sobral-CE. Saúde Colet (Barueri) 2010; 7:200-5.
17. Gouveia GC, Souza WV, Luna CF, Souza-Júnior PRB, Szwarcwald CL. Health care users’ satisfaction in Brazil, 2003. Cad Saúde Pública 2005; 21 Suppl:S109-18.
18. Bjorngaard JH, Ruud T, Friis S. The impact of mental illness on patient satisfaction with the therapeutic relationship: a multilevel analy-sis. Soc Psychiatry Psychiatr Epidemiol 2007; 42:803-9.
19. Gouveia GC, Souza WV, Luna CF, Souza-Júnior PRB, Szwarcwald CL. User satisfaction in the Brazilian health system: associated factors and regional differences. Rev Bras Epidemiol 2009; 12:281-96.
20. Nigenda-López G, Salinas-Rodríguez A, Gó-mez-Camponovo M, Manrique-Espinoza B, Ruiz-Larios JA, Trejo-Rosales A. Identificação dos usuários segundo nível de satisfação nos módulos gerontológicos empregando a análise de conglomerados. Rev Esc Enferm USP 2013; 47:421-5.
21. Brandão ALRBS, Giovanella L, Campos CEA. Avaliação da atenção básica pela perspecti-va dos usuários: adaptação do instrumento EUROPEP para grandes centros urbanos bra-sileiros. Ciênc Saúde Coletiva 2013; 18:103-14. 22. Gondim APS, Andrade JT. Cuidado humaniza-do na atenção primária à saúde: demanda por serviços e atuação profissional na rede de aten-ção primária à saúde – Fortaleza, Ceará, Brasil. Rev Port Saúde Pública 2014; 32:61-8.
23. Mendes F, Mantovani MF, Gemito ML, Lopes MJ. A satisfação dos utentes com os cuidados de saúde primários. Referência 2013; serIII:17-25. 24. Santiago RF, Mendes ACG, Miranda GMD,
Duarte PO, Furtado BMASM, Souza WV. Qual-ity of care in the family healthcare units in the city of Recife: user perception. Ciênc Saúde Co-letiva 2013; 18:35-44.
um desafio para os serviços de atenção primá-ria. Ciênc Saúde Coletiva 2005; 10:105-9. 27. Arain M, Nicholl J, Campbell M. Patients’
ex-perience and satisfaction with GP led walk-in centres in the UK: a cross sectional study. BMC Health Serv Res 2013; 13:142.
28. Assefa F, Mosse A, Michael Y. Assessment of clients’ satisfaction with health service deliver-ies at Jimma University Specialized Hospital. Ethiop J Health Sci 2011; 21:101-10.
29. Drakopoulou M, Roka V, Apostolara P, Bucaj A, Skafidakis D, Kalokerinou A. Correlates of health services users’ satisfaction provided by the first urban type health center in Greece. Balkan Military Medical Review 2012; 15:2-14. 30. Mishima SM, Paula VG, Pereira MJB, Almeida MCP, Kawata LS. (Dis)satisfaction of users: duplication and simulataneous use of services in family health. Rev Esc Enferm USP 2010; 44:766-73.
31. Novaes MRCG, Lima ACV, Nogueira DY, Cer-queira F, Mello GF, Souza HS, et al. Estudo etnográfico e de satisfação de profissionais e usuários do Programa de Saúde da Família em Samambaia, Distrito Federal. Comun Ciênc Saúde 2011; 21:289-300.
32. Esperidião MA, Trad LAB. Avaliação de satisfa-ção de usuários: considerações teórico-concei-tuais. Cad Saúde Pública 2006; 22:1267-76. 33. Santos SMS, Oliveira VAC, Oliveira RAC,
Gui-marães EAA. Estratégia saúde da família: quali-dade da assistência sob a perspectiva da satisfa-ção do usuário. REME Rev Min Enferm 2010; 14:499-508.
34. Villadsen SF, Tersbøl BP, Negussie D, Ge-breMariam A, Tilahun A, Friis H, et al. Ante-natal care strengthening in Jimma, Ethiopia: a mixed-method needs assessment. J Environ Public Health 2014; 2014:945164.
35. Bernhart MH, Wiadnyana IGP, Wihardjo H, Pohan I. Patient satisfaction in developing countries. Soc Sci Med 1999; 48:989-96. 36. Groenewegen PP, Kerssens JJ, Sixma HJ, van
der Eijk I, Boerma WG. What is important in evaluating health care quality? An international comparison of user views. BMC Health Serv Res 2005; 5:16.
37. Caprara A, Rodrigues J. Asymmetric doctor-patient relationship: rethinking the therapeutic bond. Ciênc Saúde Coletiva 2004; 9:139-46. 38. Danielsen K, Bjertnaes OA, Garratt A, Forland
O, Iversen HH, Hunskaar S. The association between demographic factors, user reported experiences and user satisfaction: results from three casualty clinics in Norway. BMC Fam Pract 2010; 11:73.
39. Cunha EM, Giovanella L. Longitudinalidade/ continuidade do cuidado: identificando di-mensões e variáveis para a avaliação da aten-ção primária no contexto do sistema público de saúde brasileiro. Ciênc Saúde Coletiva 2011; 16:1029-42.
SJ, Stange KC. Continuity of primary care: to whom does it matter and when? Ann Fam Med 2003; 1:149-55.
41. Atkinson SJ. Anthropology in research on the quality of health services. Cad Saúde Pública 1993; 9:283-99.
42. Veras RP, Caldas CP, Motta LB, Lima KC, Siqueira RC, Rodrigues RTSV, et al. Integration and continuity of care in health care network models for frail older adults. Rev Saúde Pública 2014; 48:357-65.
43. Starfield B. Atenção primária: equilíbrio entre necessidades de saúde, serviços e tecnologia. 2a
Ed. Brasília: Organização das Nações Unidas para a Educação, a Ciência e a Cultura/Minis-tério da Saúde; 2002.
44. Santana JCB, Fortes NM, Andrade AV, Soares APF, Monteiro Lima JR. Acolhimento em um serviço da atenção básica à saúde de Minas Gerais. Rev Enferm Cent-Oeste Min 2012; 2: 166-76.
45. Arakawa AM, Lopes-Herrera SA, Caldana ML, Tomita NE. Percepção dos usuários do sus: ex-pectativa e satisfação do atendimento na Estra-tégia de Saúde da Família. Rev CEFAC 2012; 14:1108-14.
46. Conill EM, Giovanella L, Almeida PF. Waiting lists in public systems: from expanding supply to timely access? Reflections on Spain’s Nation-al HeNation-alth System. Ciênc Saúde Coletiva 2011; 16:2783-94.
47. Valius L, Rastenytė D, Malinauskienė V, Krančiukaitė-Butylkinienė D. Evaluation of the quality of services in primary health care insti-tutions. Med Kaunas 2011; 47:57-62.
48. Conill EM, Freire J-M, Giovanella L. Challeng-es to Latin American health systems: some is-sues that can be focused by comparative analy-sis. Ciênc Saúde Coletiva 2011; 16:2671. 49. Serra CG, Rodrigues PHA. Evaluation of
ref-erence and counter-refref-erence in the Family Health Program at the Metropolitan Region of Rio de Janeiro (RJ, Brazil). Ciênc Saúde Cole-tiva 2010; 15:3579-86.
50. Mues KE, Resende JC, Santos OC, Perez LG, Ferreira JA, Leon JS. User satisfaction with the Family Health Program in Vespasiano, Minas Gerais, Brazil. Rev Panam Salud Pública 2012; 31:454-60.
Resumo
O Programa Nacional de Melhoria do Acesso e da Qualidade da Atenção Básica (PMAQ-AB) tem como objetivo melhorar a qualidade dos ser-viços públicos de saúde. O objetivo do estudo foi identificar os principais fatores que influenciam a satisfação dos usuários com os serviços de atenção básica no Brasil. O estudo utilizou dados secundá-rios do primeiro ciclo do PMAQ-AB. A análise de clusters foi utilizada para identificar a variável-desfecho satisfação de usuários, e a regressão lo-gística foi aplicada para obter o modelo decisório. A partir do modelo de regressão, destacam-se dois fatores relacionados à influência sobre a satisfação de usuários no Brasil: a percepção do usuário de que a equipe de saúde não procurou atender suas necessidades e problemas internos da unidade de saúde; a sensação do usuário de não se sentir res-peitado pelos profissionais, ou de sentir resres-peitado apenas eventualmente, em relação a seus hábitos culturais, costumes e religião. O estudo revelou a importância do compromisso de equipes e gestores na melhoria do acesso, satisfação das necessidades dos usuários e melhoria dos aspectos organizacio-nais e da relação entre profissioorganizacio-nais e usuários.
Atenção Primária à Saúde; Avaliação de Serviços de Saúde; Comportamento do Consumidor
Resumen
El Programa Nacional de Mejora del Acceso y Calidad de la Atención Básica (PMAQ-AB) tiene como objetivo mejorar la calidad de los servicios públicos de salud. El objetivo del estudio fue iden-tificar los principales factores que influencian la satisfacción de los usuarios con los servicios de atención básica en Brasil. El estudio utilizó datos secundarios del primer ciclo del PMAQ-AB. El análisis de clústeres se utilizó para identificar la variable-desenlace satisfacción de usuarios, y la regresión logística se aplicó para obtener el mo-delo decisorio. A partir del momo-delo de regresión, se destacan dos factores relacionados con la influen-cia sobre la satisfacción de usuarios en Brasil: la percepción del usuario de que el equipo de salud no procuró atender sus necesidades y problemas internos de la unidad de salud; la sensación del usuario de no sentirse respetado por los profesio-nales, o de sentirse respetado sólo eventualmente, en relación a sus hábitos culturales, costumbres y religión. El estudio reveló la importancia del com-promiso de equipos y gestores en la mejora del ac-ceso, satisfacción de las necesidades de los usuarios y mejora de los aspectos organizativos y de rela-ción entre profesionales y usuarios.
Atención Primaria de Salud; Evaluación de Servicios de Salud; Comportamiento del Consumidor
Submitted on 06/Nov/2015