Proccemllgs
if
the II ti; [1Itematiol1a! C01!ferou'e 0 11 COlllpffta/iolla! aurl lV!(J/bt:/l/(i/ú:(J!1'1e/hodJ ill Sdeuce (/1/(/ ElIgillwillg, CNlMSE2011Bel/idO/m. Spaill. 26-30.[111" 2011
Numerical Prediction ofVelocity, Pressure and Shear
Rate Distributions in Stenosed Channels
Carla S. Fernandes
l,Ricardo P. Diasz,] and Rui Lima
3,4I Departamento de Matemática. Escola Superior de Tecnologia e
Gestão. Jnstitlllo Politécnico de Bragança
" DepartamenlO de Tecnologia Quimica e Biológica, Escola Superior de Tecnologia e Gesttlo, Jnstituto Politéwico de Bragança
3 CEFT - Centro de Estudos de Fenómenos de Transpor/e, Faculdade
de Engenharia da Universidade do Por/o
@CMMSE
4 Departamento de Tecnologia lVfecânica, Escola Superior de
Tecnologia e Gestcio, Jnstituto Politécnico de Bragança
ernails: cveiea@ ipb.pt, [email protected], [email protected]
Abstract
Wall shear rates and pressure developed in circulatory syslem play an important role on lhe development of some clinicaI
problems such as atherosclerosis and thrombosis. In the present
work, blood flow behaviour was numerically studied in simplified domains and several relevant local properties were determined. The stenosis degree was varied in the distinct studied channels and blood rheology was described by three different models - constant viscosity, power-law model and Carreau model. Pressure attains maximum values in the wall of
the atheroma and shear rates achieved maximurn values in the
top of the atheroma. lt lVas aIs O observed lhat, with the studied
flows, the predictions for velocity and shear rate using non-Newtonian models lVere very similar. This observation can be explained by the magnitude of the obtained shear rates.
Key wOl'ds: ath eroma, velocity, shear rale. pl'eSSlil'e, CFD
VELOCITY. PRESSURE ANO SHEAR RATE DlSTRIBUTlONS IN STENOSEO CHANNELS
1.
lntroductionArthrosclerosis means literally "arteries hardening", however it is a generic term that refers to three pattems ofvascular diseases which have the hardening and loss of elasticity ofthe arteries walls as a common factor [I]. The dominant pattem is atheroscJerosis, characterized by the formation of alheromas - fibrous plaques that generally exhibit a centre rich in lipids.
The initiallesion of an atheroma formation can trigger due to the turbulence ofthe flow. Most of the times, the formation of an atheroma is accomplished hy a thrombus formation. Jt is thought that the location of higher pressures and velocities promote lhe endothelium lesion and hence lhe formation of a thrombus, wruch normally conduce to a thromboembolism due to lhe high speeds and pressures [I].
2. Numerical Simulations
The govemative equations for lhe isothermal laminar incompressible blood flow were solved by the finite-element software POL YFLOW®. Since experimental study of blood flow in the circulatory system is not an easy task, the numerical results can be useful in order lo understand the blood behaviour in stenosed arteries/vessels.
In the calculations, blood was considered both Newtonian and non-Newtonian fluid, its rheology being described, in lhe second case, by the power-Iaw and Carreau models wruch can be mathematically expressed, respectively, by:
(I)
(2)
where 1/ is lhe apparent viscosity, K Ule consistency index, 11 lhe flow index behaviour,
r
lhe shear rate, 1]0 Ule viscosity for lower shear rates, I] ~ the viscosityfor higher shear rates and À Ule natural time. For blood, lhe values of ali lhese
rheological parameters were presented in Tab.l.
Rheological model
Newto nian
Power-Iaw madel
Carreau madel
@CMMSE
Table 1: Rheological properties ofblood [2].
'7 (Pas) K (Pas") 0.00345
0.035
1/(-)
0.6 0.3568
Page 1321 011703
À (s)
3.313
'7-(Pas) '70 (Pas)
0.00345 0.056
VELOCITY, PRESSURE AND SHEAR RATE DISTRIBUTIONS IN STENOSED CHANNELS
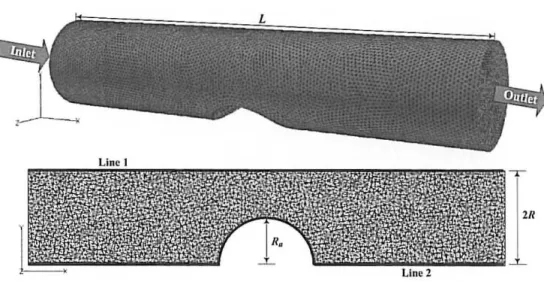
The simulations were carried out in 3D geometries representing cylindrical
stenosed channels, the atheroma being constructed resorting to a semi-sphere, Fig.
I.
Figure I: Representation ofthe computational domain and used mesh.
Three channels presenting different stenosis degrees were studied. AlI the
channels had the same length (L
=
30 nun) and radius (R=
3 mm) and the radiusof the atheroma varied as presented in Tab. 2. Stenosis degree was defined as the
ratio between the diameter ofthe channel and the radius ofthe atheroma (2R/RQ ) .
Table 2: Geometrical properties of the studied channels.
Chaooel Stcnosis degree (%) Athcroma radius (0101)
CI 20 1.2
C2 30 1.8
C3 50 3.0
The discretization of the geometrical domain was made using an unstructured non-uniform mesh (Fig. I) and the size of the elements was fIxed after a grid independence test in which the size of the elements is successively reduced and the velocity results, obtained with the different meshes, were compared. The
results were considered to be independent when a difference below 1 % was
achieved [3 , 4].
The boundary conditions were established in order to reproduce the experimental work developed by Jolmston et a!. [2] to study the rheology of blood in arteries.
VELOCITY, PRESSURE AND SHEAR RA TE DISTRIBUTIONS IN STENOSED CHANNELS
In the inlet (x
=
O), a constant flow rate -M,.=
1.27x 10.7 m\·J - was imposed and non-slip at the walls was admitted.The equations solved were the conservation of mass and momentum equations for laminar incompressible blood flow. Since this is a non-linear problem, it was necessary to use an iterative method to solve the referred equations. In order to evaluate the convergence of tllis process, a test based on the relative error in tlle velocity field was perfomled. For the velocity field, lhe modification on each node between two consecutive iterations is compared to the value of the velocitl at the current iteration. In the present wark, the convergence value was set to 10' , since this value is appropriate for tlle studied problem [4-8].
In order to verify tlle reliability and exactness of the computational fluid dynamics (CFD) calculations, two tests were perfomled: one involving local properties and other wilh global properties of the flow. First, velocity profiles were compared with the analytical solution for the fully developed flow of a power-law fluid in a cylindrical duct [9]:
3 I
[ ( )
("+i)/"]
11+ r
1'(1')= - /-,- 1- R 11 (3)
where 11 is lhe average velocity and is given by:
M,.
lf = 7r R2 . (4)
In Fig. 2 it is possible to observe lhe good agreemenl between tlle numerical velocities and Eq. (3) for both Newtonian (/1 = I) and power-law fluid (/1 = 0.6) (mean deviation of 0.28 % and \.27% for the Newtonian and power-law fluid, respectively). As expected, the maximum deviations were observed near the wall, since the velocities in tbis region were c\ose to zero.
VELOCITY. PRE SSURE AND SHEAR RATE DlSTRIBUTIONS IN STENOSED CHANNELS
10 ~~~~~ __ ~ __ ~~~
'
...
-I
o 0.2 004 0.6 0.8
dR
Figure 2: Veloeity profiles for fully developed flow in the region before the atherama in
ehannel C3 for different rheologieal models. (e) Newtonian; (o) Power-Iaw model; (-)
Eq.(3) with 1/
=
I; (- - -)Eq.(3) wi!h 1/=
0.6.To estimate the pressure drop, it is usual to use correlations between Falllúng friction factor,f, and Reynolds number, Re. However, when the viscosity of fluid is not constant and difficult to predict, Reynolds nwnber in the relationjRe can be replaced by a generalized Reynolds number, Reg, the referred relation being:
(5)
for fully developed laminar flows. In Eg. (5) a is a constant dependent of the
geometry and
f
is given by:r
(6)with !lP the pressure drop in a channel with lengUl L, p the density of the fluid
and Du the hydraulic diameter (Du
=
2R
for a cylindrical duct).The use of Reg instead of Re allows the calculation of a single friction curve for bOUl Newtonian and non-Newtonian fluids. For flows of power-Iaw fluids in ducts \ViUl constant arbitrary sectiol1, Ule following expression for Reg have been
proposed by Delpace and Leuliet [10]:
p1l2- II D~
Re
= ______
-L~~~ ____ __g
K((241l +Ç')/(( 24+Ç' )n))"
ç'n.' (7).; being a geometrical parameter that assumes the value 8 for cylindrical ducts.
VELOCITY, PRESSURE AND SHEAR RATE DISTRIBUTIONS IN STENOSED CHANNELS
Substituting Eqs. (7) and (6) in Eq. (5), constant a can be expressed as function of rheological and geometrical parameters as fallows:
DI1+ly
a = _____ .:.c...!H'--"'----_ _ _ -:-_
211n KL \
(24/1
+ç)/{ (24
+ç)/1
Jl"
Çn-' (8)In order to calculate lhe constant a for the studied channels, the pressure drop in small cylinders af I mm length were used and constant a was estimated resorting to Eq. (8). In lhe region before lhe atheroma lhe average values of a were 16.053 and 15.931 for Newtonian (11
=
I and K=
'7=
0.00345 Pas) and power-Iaw fluid(11
=
0.6 and K=
0.035 PasO.6), respectively. Comparing Ihese results with lhe one
predicted analytically (16) it is possible to conelude, once again, that the numerical model used in the presenl work describes well lhe studied flow , since the mean deviations were 0.329% and 0.767% for lhe Newtonian and power-Iaw fluid, respeclively.
3. ResuIts and Discussion
In lhe presenl work, velocity, pressnre and shear rale pro files in slenosed channels \Vere analyzed in order lo undersland the blood flow when this pathology appears.
In Fig. 3 it is possible to observe Úml lhe aÚleroma leads lo a distortion of Úle velocity profile developed in a cylindrical duct.
(a)
(b)
(c)
0 .009 7 0.0078
0.0058 0.0039
0.0019
0.0000
0.0086 0 .0069
0.0051
0.0034
0 ,00 17
0 .0000
0.0 082
0,0 066
0.0001 9 0.003 3
0 .0016
0.0000
Figure 3: Veloeity profiles (ms") in the plane z = O (see Fig. I) for ehannel CI fluid and distinct rheologieal models. (a) Newtonian; (b) Power-Iaw model; (c) Carreau model.
VELOCITY, PRESSURE AND SHEAR RATE DISTRIBUTlONS IN STENOSED CHANNELS
The influence of the non-Newtonian behaviour of blood is very small in lhe velocities developed in the studied chmmels, since the pro files present very similar aspect and the values of velocity were also very elose when considering the different constitutive equations (Fig. 3). However, a lower difference was verified between the velocities ohtained for the two non-NewtOlúan mo deIs for lhe three channels.
Quantitatively, lhe effecl of the atheroma can be evaluated by the increase of the maximum velocity obtained for the stenosed channels compared to the one predicted analytically for a flow of a power-law fluid in a cylindrical duct, wlúch
can be determined by (Eq. (3) with r = O):
311+ 1
vmat = - - 11.
11 + 1
(9)
From the values reported in Tab. 3 it is possible to observe that lhe influence of
the aÚleroma increases WiÚl the increase of lhe stenosis degree, as expected. ln
Úle referred tahle, lhe values of Vmax \Vere Úle ones obtained numerically and 1
represents the increase of Vmax due to lhe presence of lhe atheroma (v,mu for lhe
channel \ViÚlout alheroma \Vas calculated by Eq. (9)).
Table 3: [nerease of maximum veloeity due lo lhe presenee of lhe alherama.
C l C2 C3
Vmax (ms·l) 1(%) Vmax (ms'!) 1(%) "max (ms·l) 1(%)
Newtonian 0.0097 7.977 0.0108 20.2216 0.0 151 68.0876
Power-Iaw 0.0086 9.4080 0.0096 22.1299 0.0136 73.017
As observed for Ú,e velocity pro files , the shear rate distribution in Úle different
channels and for lhe different rheologica[ models \Vere qualitatively the same. ln
Fig. 4 it is possihle to observe that shear rate achieve its maximum in lhe top of the aÚlerama.
@CMMSE
30.8364
14.6721
1 a.5077
11.304
6.1791
o.QUe
Figure 4: Shear rate in the \Vali of lhe ehannel C3 and Carreau mode!.
VELOCITY, PRESSURE AND SHEAR RATE DISTRIBUTIONS IN STENOSED CHANNELS
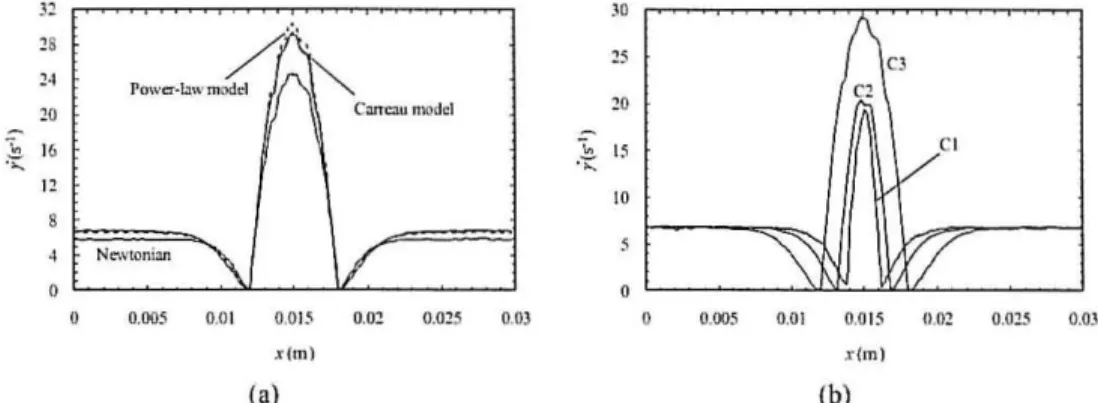
Two lines were eonsidered in a more detailed analysis of shear rate - Lines I and 2 represented in Fig.!. This way it was possible to study the impaet of the atheroma and rheologieal properties of the blood in the shear rate along the wall of the ehalmels.
Like observed in the veloeity field, the results obtained for the non-Newtonian models where very close (Figs. 5(a) and 6 (a)). The proximity of these results ean be explained by the linear behaviour between shear rate and viseosity predicted by the referred models in the range in which this study was performed.
"
/1".
pow~'''wm
''' d If\~
Can c:lu mo dc1.
JO
/JCJ
co"
25"
10/ C1
No:\\'tonbn
"
1/
'\'
fi
0.005 0.0 1 0.015 0.01 0.015 0.03 0.005 0.01 0.015 1),02 0,025 0.03
x lm) x /m)
(a) (h)
Figure 5: Shear rale along Line 2 (Fig. I l. (al Channel C3 and differenl rheologieal models. (b) Carreau model and dislinet channels.
In Fig. 5(a) the behaviour of the shear rate along Line 2 (Fig. I) can be clearly observed. Shear rate remains constant in the begin.ning of the chan.nel for about 4 nun before the atheroma and then decrease until a value close to O S·I in the base of the atheroma. Along the wall of the atheroma, shear rate exhibit a parabolic profile the maximum being reached in the top of the atheroma. As expected, the maximum shear rate increase with the increase of stenosis degree, Fig. 5(b).
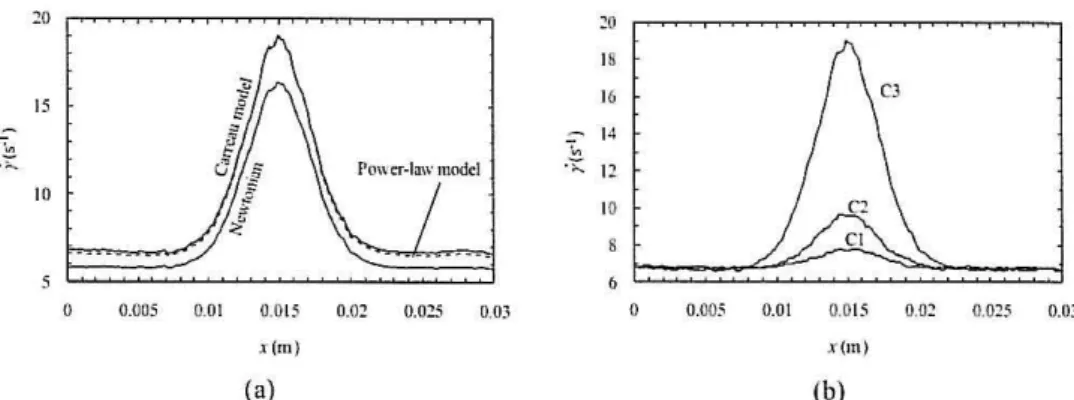
The impact of the existence of the atheroma along Line 2 is also felt in Line (Fig. I), as ean be observed in Fig. 6.
VELO CITY. PRESSURE AND SHEAR RA TE DlSTRIBUTIONS IN STENOSED CHANNELS
00
15
:
.E
10o 0.005 0.01 0.015 0, 01 0.025 0.03
x (m )
(a)
"
~~~~~~~~~~~--~ 18~ 14
"
.;:: 12
10
o 0.005 0.01 0,015 O . O ~ 0.02 5 0.03 x lm )
(b)
Figure 6: Shear rale along Line 1 (Fig. I). (a) Channel C3 for lhe differenl rheological models. (b) Carreau model and dislincl channels.
Like it was observed for the velocity and shear rate profiles, lhe pressure fields
were qualitative1y the same for the distinct channels and rheological models, Fig
7.
1.9572
1.5657 1.1701. 2
0.7826 0.391 1
0.0000
Figure 7: Pressure distribution (Pa) in the plane z
=
O for channel C3 and Carreau mode!.The pressure profile along Line 2 (Fig. I) is dependent of the used rheological model and the pressure drop along lhe atheroma is much lower when lhe Newtoman behaviour is considered (Fig. 8(a)).
2.5
2.0
L5
~
;:
1.0
O.:;
0.0
O 0.005 0.0 1 0.015 0.02 0.025 0.03 0.025 0.03
x(m)
(al
Figure 8: Pressure along Line 2 (Fig. I). (a) Channel C2 and dislincl rheological models. (b) Power-Iaw model and dislincl channels.
VELOCITY. PRESSURE AND SHEAR RATE DISTRIBUTlONS IN STENOSED CHANNE LS
In Figs. 8(a) and (b) it can also be observed lhat the pressure reaches a maximum in the wall of the atheroma.
In lhe opposite side of tile base of the atileroma, Line I (Fig.1
l,
the presence of this obstruction is also felt, as can be observed in Fig. 9. Since the influence of the atileroma is much lower along the referred line, ilie pressure for Newtonian fluid exhibits almos! a linear behaviour, as the one existent in a cylindrical duct.3.0
"
C3 ::.0f J.S
~
1.0
0.5
0.0
0.005 0.01 0.01 5 O.O ~ O,O:!5 O.O} 0.005 0.0 1 0.015 om O . O ~5 0.03
.1'{m) .rim)
(a) (b)
Figure 9: Pressure along Line 1 (Fig. 1 l. (al Channel C2 and distinct rheological models. (bl Power-Iaw model and distinct channels.
4. Concluding Remarks
In the present work, the influence of rheological properties of blood and stenosis degree in ilie properties of the laminar blood flow in stenosed chal1l1els has been studied using the commercial fmite element code POL YFLOW®. The governative equations were solved using different constitutive models - Newtonian fluid, power-Iaw model and Carreau model. Additionally, different computational domains were also analysed.
The impact of ilie different rheological models in tile velocity profiles were analysed and it was observed tilat velocities obtained for tile Newtonain fluid were slightly different from the ones predicted when ilie blood was considered a non-Newtonian fluid, this tendency being also observed for tile shear rate. Conceming ilie pressure profiles, different results were obtained for the distinct constitutive equations.
The analysis of pressure and shear rate developed in ilie wall of ilie chal1l1els shown tilat he maxinlUm shear rates were achieved in ilie top of tile ailieroma and pressure reaches a maximum in ilie wall of the atileroma.
VELOCITY, PRESSURE AND SHEAR RATE DISTRIBUTIONS IN STENOSED CHANNELS
When the walls of the atheromas are submitted to large pressures, it is possible to generate an endothelium disruption and consequently lead to the fomlation of a new thrombus. The numerical results revealed tbat pressure achieves a maximum in the walls ofthe atheromas, fact that can explain the referred clinicai problem.
5. Acknowledgements
The authors acknowledge the fmancial support provided by: PTDC/SAU-BEB/ I08728/2008 and PTDC/SAU-BEBIl05650/2008 from the FCT (Science and Teclmology Foundation) and COMPETE, Portugal.
6. References
[I) S.L. ROBBINS , R.S. COTRAN, V. KUMAR, T. COLLINS , FIII/damel/los
de Robbil/s - Patologia eSlrutllral e jimcliollal, Rio de Janeiro, 2000. [2) B.M. JOHNSTON, P.R. JOHNSTON, S. CORNEY, D. KILPATRICK,
Non-Newtonian bloodflow in Izllman riglzl corol/OI)' arteries: sleady stale simlllations, J Biomech 37 (2004) 709-720.
[3) H.M. METWALLY, R.M. MANGLICK, Elllzallced Izeol transfer dlle lO
cII/1/atllre-illdllced lateral vorlices in lamillar flows ill sillllsoidal corrugaled-plale clzOllllels, IntJHeatMassTransf 47 (2004) 2283-2292.
[4) C.S. FERNANDES, R.r. DIAS, J.M. NÓBREGA, J.M. MAIA, Laminar
.flow in clzevron-type plate Izeal exclzangers: CFD ana~ysis of lorlllosily,
slzopefactor andji-ictiollfactor, ChemEngProc 46 (2007) 825-833. [5) R.P. DIAS, C.S. FERNANDES, J.A. TEIXEIRA, M. MOTA, A.
YELSHIN, Slarclz allalysis IIsing lzydrodYllamic clzromalograplzy willz a
mixed-bed parlic/e colllmn, Carbohydrate Polymers 74 (2008) 852-857. [6) C.S. FERNANDES, R. DIAS, J.M. NÓBREGA, I.M. AFONSO, L.F.
MELO, J. M. MAIA, Simlllatioll of slirred yogllllrl processing dllrillg
coolillg ill plate Izem exclzallgers, JFoodEng 76 (2005) 433-439.
[7) C.S. FERNANDES, R.P. DIAS, J.M. NÓBREGA, lM. MAIA, Friclioll
faclO/'s of pOlVer-law flllids ill clzevron-Iype plate Izeat exclzallgers,
JFoodEng 89 (2008) 441-447.
[8) R. LIMA, C. S. FERNANDES, R. DIAS, T. ISHIKAWA, Y. IMAI, T.
Y AMAGUCm, Microscale .flow dYllamies of red blood ce/ls ill
mieroclzallnels: aI/ experimental alld nllmerieal allalysis, Computationa1 Vision and Medicai Image Processing: Recent Trends, Computational Methods in Applied Sciences 19,5pringer, London, 2011.
[9) R. B. BIRD, R. C. ARMSTRONG, O. HASSAGER, DYllamies of
Polymeric Liqllids, Jolm Wiley & Sons, New York, 1987.
[IO)F. DELPLACE, J. C. LEULIET, Gelleralized ReYllolds Illlmber for tlze
flow of pOlVer law flllids in cylilldrieal dllels of arbilrOl)' eross-secliol/,
ChemEngJournal56 (1995) 33-37.
![Table 1: Rheological properties ofblood [2].](https://thumb-eu.123doks.com/thumbv2/123dok_br/16988159.763472/2.897.172.748.985.1076/table-rheological-properties-ofblood.webp)