Marília da Silveira Gouveia Barandas
Licenciatura em Ciências de Engenharia BiomédicaRange of Motion Measurements Based on
Depth Camera for Clinical Rehabilitation
Dissertação para obtenção do Grau de Mestre em Engenharia Biomédica
Orientador :
Hugo Gamboa, Professor Auxiliar, Faculdade de
Ciências e Tecnologia da Universidade Nova de
Lisboa
Co-orientador :
José
Manuel
Fonseca,
Professor
Auxiliar,
Faculdade de Ciências e Tecnologia da
Universi-dade Nova de Lisboa
Júri:
Presidente: Prof. Doutor Mário Secca
Arguente: Profa. Doutora Isabel Nunes
Vogais : Prof. Doutor Hugo Gamboa
Range of Motion Measurements Based on Depth Camera for Clinical
Rehabil-itation
Copyright cMarília da Silveira Gouveia Barandas, Faculdade de Ciências e Tecnologia,
Universidade Nova de Lisboa
"If A is a success in life, then A equals x plus y plus z. Work is x; y is play; and z is keeping your mouth shut."
Acknowledgements
First, I would like to thank my supervisor, Hugo Gamboa, for welcoming at PLUX -Wireless Biosignals, S.Aand for agreeing to work with me during the last academic year. This experience gave me different tools regarding the business environment. I am very thankful to Professor José Manuel Fonseca, my co-supervisor, for all the support, motiva-tion and availability that greatly contributed in achieving the proposed objectives for this dissertation. His help was essential! He always found a better solution for my problems, even when I thought it was no longer possible. I also feel the need to thank him for being such an excellent professor.
I am also grateful to all PLUX workers for welcoming in their team and for creating a healthy environment every day. A special thanks to António Jordão for his patience and dedication in helping me whenever I needed. I also want to thank my thesis’ colleagues that shared this experience with me. My biggest thanks goes to Mafalda Camara for the friendship and support throughout the development of this work. Thank you for making my days a lot better, without you everything would have been more difficult. I want to thank Inês Machado for making me laugh every day with her jokes.
A special thanks to Ana Trindade for keeping me company on the last 5 years. With her presence everything was easier, a simple phone call was enough to solve an entire day’s problem. Thank you for the friendship and for being part of my life. Our stories will forever stay in my mind as one of the best phases of our lives.
I must thank Marcos Jerónimo, Filipe Gouveia, Diogo Capelo, Cristina Viegas, Rui Ventura, Paulo Poção and Luis Pedroso for helping me reviewing this work. Their help was very important for me.
the same time having so much fun during our awesome holidays. I love you all.
Abstract
In clinical rehabilitation, biofeedback increases the patient’s motivation which makes it one of the most effective motor rehabilitation mechanisms. In this field it is very helpful for the patient and even for the therapist to know the level of success and performance of the training process. The human motion tracking study can provide relevant information for this purpose. Existing lab-based Three-Dimensional (3D) motion capture systems are capable to provide this information in real-time. However, these systems still present some limitations when used in rehabilitation processes involving biofeedback. A new depth camera - the Microsoft KinectTM
- was recently developed overcoming the limi-tations associated with the lab-based movement analysis systems. This depth camera is easy to use, inexpensive and portable.
The aim of this work is to introduce a system in clinical practice to do Range of Mo-tion (ROM) measurements, using the KinectTM
sensor and providing real-time biofeed-back. For this purpose, theROMmeasurements were computed using the joints spatial coordinates provided by the official Microsoft KinectTM
Software Development Kit (SDK) and also using our own developed algorithm. The obtained results were compared with a triaxial accelerometer data, used as reference.
The upper movements studied were abduction, flexion/extension and internal/ex-ternal rotation with the arm at 90 degrees of elevation. With our algorithm the Mean Error (ME) was less than 1.5 degrees for all movements. Only in abduction the KinectTM
order of magnitude. Given the potential benefits, our method can be a useful tool for
ROMmeasurements in clinics.
Resumo
Em reabilitação clínica, o Biofeedbackaumenta a motivação do paciente, tornando-o um dos mecanismos de reabilitação motora mais eficazes. Neste campo é muito útil para o paciente e mesmo para o terapeuta saber o nível de sucesso e o desempenho do pro-cesso de treino. O estudo da captura de movimento humano pode fornecer informações relevantes para esta finalidade. Os sistemas de laboratório existentes de captura de mo-vimento 3D são capazes de fornecer esta informação em tempo real. No entanto, estes sistemas apresentam ainda algumas limitações quando usados em processos de reabili-tação envolvendobiofeedback. Uma nova câmara de profundidade o Microsoft Kinect -foi recentemente desenvolvido ultrapassando as limitações associadas com os sistemas de análise de movimento em laboratório. Esta câmara de profundidade é fácil de usar, barata e portátil.
O objectivo deste trabalho é introduzir um sistema para medições da amplitude de movimento na prática clínica, usando o sensor do Kinect e fornecendo biofeedack em tempo real. Para este efeito, as medições de amplitude de movimento foram calculadas usando as coordenadas espacias das articulações fornecidas pela Microsoft KinectSDK
oficial e também usando o nosso próprio algoritmo desenvolvido. Os resultados obtidos foram comparados com os dados de um acelerómetro triaxial, usado como referência.
da Microsoft obteve dados comparáveis. Nos outros movimentos o MEaumentou uma ordem de magnitude. Tendo em conta os potenciais benefícios, o nosso método pode ser uma ferramenta útil para medições da amplitude do movimento em clínicas.
Palavras-chave: Biofeedback, Câmara de Profundidade, Amplitude de Movimento,
Contents
Acknowledgements viii
Abstract xii
Resumo xii
Contents xiii
List of Figures xv
List of Tables xvii
Acronyms xx
1 Introduction 1
1.1 Motivation . . . 1
1.2 Objectives . . . 2
1.3 State of the art . . . 2
1.4 Thesis Overview . . . 5
2 Theoretical Background 7 2.1 Biofeedback . . . 7
2.1.1 Electromyography feedback. . . 8
2.1.2 Pressure or ground reaction force feedback . . . 9
2.1.3 Angular or positional feedback . . . 10
2.2.1 Magnetic systems . . . 10
2.2.2 Inertial systems . . . 11
2.2.3 Optical systems . . . 12
2.3 Image Processing Techniques . . . 19
3 Acquisition 25 3.1 Material and Equipment . . . 25
3.1.1 Triaxial Accelerometer . . . 25
3.1.2 Depth Camera. . . 26
3.2 Procedures . . . 28
3.3 Data Correspondence. . . 30
4 The Kinect Skeleton Tracking 33 4.1 Application . . . 33
4.2 Data Analysis . . . 34
4.3 Validation . . . 35
5 Proposed Algorithm 37 5.1 Image Processing . . . 37
5.2 Automatic Calibration . . . 38
5.3 Anatomical Landmarks . . . 41
5.3.1 Abduction . . . 41
5.3.2 Flexion/Extension . . . 44
5.3.3 Internal/External Rotation . . . 46
5.4 ROM Measurements . . . 48
5.5 Validation . . . 49
5.6 Real-Time . . . 50
6 Conclusions 53 6.1 General Results . . . 53
6.2 Future Work . . . 55
Bibliography 57
List of Figures
1.1 Thesis overview. . . 5
2.1 Surface Electromyography (sEMG) recording with an electrode placed on the surface of the skin above the muscle and an example of a raw signal with the signal decomposition to obtain individual motor unit action po-tentials [1]. . . 9
2.2 Ground reaction force and moment outputs for the AMTI force platform [2]. 9
2.3 Biaxial electrogoniometers from Biometrics Ltd. . . 10
2.4 The KinectTM
depth range. . . 15
2.5 The KinectTMSensor. . . . . 16 2.6 Relation between the distance of an object pointkto the sensor relative to a
reference plane and the measured disparityd. If the object is shifted closer to the sensor then the location of the speckle on the image plane will be displaced in theXdirection [3]. . . 17 2.7 Skeleton’s front side with NITE Tracked Joints (blue) and Microsoft Tracked
Joints (red).. . . 18
2.8 Combining erosion and dilation to produce an opening or a closing. The result is different depending on the order of application of the two opera-tions [4]. . . 22
2.10 Representation of the projections of the binary image. In the right side and in the bottom of the image are represented the horizontal and the vertical projections, respectively. . . 23
3.1 The MotionPlux system. . . 26
3.2 Depth data format from the KinectTM. . . . . 26 3.3 Representation of the coordinate system used, the KinectTM
field of view and the depth sensor range. . . 28
3.4 Representation of the KinectTMplane with
θdegrees in the angle of its motor. 29 3.5 Skeleton space coordinate system of the KinectTM. . . . . 29 3.6 Representation of the upper movements studied. . . 30
3.7 Representation of the steps to do a data correspondence between each sys-tem analysed. . . 31
4.1 Application developed with a Red-Green-Blue (RGB) frame with all tracked joints available represented with circles. . . 34
4.2 (a) Representation of the angles executed during an abduction movement with the troubling instants highlighted in grey; (b) Depth frame acquired in one of these troubling instants. . . 36
5.1 Representation of the image processing techniques used. . . 39
5.2 Representation of the subject measures in two frames from the KinectTM after processing them. In the left and right side of the images are repre-sented the horizontal projections of the binary image of half of the body. . 40
5.3 Representation of the main movement phases of abduction. . . 42
5.4 Representation of the shoulder detection based on the thorax inclination.. 44
5.5 Representation of the main phases of flexion/extension.. . . 45
5.6 Representation of the main phases of internal/external rotation. . . 47
5.7 Error bars for all movements studied in which the blue points represent the proposed algorithm and the red points the KinectTM
List of Tables
2.1 The KinectTMtechnical specifications of Field of View.. . . . 15
2.2 The KinectTM technical specifications of Data Streams. . . 15
2.3 Comparison of toolkits for interfacing with the KinectTM[6]. . . . . 19
2.4 Image processing techniques utilized. . . 21
4.1 Comparison between the KinectTMSkeleton Tracking and the MotionPlux. 35 5.1 Comparison between the proposed algorithm and the MotionPlux. . . 49
5.2 Performance of the image processing. . . 51
5.3 Performance of the calibration. . . 51
5.4 Performance of the anatomical landmarks. . . 51
Acronyms
2D Two-Dimensional
3D Three-Dimensional
AAPB Association for Applied Psychophysiology and Biofeedback
ACC Accelerometry
AM Active Marker
BRS Biofeedback Research Society
COF Centre of Force
COP Centre of Pressure
EMG Electromyography
IR Infrared
LED Light-Emitting Diode
ME Mean Error
PM Passive Marker
RGB Red-Green-Blue
RMS Root-Mean-Square
SDK Software Development Kit
sEMG Surface Electromyography
1
Introduction
1.1
Motivation
Nowadays, biofeedback is one of the most effective motor rehabilitation mechanisms [7]. Involving the user in his rehabilitation process gives a real perception of his evolution and increases the patient’s motivation. This factor alone creates a considerably faster recuperation progress.
The emerging technology offers solutions, like the Microsoft KinectTM, adequate to
the evaluation of the human position and the body’s movement. Through processing algorithms applied to depth images, it is possible to detect the joints’ positions as well as the angles executed during the subject’s movement. Nowadays, several technologies exist capable of evaluating the aforementioned parameters. Nonetheless, these systems still present limitations when used in rehabilitation processes involving biofeedback.
Thus, in the context of biofeedback, the KinectTM sensor offers information of great
1. INTRODUCTION 1.2. Objectives
1.2
Objectives
The main purpose of this thesis is to introduce a simple system in a clinical environ-ment forROMmeasurements, since there is currently a lack of practical and cost-efficient methods available for this purpose [8]. Generally, in clinics, theseROM measurements are done manually with a goniometer. However, their results present a 5-10 degrees error [9]. Thus we propose to improve these results with a faster and easier to use method that can provide real-time biofeedback.
In order to fulfil this goal, we needed to use the depth map information provided by a Depth Camera - the Microsoft KinectTM
- and developed an algorithm capable of detecting anatomical landmarks to compute the ROM measurements in glenohumeral movements1.
1.3
State of the art
Human motion tracking for clinical applications has been an active research topic since the 1980s [10]. In this field, human movement analysis has been done with different sens-ing principles such as magnetic, inertial and optical sensors. However, these systems are of limited use for clinical applications in rehabilitation processes. Optical systems with Active Marker (AM) or Passive Marker (PM) achieve high accuracy and large capture volumes. However, these systems are difficult to use in real-world applications due to their complexity, bulky size and space requirements [2]. Magnetic tracking systems are not bulky and require less space but the rather cumbersome cables carried by the patient and the limited accuracy due to magnetic field distortions caused by large metal objects makes its use very limited in clinics [2]. Inertial measurement systems are easy to use, have high sensitivity and large capture areas making them a very desirable alternative for portable3Dmotion capture. However, they are also susceptible to measurement er-rors mainly due to nearby metals, when magnetometers are present in their constitution [11].
Recently a new sensor based on depth images was developed by a company in Is-rael, named PrimeSense. This sensor, called KinectTM, gained the attention of many
researchers due to its low cost, portability and because it does not require body mark-ers to determine anatomical landmarks. Several studies have been performed using the
1. INTRODUCTION 1.3. State of the art
KinectTM
sensor and their applications have been diverse.
The 3Ddepth accuracy of the KinectTM has been evaluated by several researchers
[11][3]. Tilak Dutta [11] conducted a study to determinate the range, field of view and accuracy of the sensor. The gold standard reference used in this study was the Vicon motion capture system (Optical System withPM) that has a positional accuracy of 0.1 mm and angular accuracy of 0.15 degrees [12]. He concluded that the accuracy of a KinectTM motion capture system would be at least an order of magnitude less than that
of a Vicon system. However, this study was based on a static scene. The results obtained from the KinectTMfield of view and range are in agreement with Microsoft’s advertising
[13]. The study of Khoshelham et al. [3] showed that the KinectTMcan provide accuracy
of depth reconstruction from a few millimetres at short distance up to about 4 cm at the maximum range of the sensor.
The depth map information provided by Microsoft KinectTM has been used for
dif-ferent applications. Oikonomidis et al. [14] presented a novel model based on tracking the full pose of a hand in complex articulation using data acquired by a KinectTM
sen-sor. Also using depth images from the KinectTMsensor, Xia et al. [15] proposed a model
based approach which detects humans in all poses and provides an accurate estimation of the person’s whole body contour. Thus, their algorithm can be an alternative to conven-tional human detection that is mostly done with regular cameras. In a study conducted by Gama et al. [16] a prototype was developed that recognised wrong movements and when correct therapeutic exercises were done, showed its efficiency. Thus this method, that avoids wrong movements, can prevent lesions and optimises the recuperation.
Like the last study mentioned, numerous attempts have been made to use the KinectTM
sensor for rehabilitation. To use it as a motion capture system a specific software like OpenNI, PrimesenseNITE and the official Microsoft KinectTM SDK is normally used.
Clark et al. [17] developed a method for assessment of the postural control using the KinectTMsensor in combination with the MicrosoftSDKand their results provided
1. INTRODUCTION 1.3. State of the art
indicating that the measurements could be used to assess general trends in the move-ment, but when a quantitative estimation is needed, an improved skeletonization with an anthropometric model is necessary. These results were obtained at a range of 3 m.
Other approaches used the combination of the inertial sensors with the KinectTM,
in order to compensate the limitations of each other. Lanari Bó et al. [19] developed a method based on Kalman filtering to estimate joint angles with inertial sensors and its in-tegration with KinectTM
. The3Djoint position reconstruction with KinectTM
was based on the module developed by PrimeSense and in their work they studied three move-ments: sit to stand, squat and shoulder abduction/adduction. They concluded that when larger sensor errors are present, suitable calibration is required and for this reason they used the KinectTM
for conducting brief online calibration periods. Thus the KinectTM
provides the possibility of calibrating the inertial sensors in real-time, enables simpler initialisation procedures and a better visualisation of the estimated angles. However, the KinectTMshowed some limitations such as conditioned workspace and estimation errors
due to occlusions which can be compensated by the inertial sensors. With faster move-ments, the KinectTMhas some problems due its lower frame rate. Another study using
these two sensors was conducted by Hondori et al. [20] to monitor the patient’s intake gestures and distinguishing between healthy and paralysed body sides. They measured joints positions, angular displacements and the acceleration of the object which is held by the subject. Their research can be used to generate feedback on the patient’s health status in the post-stroke telerehabilitation.
TheROMmeasurements have been studied too. Fernandez-Baena et al. [21] agreed with the previous studies mentioned and used OpenNI and PrimeSenseNITE. To eval-uate the accuracy of the KinectTM they also used an optical system as a reference and
obtainedMEbetween 5 and 13 degrees. They claim that the KinectTM
has several advan-tages and the precision ranks obtained are sufficient to use it for rehabilitation treatments. They developed an application for knee rehabilitation that automatically counts repeated movements and validates the quality of such motion. They also defend that the precision of the KinectTMcan be increased by imposing some restrictions such as fixing length for
the bones or working directly with the depth map information. Kitsunezaki et al. [9] studied three applications for the physical rehabilitation using the KinectTM, where one
1. INTRODUCTION 1.4. Thesis Overview
the angles computed with manual values obtained by an assistant with a protractor, re-sulting in differences from 2% to 9% for the upper limb.
We believe that the algorithms developed by Microsoft and PrimeSense for skeleton tracking are useful for some applications. However, when the required pose occludes some body parts or when the precision of theROMmeasurements is required, these al-gorithms are insufficient. To overcome these problems some researches are working with the depth information to create their own modules. In [22] the authors created their own tracking module using the depth sensing data obtained from the KinectTM. However
they only detected and tracked the head, the shoulders and the hands, which is insuf-ficient to doROMmeasurements. Thus, we propose to measure them working directly with the depth map information to get a better approximation of the joints’ positions.
1.4
Thesis Overview
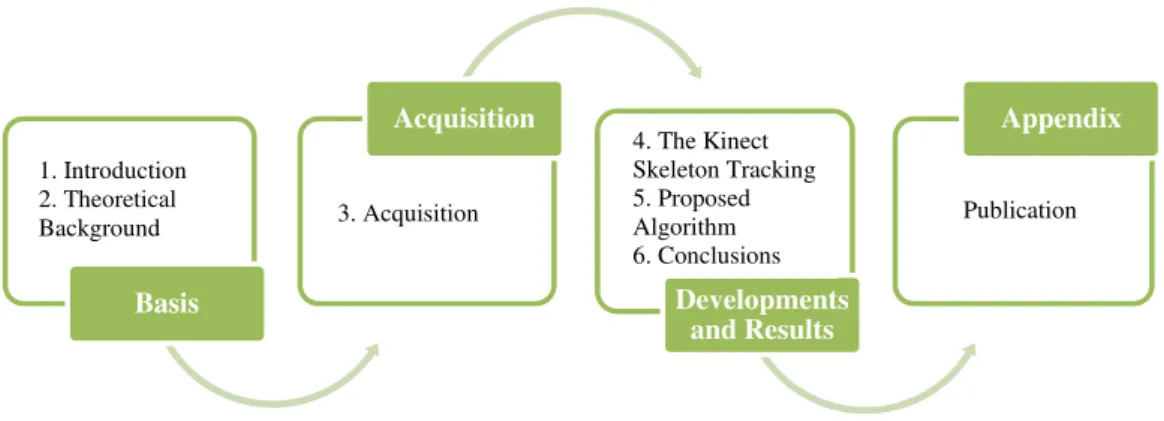
This thesis is organized in six chapters and one appendix, and its structure is represented schematically in Figure1.1.
Basis Acquisition Developments and Results Appendix 3. Acquisition 1. Introduction 2. Theoretical Background
4. The Kinect Skeleton Tracking 5. Proposed Algorithm 6. Conclusions
Publication
Figure 1.1: Thesis overview.
1. INTRODUCTION 1.4. Thesis Overview
Chapter3 focuses on the procedures to do the data collection with all systems used and constitute the acquisition part of the thesis. A triaxial accelerometer was used as reference to validate the two approaches to computeROMmeasurements, the KinectTM
Skeleton Tracking and our proposed algorithm.
The last three chapters address the development and results obtained for both ap-proaches analysed. Chapter4presents the development of an application to receive the joints’ positions provided by the Microsoft KinectTM
SDKand compute the angles exe-cuted during the movement. The results demonstrated the need for creating a new al-gorithm able to overcome the limitations of the previous. In Chapter5, a new algorithm to computeROMmeasurements is proposed as well as its validation with a triaxial ac-celerometer. The last chapter presents an overview of the developed work, results and some future work suggestions.
There is one additional appendix that contains the paper submitted in the context of this research work.
The application to receive the KinectTMinformation was developed in C# using the
V isual Studio 2010and the official drivers provided by Microsoft. The proposed
algo-rithm was developed inP ythonand the image processing techniques required the use of
2
Theoretical Background
In this chapter, the main theoretical concepts that were used in this research are pre-sented. Contextual information about Biofeedback, the systems that can provide human motion tracking and the image processing techniques will be addressed.
2.1
Biofeedback
In 1969, the term biofeedback was officially defined at the first meeting of the Biofeedback Research Society (BRS). In 1988,BRSbecame the Association for Applied Psychophys-iology and Biofeedback (AAPB) and defined biofeedback as “a process that enables an individual to learn how to change physiological activity for the purposes of improv-ing health and performance. Precise instruments measure physiological activity such as brainwaves, heart function, breathing, muscle activity, and skin temperature. These instruments rapidly and accurately ‘feed back’ information to the user. The presentation of this information — often in conjunction with changes in thinking, emotions, and be-haviour — supports desired physiological changes. Over time, these changes can endure without continued use of an instrument”.
The purpose of this research is to use the biofeedback in rehabilitation to improve certain motor functions, so we are focusing only in motor biofeedback from now on.
2. THEORETICALBACKGROUND 2.1. Biofeedback
know the level of success and performance of the training process. This performance is often derived from afference and reafference and can also be described as intrinsic feed-back. Thus, the feedback can be divided into two categories, intrinsic feedback and ex-trinsic feedback. The inex-trinsic feedback is generated by movement itself, proprioception or vision of the moving limb, but also sound of footsteps. On the other hand, extrinsic or augmented feedback may be provided additionally by an outside source, such as a therapist [7]. We are interested to improve the extrinsic biofeedback, since it is important for learning some motor tasks. Furthermore, when patients know about their progress, usually this is translated in increasing their motivation, and some researches claim that a growth in motivation is translated into a greater effort during task practice [7]. Pursu-ing and achievPursu-ing goals are also reasons to keep the patients motivated. So, the required measurements to compare the current status with the desired goal, are achieved by a biofeedback equipment.
The clinical applications of biofeedback are increasingly being used in rehabilitation medicine for the treatment of many varied disorders by providing visual or audio feed-back. The most usual biofeedback technique is the electromyographic that supplies infor-mation about muscle contraction. However, there are other techniques that are used for feedback purposes in rehabilitation medicine as force, position and joint angle monitors for recording body posture and movement [23].
2.1.1 Electromyography feedback
Electromyography (EMG) was employed as a primary biofeedback source to down-train activity of a hyperactive muscle or up-train recruitment of a weak muscle, thus improv-ing muscular control over a joint [24]. TheEMGsignal can be recorded in two different ways. With one of them, it is necessary to insert a needle electrode into the muscle tissue, that is called intramuscularEMG, the other, known as sEMG, uses an electrode placed on the skin over a muscle (see Figure2.1). In biofeedback onlysEMGis used and thus in this research theEMGsignals are all acquired using this non-invasive method.
2. THEORETICALBACKGROUND 2.1. Biofeedback
and causes its own electric signal which leads to a contraction.
Figure 2.1:sEMGrecording with an electrode placed on the surface of the skin above the muscle and an example of a raw signal with the signal decomposition to obtain
individual motor unit action potentials [1].
2.1.2 Pressure or ground reaction force feedback
Force platforms or force plates were often used as feedback sources during balance re-training programs, providing the locus of the Centre of Force (COF) or Centre of Pres-sure (COP) to patients, as well as training protocols to enhance stance symmetry, steadi-ness and dynamic stability. Researches were made with these platforms indicating that the patients who received the biofeedback training were having a faster progress than the patients who received a traditional physical therapy [25].
There are two types of force platforms that are widely used, one of them based on piezo-electric transducers and the other one based on strain-gauge transducers. A stan-dard force platform consists of four triaxial force sensors measuring the three orthogonal components of the applied forces, the vertical torque and the anterioposterior or medi-olateral coordinates of theCOP. Figure2.2shows a ground reaction force and moment outputs for a force platform that is based on strain-gauge transducers.
2. THEORETICALBACKGROUND 2.2. Human motion tracking
2.1.3 Angular or positional feedback
Angular or positional biofeedback was used to improve patients’ ability to self-regulate the movement of a specific joint. To measure joint angles, electrogoniometer devices are used. These produce an output voltage proportional to the angular change between the two attached surfaces. The angles can be measured in a single plane or for bi-planar movements and do not require attachment to joint centres, having instead attachments for the two segments spanning the joint. There are different kinds of electrogoniometers such as potentiometric and flexible electrogoniometers and fiber-optic goniometers. The most commonly used in medicine is the flexible electrogoniometer, shown in Figure2.3, that provides free joint’s motion.
Figure 2.3: Biaxial electrogoniometers from Biometrics Ltd.
2.2
Human motion tracking
The ability to analyse human movement is an essential tool of biomechanical analysis for clinical applications and has been an active research topic since the 1980s. Human move-ment tracking systems are expected to generate real-time data dynamically representing the changes in pose of a human body, or a part of it, based on well developed motion sensing technologies [10].
There are three main types of 3D motion analysis systems: magnetic, inertial and optical systems. In the following sections there is a description of the these systems.
2.2.1 Magnetic systems
2. THEORETICALBACKGROUND 2.2. Human motion tracking
sampling rate and the fact that line of sight between sensor and receptor is not required constitute advantages of these kind of systems. In several studies [10][26] [27], the main cited disadvantages are the short operating ranges, the system accuracy when a large vol-ume of operation is desired and the magnetic field itself, which gets distorted by several kinds of metals. However, the field of operation is actually comparable with, or better than, some optical systems [2], but magnetic fields lose strength as the receiver moves away from the transmitter. The accuracy of these systems should be confirmed in every setting because different physical environments will affect the magnetic field differently. The current research is focused on tackling the effect of the distortion of magnetic fields and several studies show that some algorithms are able to minimise this effect [10].
The two main commercially available magnetic systems are produced by Ascension and Polhemus. Zachmann et al. [26] compared the susceptibility of the Polhemus’s Fas-trak and the Ascension’s Flock-of-Birds and the results pointed to the Ascension system as less susceptible to ferro-magnetic metals than Polhemus.
2.2.2 Inertial systems
Inertial sensors are constituted by accelerometers and gyroscopes and provide informa-tion about posiinforma-tion and accelerainforma-tion of the body part where the sensor was placed. Some of them also include magnetometers. Besides their low cost and ease of use, other advan-tages of the inertial systems are their high sensitivity and large capture areas that make their use frequent for full-body human motion detection. However, the data from the sensor can not be correctly determined due to the fluctuation of offsets and measurement noise, leading to integration drift. Therefore, designing drift-free inertial systems is the main target of the current research [10].
Zhou et al. [28][10] wrote several papers on this topic and presented in 2010 [29] a new inertial-sensor-based monitoring system for measuring the movement of human upper limbs using two wearable inertial sensors with triaxial accelerometers and gyroscopes. Their results showed that the measurement drift in segment orientation is dramatically reduced after a Kalman filter is applied to estimate inclinations using accelerations and turning rates from gyroscopes.
2. THEORETICALBACKGROUND 2.2. Human motion tracking
sensing are examples of applications of Accelerometry (ACC). These sensors are capable of estimating the acceleration along the tri-axis and detecting the acceleration’s magni-tude or direction change rate. In order to calibrate the gain and the zero offset, the pro-priety that an accelerometer at rest with its sensitive axis pointing toward the centre of the Earth will have an output equal to 1 g is commonly used [30].
The two main commercially available systems with inertial sensors are MT9 of Xsens Motion Tech and G-link of MicroStrain. These systems are similar and both have wireless properties, indicating that they are not limited in space. The MT9 based system is a digital measurement unit that measures 3Drate-of-turn, acceleration and earth-magnetic field and the G-Link system is a high speed, triaxial accelerometer node, designed to operate as part of an integrated wireless sensor network [10].
2.2.3 Optical systems
Optical systems can be further divided into passive and active systems depending on the type of the markers that each system uses. There are also cameras based on depth images that do not need any kind of markers .
2.2.3.1 Passive Marker
PMsystems use reflective markers attached to the patients, enabling them to reflect the light by an external source. Reflections from the markers are tracked using multiple video cameras. Infrared (IR) flash illuminators surround each camera lens sending out pulses ofIRlight that are reflected back into the lens from the markers. This system requires at least 2/3 cameras but 6/8 is the recommended minimum because the markers are often obscured from one or more cameras or their trajectories cross [2]. So, the space required for the operation of these systems is a big limitation on their use by clinics. Furthermore, marker slippage, markers leaving the volume, bad volume calibration, ghosting, bad threshold level, stray light and cost are some of the problems ofPMsystems.
2. THEORETICALBACKGROUND 2.2. Human motion tracking
2.2.3.2 Active Marker
In the case ofAMsystems, each marker is aIRLight-Emitting Diode (LED), so the mark-ers generate their own light, unlike thePM. This system also needs markers attached to the patient. One of the major advantages overPMis that, with only one marker flashing at any one time, this system can automatically identify and track each marker. However, after sampling the first marker, it must sample all others before it can sample the first one again. Thus, the sample rate reduces as the number of markers increases [2]. AM
uses three cameras mounted in a rigid housing to track the light emitted by the markers. These systems have accuracy and noise similar to thePMand their main problems are occlusion of markers and markers passing out of the capture volume; even so,AM sys-tems provide easy setup and calibration, excellent spatial resolution (as low as 0.1 mm) and the ability to place markers close together make their use more suitable in certain situations.
There are many commercially available optical systems and J. Richards [31] con-ducted a study to compare some of them. PMsystems reviewed in this study included the Ariel system, BTS’s ElitePlus system, Motion Analysis’ HiRes system, Peak Perfor-mance’s Motus system, Qualisys’ ProReflex system and Vicon’s 360 system. Charnwood Dynamic’s CODA system was the sole AMsystem that was tested. The results of this study revealed that Peak Motus, Vicon and Motion Analysis systems were the fastestPM
systems providing the3Ddata. However, for theAMsystem3Ddata was immediately available following data collection. Furthermore, all passive optical systems confused marker identifications when markers moved within 2 mm of each other in a 3 mm long volume.
2.2.3.3 Depth Cameras
2. THEORETICALBACKGROUND 2.2. Human motion tracking
avoids this by measuring the phase shift between emitted and received modulated light which directly corresponds to the time-of-flight. The main limitations of these cameras are low resolution, low sensitivity resulting in high noise levels and background light. Until 2010, year that Microsoft and PrimeSense released the KinectTM sensor, the laser
scanners and structured light approaches were not able to provide high frame rates for full images with a reasonable resolution.
Structured-light3Dscanning is a method that involves highly accurate and expensive scanners and it is based on the projection of a narrow band of light onto a 3D shaped surface producing a line of illumination. Using the deformation of the band when seen from a point of view different from the source to measure the distance from each point to the camera and thus reconstitute the3Dvolume. A faster method, with a high number of samples simultaneously, is achieved with a projection of patterns consisting of many stripes of light at the same time. However, the KinectTM
system is a little different and the measurement of depth is described by the inventors as a triangulation process. Instead of projecting stripes of visible light, theIRprojector emits a single beam which is split into multiple beams by a diffraction grating to create a constant pattern of speckles which bounces on the objects and is captured by theIRcamera [33][3].
To convert the light coding image to a depth map, a chip (PrimeSense’s PS1080 chip [33]) is necessary. This chip compares the image received with a reference image stored in the chip’s memory as the result of a calibration routine performed on each device during the production process [33]. So, each KinectTMis calibrated to know exactly where each
dot from its projector appears when projected against a flat wall at a known distance. When a dot is projected on an object whose distance to the sensor is smaller or larger than that of the KinectTM’s calibration, the position of the dot in theIRimage will be shifted in
the direction of the baseline between theIRprojector and the perspective centre of theIR
camera. These shifts are measured for all dots by a simple image correlation procedure, which yields a disparity image. In every part of the image that the KinectTM
captures from theIRcamera, each dot will be a little out of position from where the KinectTMwas
expecting to see it [34][3].
Contrary to other depth cameras, the Microsoft KinectTMhas a very low price,
mak-ing it a very desirable system. Moreover, the KinectTMhas a good working range
2. THEORETICALBACKGROUND 2.2. Human motion tracking
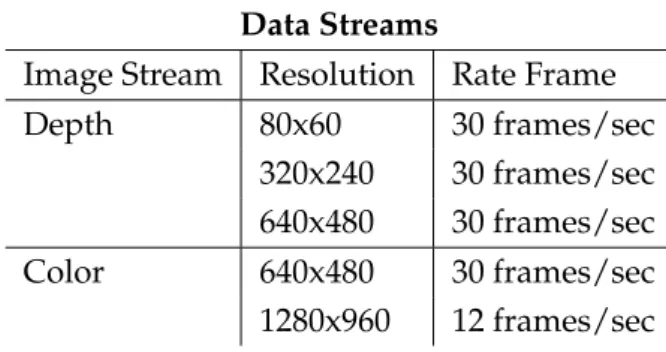
under a large variety of conditions [35]. The technical specifications provided by the Mi-crosoft KinectTMsensor are provided in Table2.1and2.2and in Figure2.4the KinectTM
depth range is presented. Only in the Kinect for Windows sensor the near range repre-sented in Figure2.4is available [13].
In comparison with other systems mentioned in the previous sections, the Microsoft KinectTM has some benefits like portability, low cost and not requiring markers to
de-termine anatomical landmarks. For these reasons, this system gained the attention of several researches.
Field Of View
Horizontal field of view 57 degrees Vertical field of view 43 degrees Physical tilt range ±27 degrees Depth sensor range 0.8 m - 4 m
Table 2.1: The KinectTMtechnical specifications of Field of View.
Data Streams
Image Stream Resolution Rate Frame Depth 80x60 30 frames/sec
320x240 30 frames/sec 640x480 30 frames/sec Color 640x480 30 frames/sec 1280x960 12 frames/sec
Table 2.2: The KinectTMtechnical specifications of Data Streams.
2. THEORETICALBACKGROUND 2.2. Human motion tracking
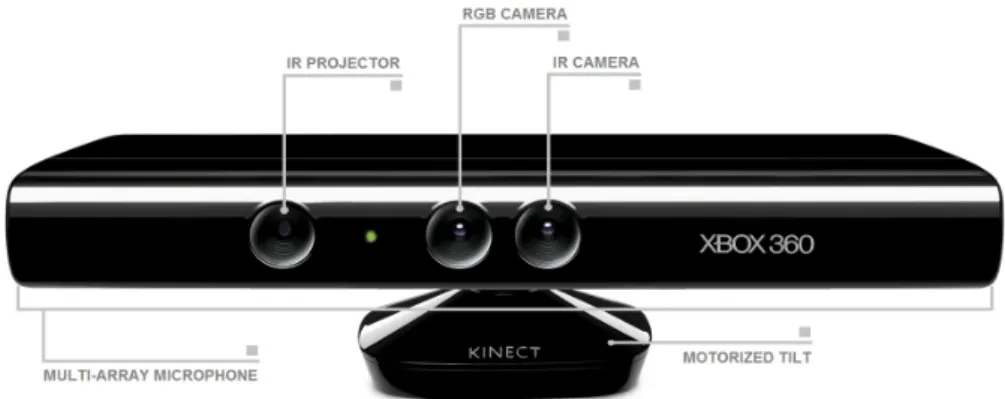
The KinectTM
consists of aRGBcamera, anIRcamera and anIRprojector. TheRGB
camera collects the light that bounces off of the objects in front of them and turns this light into a Two-Dimensional (2D) image that resembles what we see with our own eyes. The IRprojector shines a grid ofIRdots over everything in front of it and it is possible to capture a picture of these dots using anIRcamera. AnIR camera works in the same way as the RGB camera but instead of using visible light, it uses theIR light to create an image (a depth image) that captures not what objects look like, but where they are in space. Therefore, the camera records the distance of the objects that are placed in front of it.
The KinectTMstill has four microphones that capture the sound as well as being able
to locate the sound within the room, but they will not be used in this work. Inside the KinectTM’s plastic base is a small motor and a series of gears. By turning this motor, the
KinectTMcan tilt its cameras and speakers up and down. The motor gives the KinectTM
the ability to aim itself at the best point for capturing people [34]. Lastly, a tri-axis ac-celerometer configured for 2 g range with a 1 degree accuracy upper limit is also present, where g is the acceleration due to gravity. Thus, accelerometer data can help detect when the KinectTM sensor is in an unusual orientation [13]. Figure 2.5 shows the KinectTM
sensor with the components mentioned before.
Figure 2.5: The KinectTMSensor.
K. Khoshelham et al. [3], in 2012, presented an investigation of the geometric qual-ity of depth data acquired by the KinectTM
sensor and obtained the basic mathematical model for derivation of depth from the observed disparity represented by the following equation (2.1),
Zk=
Zo
1 +Zo
f bd
2. THEORETICALBACKGROUND 2.2. Human motion tracking
whereZk denotes the distance (depth) of the point kin object space, Zo is the distance
from the flat wall used in calibration to the sensor,bis the base length,fis the focal length
of theIRcamera anddis the observed disparity in image space.
The equation 2.1is obtained by the similarity of triangles represented in Figure2.6. In this figure theZ axis is orthogonal to the image plane towards the object, theXaxis
perpendicular to theZaxis in the direction of the baselinebbetween theIRcamera centre
and the laser projector, and the Y axis orthogonal toX andZ making a right-handed
coordinate system.
The planimetric object coordinates of each point can be calculated from its image coordinates and the scale by the following equations (2.2and2.3),
Xk=−
Zk
f (xk−xo+δx) (2.2)
Yk=−
Zk
f (yk−yo+δy) (2.3)
wherexkandyk are the image coordinates of the point,xoandyo are the coordinates of
the principal point, andδxandδyare corrections for lens distortion, for which different
models with different coefficients exist.
Figure 2.6: Relation between the distance of an object pointkto the sensor relative to a
reference plane and the measured disparityd. If the object is shifted closer to the sensor
then the location of the speckle on the image plane will be displaced in theXdirection
[3].
2. THEORETICALBACKGROUND 2.2. Human motion tracking
movements performed by adding more detailed information as joints’ detection, angles made by them during the movement and dimensions of members.
However, the method used by KinectTM, like any optical method, has some problems
with certain objects’ surfaces depending on their reflectivity. The dark surfaces absorb light emitted from theIR projector and this light is not reflected back to theIR camera resulting in a gap in the point cloud. Shiny surfaces cause specular reflection and rough surfaces may also be blind to the KinectTMif the angle of incidence of incoming light is
too large. In these cases,3Dreconstruction also has gaps from the respective surfaces. In order to access the KinectTM data streams for rehabilitation purposes, drivers are
necessary to connect the KinectTM
to a computer. The first open source drivers made were Libfreenect Drivers developed by the OpenKinect community. This community continues to improve and maintain the drivers to this day. It currently supports access to theRGBand depth images, the KinectTMmotor, the accelerometer and theLED[33].
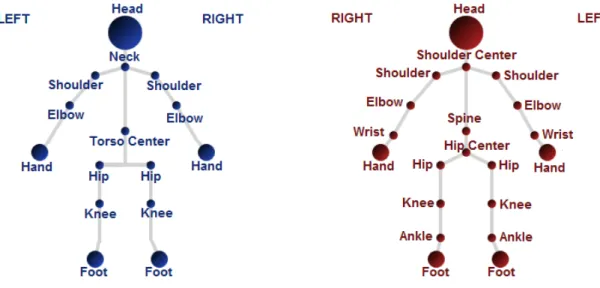
Figure 2.7: Skeleton’s front side with NITE Tracked Joints (blue) and Microsoft Tracked Joints (red).
Due to the interest of the use of the KinectTM, PrimeSense which is the company that
developed the technology behind KinectTM3Dimaging, released their software to work
with the KinectTM. Their drivers added the possibility to detect users and locate the
2. THEORETICALBACKGROUND 2.3. Image Processing Techniques
access to motor or the accelerometer because these two components are developed by Mi-crosoft. The optics and the microchip were developed entirely by PrimeSense, so OpenNI framework allows access only for these components. The second module, which is called NITE, is the most attractive part, however NITE is not available under an open source license. PrimeSense provides a royalty-free license that can be used to make projects that use NITE with OpenNI, but it is not currently clear if this license can be used to produce commercial projects [34]. NITE gives access to algorithms for gesture recognition, feature detection and joint tracking.
Six months after PrimeSense released its drivers, Microsoft announced the release of the official Microsoft KinectTM SDK. ThisSDKallows the access to all the KinectTM
sensor capabilities plus hand/skeleton tracking. However one of the big limitations for programmer communities is that drivers are only available for Windows, leaving out the Linux and Mac OSX. Moreover, the development of applications is limited to C++, C#, or Visual Basic using Microsoft Visual Studio [33]. Nevertheless, Microsoft KinectTMSDK
offers several important advantages over the OpenNI that are referenced in Table2.3. The number of tracked joints is also different between these drivers as it can be seen in Figure
2.7.
OpenNI MicrosoftSDK
Raw depth and image data Yes Yes Joint position tracking Yes Yes API-supported gesture recognition Yes No Save raw data stream to disk Yes No Joint tracking without calibration No Yes
Development in C# No Yes
Audio processing including speech recognition No Yes
Easy installation No Yes
Number of joints available 15 20 Quality of documentation Adequate Excellent
Table 2.3: Comparison of toolkits for interfacing with the KinectTM[6].
2.3
Image Processing Techniques
2. THEORETICALBACKGROUND 2.3. Image Processing Techniques
coordinates in a plane, and the amplitudef at any pair of coordinates(x, y)is called the intensity or gray level of the image at that point. Whenx,yandf are all finite, discrete
quantities, the image is called digital image and its processing is called digital image pro-cessing. A digital image is composed of a finite number of elements, named pixels, and each of those has a particular location and value. Digital image processing is performed on digital computers that manipulate images as arrays or matrices of numbers [5].
Image processing is any kind of method whose input and output are images and im-age analysis is a method whose inputs may be imim-ages, but whose outputs are attributes extracted from those images.
The methods used in this research were chosen in order to minimise the processing time during the acquisition, since the final objective is to develop a real-time application. The sequence of steps to apply in image processing techniques depend on the final objec-tive, without specific rules. In Table2.4a sequence of techniques utilized in this thesis is presented.
Image segmentation is an essential concept related with image processing. If it is not done correctly, the rest of the image processing analysis can be affected. In this step, a grey-level image is converted in a bilevel image. A bilevel image is a monochrome image only composed by black and white pixels [36]. Therefore, irrelevant information for the image analysis is excluded, assigning a value of 1 to the useful information and a value of 0 to the background. With this operation the amount of data is significantly reduced, making the processing easier. In this work, a background subtraction is used for this purpose. This method is widely used for detecting moving objects in videos from static cameras. The differences between the current frame and the reference frame are computed to isolate the objects of interest. Thus the moving objects are classified as white (1) and the background as black (0). Other methods, like thresholding, exist and are able to do the segmentation of the image. The most essential thresholding operation will be the selection of a single threshold value. All the grey levels below this value are classified as black, and those above it white. However, most of the time it is impossible to segment an image into objects and background with a single value because of noise and illumination effects. Other thresholding methods likeMean Value,P-Tile,Edge Pixel,
2. THEORETICALBACKGROUND 2.3. Image Processing Techniques
Step Technique Description
1 Segmentation
Conversion between a
grey-level image and a
bilevel image
2 Morphological Operations Improve the image
3 Morphological Algorithm Object detection
4 Attributes Extraction
Proprieties extraction of
the detected object
(Area)
5 Classification Classification of the detected object
Table 2.4: Image processing techniques utilized.
2. THEORETICALBACKGROUND 2.3. Image Processing Techniques
closing is a combination of a dilation followed by an erosion [4]. This operation gener-ally fuses narrow breaks and long thin gulfs, eliminates small holes and fills gaps in the contour [5]. In Figure2.8 a result of the application of the two primitive operations in a different order is represented.
Figure 2.8: Combining erosion and dilation to produce an opening or a closing. The result is different depending on the order of application of the two operations [4].
The main application of morphology is extracting image components that are useful in the representation and description of shape. For this purpose, morphological algo-rithms were developed for extracting boundaries, connected components, the convex hull and the skeleton of a region. As in this work the objective was isolating only one component in the image, an algorithm for boundary extraction was used. Thus, the boundaries in an image can be obtained by first eroding the original image and then performing the set difference between the original image and its erosion. This algorithm retrieves all contours of the binary image. In Figure2.9is shown a result of the applica-tion of this algorithm.
2. THEORETICALBACKGROUND 2.3. Image Processing Techniques
(a) (b)
Figure 2.9: Morphological algorithm: (a) original test image; (b) Result of using a algorithm for boundary extraction. Adapted from [5].
image. The vertical projection is the sum of the pixels in each column of an image. On the other hand, the horizontal projection is the sum of the pixels in each row of an image. In Figure 2.10a binary image with the respective vertical and horizontal projections is shown.
Figure 2.10: Representation of the projections of the binary image. In the right side and in the bottom of the image are represented the horizontal and the vertical projections,
3
Acquisition
This chapter exposes the data acquisition procedure to validate the KinectTM Skeleton
Tracking as well as the proposed algorithm, using as reference a triaxial accelerometer. The data correspondence between both systems is also presented.
3.1
Material and Equipment
In this research, we have compared data from the Kinect against triaxial accelerometer data. Therefore, in the following points, there is a description of both used systems.
3.1.1 Triaxial Accelerometer
To validate the KinectTMSkeleton Tracking and the proposed algorithm, a reference
sys-tem was needed. The sensor chosen for this purpose was a triaxial accelerometer. This sensor was used to measure arm movements, like abduction and flexion, and it was vali-dated in a study developed by Eva Bernmark et al. [37] with an optoelectronic measuring system. Their results showed that the correspondence between the two systems was al-most perfect when the movements were done without influence of dynamic acceleration. The triaxial accelerometer values were on average 1 degree lower than the optoelectronic values.
3. ACQUISITION 3.1. Material and Equipment
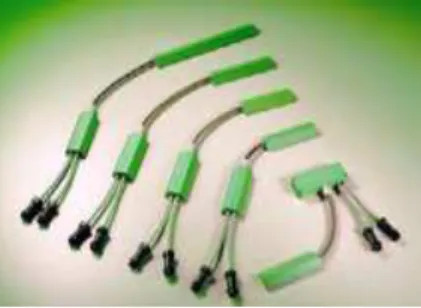
an inclination sensor, to measure the inclination of a body segment in relation to the ver-tical line (the line of gravity). With this device it is possible to define3Dvectors in space and measure the angle between them with constant sensibility over 360 degrees [39]. The MotionPlux is a device that collects and digitalizes signals from a triaxial accelerometer, transmitting them via bluetooth to the computer where the signals are shown in real-time. This system is portable, small sized and has a sampling frequency of 800 Hz.
Figure 3.1: The MotionPlux system.
3.1.2 Depth Camera
As mentioned before, the depth camera used in this research was the KinectTM sensor
and its description is presented in section 2.2.3.3. However, for the next sections it is important to know relevant informations related to the recorded frames. The depth in-formation is encoded in an IFTImage as 16 bits per pixel encoded as Little Endian [13]. Thus, each pixel is represented by 2 bytes but only 12 bits are used to represent the dis-tance from camera (in millimetres) to object perceived at pixel. The data format for these 16 bits is represented in Figure 3.2. The most significant bit (Bit 15) is unused in depth
Figure 3.2: Depth data format from the KinectTM
3. ACQUISITION 3.1. Material and Equipment
calculations, the bits from 14 to 3 contain the depth data and the last three bits (Bits 2:0) contain the PlayerID that owns the depth data. Although the depth data uses 12 bits, in this thesis only 8 bits were used for the calculations. Therefore, the last and less signif-icant 4 bits were discarded. These bits represent only 15 mm, therefore, each measured value can have a maximum error of 15 mm. This decision was made because the im-age manipulation is easier with imim-ages with 8 bits per pixel and due to the noise level of the Kinect, the bits discarded do not represent useful information for the calculations (empirically tested).
The coordinate system for all image frames used in this thesis is shown in Figure3.3. Its origin is in the KinectTM
plane with the Z axis orthogonal to the image plane. In
the image plane the X axis is the horizontal and the Y axis is the vertical. Figure 3.3
also represents the KinectTM
field of view,57◦horizontal and43◦vertical, as well as the
depth space range in the default range where the distances from 800 millimetre to 4000 millimetres are considered normal values.
The objective of this research is to compute ROM measurements in glenohumeral movements, so the angle was calculated between the arm and a defined reference. This reference can be the world or the subject’s thorax. As the KinectTM
has a motor with a tilt range of−27◦ to27◦, if the user chooses to use the world as reference, the motor angle
needs to be considered. In Figure3.3 the KinectTM motor angle is
0◦, so the KinectTM
plane is parallel to the flat wall and in this case the world reference was defined as a vertical straight line that goes through to the joint of interest. However, in Figure3.4the KinectTM plane is not parallel to the flat wall, therefore the distances between them are
greater in the top of the image than in the bottom of the image. Thus, in this case the reference used was a straight line that goes through to the joint of interest with the same inclination of the KinectTMmotor.
Unlike in depth space, skeleton space coordinates are expressed in metres. The X, Y and Z axes are the body axes of the depth sensor as shown in Figure3.5. The skeleton space coordinate system places the KinectTMat the origin with the positive z-axis
extend-ing in the direction in which the Kinect is pointed. The positive Y axis extends upward, and the positive X axis extends to the left [13].
The KinectTM sensor was used to record the joints’ spatial coordinates provided by
3. ACQUISITION 3.2. Procedures
Figure 3.3: Representation of the coordinate system used, the KinectTMfield of view and
the depth sensor range.
3.2
Procedures
In the tests executed to validate the algorithms, the KinectTM
sensor was positioned in front of a flat wall with its plane parallel to the flat wall and the subject at an approximate distance of 2 meters from it. Although the flat wall is the best environment to do the ac-quisitions, one may also use other kinds of environments as long as their surfaces are not dark, shiny and rough. At it is known, dark, shiny and rough surfaces may affect the3D
reconstruction creating undesirable gaps in the depth map. The MotionPlux was placed in the subject’s arm, aligned with the humerus and with the positiveY axis pointing the
3. ACQUISITION 3.2. Procedures
Figure 3.4: Representation of the KinectTM
plane withθdegrees in the angle of its motor.
The movements studied in the upper body (Figure 3.6) belong to common physical therapies and they were abduction, flexion, extension and internal and external rotation with the arm at 90 degrees of elevation. In abduction movement, the subject needs to stand face to face with the KinectTM
and, in the other movements, the subject needs to be aside to the KinectTMwith the arm that will make the movement closer to the KinectTM.
In the tests performed, the angles of the movement executed were measured with the MotionPlux. This system recorded the raw data and applied it a 1 Hz (empirically tested) low pass Butterworth filter to reduce the influence of the dynamic acceleration. After this procedure the initial vector of the acceleration is saved and used as reference to measure the angles between this vector and the next vectors acquired. Thus the result of this operation is a variation of the movement executed. For this reason, and because the high rates influence the measures from the triaxial accelerometer [37], it was required
3. ACQUISITION 3.3. Data Correspondence
(a) Abduction (b) Flexion/Extension (c) Internal/External Rotation
Figure 3.6: Representation of the upper movements studied.
that the subjects stayed 3 seconds in the initial and final positions. In all movements the subjects did three repetitions: the first with the arm at less than 90 degrees, the second with the arm at approximately 90 degrees and the last with the maximum that they could achieve.
For the validation, this work required the participation of ten healthy subjects, six females and four males. The mean age was 31 years (ranging from 21 to 55 years) and mean height was 170 cm (ranging from 159 to 180 cm). During the acquisitions, the males wore shirts and the females fitting clothes. The lower body clothes were not relevant, but clothes with shiny surfaces, like belts, were avoided.
3.3
Data Correspondence
As mentioned before, the sampling frequency of the MotionPlux is 800 Hz and KinectTM
’s is approximately 30 Hz. So, after computing the angles with each system, Figure 3.7(a)
and3.7(b), a linear interpolation was done with the computed data from the Microsoft KinectTMSDKto obtain the same (interpolated) sampling frequency of the MotionPlux,
Figure3.7(c). Then, a correlation with both data was done to synchronize them, ensur-ing that the data would share a synchronous time reference, Figure 3.7(d). Finally, as the depth frames were recorded at the same time that the joints’ spatial coordinates pro-vided by the Microsoft KinectTMSDK, there was no problem to ensure that the moment
3. ACQUISITION 3.3. Data Correspondence
(a) Computed Angles with a triaxial accelerometer (b) Computed Angles with the joints’ spatial coordi-nates provided by Microsoft
(c) Result of the interpolation done with the values of the subfigure (b) overlaid on subfigure (a)
(d) Result of the correlation done with representa-tion of the instants analysed highlighted in grey
4
The Kinect Skeleton Tracking
In this chapter, the procedures to analyse and validate the KinectTM
Skeleton Tracking are presented, as well as the main limitations for its use in rehabilitation purposes.
4.1
Application
In order to study the KinectTM Skeleton Tracking for rehabilitation purposes a short
application to receive the information from the KinectTM
sensor had to be done. The application was developed in C# using the Visual Studio 2010 and the access of the data streams was made with the official drivers developed by Microsoft, the Microsoft KinectTM SDK. With this drivers it is possible to use the Microsoft methods to access
the anatomical landmarks, however the software is proprietary and closed source. Thus, in the application the joints positions were found and shown in the stream of theRGB
image with circles on the subject’s joints. Figure4.1shows oneRGBframe collected from the KinectTMwith all tracked joints available for the upper body.
4. THEKINECTSKELETONTRACKING 4.2. Data Analysis
Figure 4.1: Application developed with aRGBframe with all tracked joints available represented with circles.
4.2
Data Analysis
With the joints’ spatial coordinates it is possible to computeROMmeasurements. In this thesis only glenohumeral movements were analysed, so the joints of interest were the shoulder, elbow and wrist. For abduction, flexion and extension movements the shoulder and elbow positions were used and for internal and external rotation with the arm at 90 degrees of elevation instead of using the shoulder position, was used the wrist position. To compute ROM measurements it was necessary to define two vectors and measure the angle between them. If the movement was abduction or flexion/extension, the first vector was composed by the shoulder and elbow spatial coordinates. Otherwise, the vector was composed by the elbow and wrist spatial coordinates. The second vector was the reference and its calculation is explained in section3.1.2. The equation4.1was used to computed the angles performed by the subject.
θ=arccos
A×B kAkkBk
4. THEKINECTSKELETONTRACKING 4.3. Validation
whereθrepresents the angle made in degrees,Athe first vector mentioned before andB
the reference vector.
4.3
Validation
To evaluate the performance of the KinectTMSkeleton Tracking a data comparison with a
triaxial accelerometer, the MotionPlux, was done. As previously mentioned the measures were done using variations instead of the maximum angle recorded.
To measure the accuracy the ME, the Standard Deviation (SD) and the Root-Mean-Square (RMS) error were computed. The results obtained between the KinectTMSkeleton
Tracking and the MotionPlux, for all movements, are summarized in Table4.1.
Movement ME/ ◦ SD/ ◦ RMS/ ◦
Abduction 02.91 2.51 3.34 Flexion 13.13 17.11 17.60 Rotation 18.02 19.34 19.52
Table 4.1: Comparison between the KinectTMSkeleton Tracking and the MotionPlux.
Only in abduction the KinectTM Skeleton Tracking provided results that are
con-sidered good enough for rehabilitation purposes with aME of 2.91◦. The results from
flexion/extension and internal/external rotation presented aMEhigher than 10 degrees ranging from 1 to 30 degrees. This situation occurs because in these two movements the subject is aside to the KinectTMand some body parts are occluded, making the tracking
more difficult. With the subject face to face with the KinectTM, the difficulties are the
same because in certain movement phases the arm is perpendicular to the KinectTMand
the shoulder, elbow and wrist positions are occluded.
In abduction and flexion, the large angles, between 170 and 180 degrees, were always unstable because the shoulders positions were not effectively detected. In the left side of Figure4.2(b)the angles executed during the movement are represented with the trou-bling instants highlighted in grey, and in the right side a depth frame recorded in one of these instants after the background subtraction.
Another limitation found was the environment. It was observed that the skeleton tracking struggles with objects in the scene which may be a problem in clinical uses.
Due to limitations mentioned we believe that the KinectTM Skeleton Tracking has
4. THEKINECTSKELETONTRACKING 4.3. Validation
(a) (b)
Figure 4.2: (a) Representation of the angles executed during an abduction movement with the troubling instants highlighted in grey; (b) Depth frame acquired in one of these
troubling instants.
like abduction/adduction. As the Microsoft KinectTM SDK is proprietary and closed
5
Proposed Algorithm
In this chapter a new algorithm based on the depth map information from the KinectTM
sensor is proposed to overcome the limitations of the KinectTM
Skeleton Tracking. The frames were recorded using the application developed in the previous chapter and the algorithm was developed using the Python 2.7.3. The development of the proposed al-gorithm can be divided in four main blocks. The first block is composed by the image processing techniques needed to obtain a binary image required for the rest of process-ing. The second block is used for identifying the subject’s movement and it is named automatic calibration. In the third block the detailed explication for identifying anatomi-cal landmarks is presented and in the fourth block the way that theROMmeasurements are done is shown. This sequence is systematized on AppendixAhighlighting the main events in each block. TheROMmeasurements validation using the MotionPlux as refer-ence and the algorithm performance are also presented in this chapter.
5.1
Image Processing
To be able to use the image frames from the KinectTM forROM measurements, image
processing techniques must be implemented. The library utilized for this purpose was the OpenCV 2.4.51. The first objective is to isolate the subject from the background, which
5. PROPOSEDALGORITHM 5.2. Automatic Calibration
can be done in two different ways, thresholding or background subtraction. The thresh-olding is simple to apply, however it can be used only in a regular environment, like a flat wall, and in this case it is possible to define a threshold value based on the image histogram. The background subtraction is a more robust technique and it can be applied in any environment. In this approach the differences between the current frame and the reference frame are computed to isolate the subject. However, as the subject’s movements are very small, only the arm presents a considerable movement, an image in the same en-vironment without the subject is used as reference frame. After subtracting directly these frames, it is necessary to define a threshold near to the extreme values, 0 and 255 (image with 8 bits per pixel). As it can be seen in Figure5.1(c)the result of the subtraction is not necessarily 0 in the static scene due to the noise level of the KinectTM sensor. Thus, all
pixels in the image near to the values 0 and 255 are classified as black (0), and the others are classified as white (1).
In the next step an opening is applied (combination of an erosion followed by a dila-tion) for removing fine lines and isolated pixel noise from the binary image. At this stage it is important to extract only a component of the image that is useful: the subject. To do this, a morphological algorithm for boundaries extraction is applied. The method used wasf indContours2which retrieves all contours of the binary image. With this
informa-tion the contour with the largest area is chosen and the binary image is composed by 1’s inside of the contour and 0’s outside of it. In Figure5.1the sequence of events mentioned before is represented.
5.2
Automatic Calibration
The calibration process is useful for recording some important measures of the subject. These measurements, represented in Figure5.2, are needed to find the shoulder, elbow and hand joint positions, as well as the head and the thorax inclination during any move-ment position.
In order to do these measurements, it is necessary to first find the head and the shoul-ders positions before the subject begins the movement. The head y-coordinate is the
first non-zero point in the horizontal projection and itsx-coordinate is the average of the
x positions in the horizontal line of the y-coordinate, where the pixel value is 1. The
2http://docs.opencv.org/2.4.5/modules/imgproc/doc/structural_analysis_and_
![Figure 2.2: Ground reaction force and moment outputs for the AMTI force platform [2].](https://thumb-eu.123doks.com/thumbv2/123dok_br/16546483.736948/29.892.353.596.905.1085/figure-ground-reaction-force-moment-outputs-amti-platform.webp)
![Table 2.3: Comparison of toolkits for interfacing with the Kinect TM [6].](https://thumb-eu.123doks.com/thumbv2/123dok_br/16546483.736948/39.892.177.752.653.925/table-comparison-toolkits-interfacing-kinect-tm.webp)

![Figure 2.8: Combining erosion and dilation to produce an opening or a closing. The result is different depending on the order of application of the two operations [4].](https://thumb-eu.123doks.com/thumbv2/123dok_br/16546483.736948/42.892.221.623.266.567/figure-combining-erosion-dilation-different-depending-application-operations.webp)

