Mariana Parrilha Alexandre Meira
Licenciatura em Ciências Biomédicas
Microfluidics: A New Look at Cell
Migration Analysis
Dissertação para obtenção do Grau de Mestre em
Engenharia Biomédica
Orientador: Dr. Abel Oliva, Investigador Principal, ITQB
Co-orientador: Dr. Hugo Águas, Professor, FCT-UNL
Presidente: Professora Dra. Célia Henriques, FCT-UNL
Arguente: Professor Dr. Ricardo Franco, FCT-UNL
Vogal: Dr. Abel Oliva, ITQB
III Microfuidics: A New Look At Cell Migration Analysis
Copyright © Mariana Parrilha Alexandre Meira, Faculdade de Ciências e Tecnologia, Universidade Nova de Lisboa.
V If we knew what it was we were doing, it would not be called research, would it?
VII
Acknowledgments
The development of this project, along with my whole journey until here, would not have been possible – or certainly not so bright – without the support, attention and friendship of some people, to whom I own a sincere Obrigada.
At first, to Professor Abel Oliva, my counsellor, for giving me the opportunity to play a part in this project and for all the support provided during this phase. For the tutoring and availability, for the roasting and the laugh.
To Professor Hugo Águas, my co-counsellor, for the opportunity and the reliance. For always being conducive and for showing responsiveness when everything seemed worse.
To the Biomolecular Diagnosis Group, who kindly received me, for lightening up this experience and for always being available. To Carmo, for always being so positive, and for all the guidance and encouragement given along my journey into the lab. To Catarina, Mariana, Rita e António, for the countless reasons – for always making me laugh, for the help and advice, for the support and the sharing. To all, for cheering together after the successful assignment and always remembering me of those after the failed ones. To the colleagues across the hallway, for the sympathy and the great doses of humour.
To both the institutions that have made this road possible and always provided the resources
needed to its’ success –Universidade Nova de Lisboa & Instituto Tecnologia Química e Biológica
António Xavier. To CEDOC (Chronic Diseases Research Centre) and CEMOP (Centre of
Excellence in Microelectronics Optoelectronics and Processes) for the assets provided and the thankful cooperation shown.
To my friends, both the elderly and the latest. To the first, I need to confess it would never had been possible to get here without you; to Ana, Marina, Sara, Cris, Sérgio and Miguel my dearest regard for always being there even when separated by dozens of kilometres. To the second, for all the growing up together while enjoying it but, mostly, for being a second family in the late years. To who has always been close, for days and nights, goods and bads, a special thank you.
IX
Abstract
This thesis explores the development and employment of microfluidic devices as a tool for studying the effect of the surrounding environment on embryonic stem cells during the migration phenomena. Different single-cell microchips were designed and manufactured to study mouse embryonic fibroblasts (MEFs) migration towards an environmental variation (increase of serum concentration in the culture medium) that was expected to function as a motility stimuli. Considering the experimental, cells were injected into the microchips chambers and individually isolated by dedicated cell traps with view to a single-cell analysis. Once fribroblasts were attached to the surface, culture medium with an increased serum level was subsequently injected in an adjacent chamber to promote the formation of a serum concentration gradient. The gradient established between the chambers could be sensed by the fibroblasts and thus triggered the cells mobilization towards and in the direction of the richer serum medium. Additionally, the experiment allowed the observation of MEFs’ structural reorganization when migrating through micro-tunnels containing widths below the cell size, suggesting a cytoskeleton rearrangement on account of the nutritional stimulus introduced. Furthermore, results indicate that fibronectin promotes MEFs adhesion to the substrate and that MEFs migration is characterized as haptotactic.
XI
Resumo
O objectivo deste trabalho consiste no desenvolvimento de dispositivos de microfluídica para o estudo do efeito do ambiente extracelular em células embrionárias durante o processo de migração. Neste contexto, foram projectados e fabricados diversos microdispositivos de fluídica com o objectivo de estudar a migração de fibroblastos embrionários murinos (FEMs) perante uma variação extracelular que se previa actuar como um estímulo de motilidade. Em termos experimentais, o processo inicia-se com o aprisionamento das células em estruturas especificamente desenhadas para o estudo single-cell numa câmara integrada no dispositivo. Quando as células aprisionadas revelam aderência relativamente ao substrato, é inserido na câmara adjacente meio de cultura com um nível superior de soro, de forma a promover a formação de um gradiente de concentração. Foi verificado que o gradiente formado entre as câmaras é sentido pelos fibroblastos e activa a mobilidade celular na direcção de concentração crescente do soro. Adicionalmente, o desenvolvimento do projecto permitiu observar a reorganização estrutural dos FEMs ao atravessar microtúneis de dimensão inferior à sua, sugerindo a ocorrência de fenómenos de reestruturação do citoesqueleto perante o estímulo nutricional induzido. Os resultados obtidos permitiram, ainda, verificar a importância da fibronectina como promotor de adesão celular ao substrato e classificar a migração dos FEM como haptotáctica – devido a variações de composição do meio extracelular envolvente.
XIII
C
ONTENTS
Acknowledgments ... VII Abstract ... IX Resumo ... XI
List of Figures ... XV
List of Tables ... XIX
Abbreviations ... XXI
CHAPTER 1 INTRODUCTION ... 1
1.1. PROJECT GOALS ... 3
1.1.1. Motivation ... 3
1.2. CELL LINE AND RELEVANT PROCESSES ... 4
1.2.1. Fibroblasts ... 4
1.2.1.1. Characterization ... 4
1.2.1.2. MEFs - Secondary Action ... 5
1.1.1. A Glance at Cell Migration ... 5
1.1.1.1. Polarity ... 5
1.1.1.2. Protrusion ... 6
1.1.1.3. Adhesion... 7
1.1.1.4. Retraction ... 8
1.3. MICROFLUIDICS TECHNOLOGY ... 9
1.3.1. Single-Cell Analysis in Microdevices ... 10
1.3.2. Fluid Behaviour and Properties in Microfluidics ... 11
1.3.3. Microfabrication ... 12
CHAPTER 2 MATERIALS AND METHODS ... 15
2.1. BIOLOGICAL SAMPLES ... 17
2.1.1. Cell Line and Culture Media ... 17
2.1.2. Adaptation of the Cell Line for the Experiment ... 19
2.2. NON-BIOLOGICAL SAMPLES ... 20
2.2.1. Chip Design and Performance Simulations ... 20
2.2.2. Microfluidic Platform ... 21
2.2.2.1. Wafer Preparation ... 21
2.2.2.2. SU-8 Processing ... 21
2.2.2.3. Casting of PDMS mould ... 25
2.2.2.4. Casting of Epoxy mould ... 25
2.2.2.5. Casting of PDMS chips ... 26
2.2.2.6. Sealing of PDMS chips ... 26
2.3. SLIDE MIGRATION ASSAYS ... 27
2.4. ON-CHIP:MIGRATION ASSAYS ... 28
CHAPTER 3 RESULTS AND DISCUSSION ... 31
3.1. CELL LINE CULTURE ... 33
3.2. PRELIMINARY RESULTS... 36
3.3. CHIP DESIGN AND MODELLING ... 38
3.3.1. Device Design ... 38
3.3.2. Device Modelling ... 40
3.4. CHIP CHARACTERIZATION ... 46
3.5. SLIDE PRIMARY ASSAYS ... 48
3.6. ON-CHIP:EXPERIMENTAL ASSAYS ... 50
3.6.1. Fibronectin Role –cell’s adherence ... 50
3.6.2. Stimuli Induced Migration ... 50
XIV
CHAPTER 4 CONCLUSIONS & FUTURE PERSPECTIVES ... 53
SUPPLEMENTARY INFORMATION ... 57
XV
List of Figures
FIGURE 1.1|MIGRATION IN HEALTH RELATED PROCESSES ... 3
FIGURE 1.2|FIBROBLAST MORPHOLOGY AND PRINCIPAL ORGANELS ... 4
FIGURE 1.3|STEP ONE IN MIGRATION:POLARITY ... 6
FIGURE 1.4|STEP 2 IN MIGRATION:PROTRUSION. ... 7
FIGURE 1.5|STEP THREE IN MIGRATION:ADHESION ... 8
FIGURE 1.6|BASIC MICROFLUIDIC SYSTEM SETUP. ... 9
FIGURE 1.7|LAB-ON-CHIP CONCEPT. ... 10
FIGURE 1.8|MAIN TECHNIQUES USED IN MICROFLUIDIC SINGLE-CELL ANALYSIS. ... 11
FIGURE 1.9|SKETCH OF REYNOLDS EXPERIMENT TO DETERMINE THE VARIOUS FLOW REGIMES. ... 12
FIGURE 1.10|LITHOGRAPHY: SKETCH OF A STANDARD MICROFABRICATION PROCESS. ... 13
FIGURE 2.1|SCHEMATIC REPRESENTATION OF THE STEPS COMPRISED IN THE CELL LINE DEVELOPMENT ... 17
FIGURE 2.2|HAEMOCYTOMETER USED TO DETERMINE CELL CONCENTRATION AND CORRESPONDENT READING METHOD. ... 19
FIGURE 2.3|PLOT OF THE SPECIFIC MASK (A) USED TO OPTICALLY OBTAIN THE CHIP'S PATTERNING THRUGH THE EXPOSURE TO ULTRA-VIOLET RADIATION (B). ... 21
FIGURE 2.4|REPRESENTATION OF THE SEQUENTIAL PROCEDURES OF THE SU-8 MASTER FABRICATION. ... 22
FIGURE 2.5|DATASHEET REPRESENTATION OF THE SPIN COATING SPEEDS ACCORDING TO THE FIL THICKNESS. ... 22
FIGURE 2.6|PHOTOGRAPHS OF THE STEPS USED TO CAST THE PDMS AND OBTAIN A REPLICA OF THE SU-8 MASTER MOULD DURING THE CHIPS FABRICATION. ... 25
FIGURE 2.7|SAMPLES OBTAINED IN EACH STEP OF MICROFABRICATION - A SUMMARY OF THE PROCESS. ... 26
FIGURE 2.8|OXYGEN PLASMA CHAMBER USED TO SEAL THE PDMS STRUCTURES TO A GLASS SLIDE. ... 26
FIGURE 2.9|SEQUENTIAL STEPS COMPRISED IN THE DEVELOPMENT OF SLIDE MIGRATION ASSAYS. .... 27
FIGURE 2.10|EXPERIMENTAL SETUP OF THE ASSEMBLY USED TO PROCEED THE SLIDE PRIMARY MIGRATION ASSAYS. ... 27
XVI FIGURE 2.12|OVERALL DISPLAY OF A GENERIC MICROCHIP ALONG THE MIGRATION EXPERIMENTS. ... 29
FIGURE 3.1|CELL CONFLUENCY FROM PLATING DAY (DAY 0) UNTIL TRYPSINIZATION. ... 33
FIGURE 3.2|A:MOUSE EMBRYONIC FIBROBLASTS IN SUSPENSION EXHIBITING A CHARACTERISTIC ROUND SHAPE AFTER TRYPSINIZATION.B:IMAGEJ DISPLAY WIT THE SELECTION OF THE CELLS CHOSEN TO AVERAGE DIAMETER DETERMINATION(20X OBJECTIVE). ... 33
FIGURE 3.3|DISTRIBUTION OF THE MEFS DIAMETERS WITHIN A SAMPLE OF 150 CELLS (Μ=43.96ΜM, Σ=14.18ΜM2
). ... 34
FIGURE 3.4|RESUME OF HEMOCYTOMETER COUNTING OF A MEF CULTURE AFTER WELL
TRYPSINIZATION. ... 35
FIGURE 3.5|FUNGI CONTAMINATION EMERGENT ON THE MOUSE EMBRYONIC FIBROBLAST CULTURE IN MEA PETRI DISHES FOR GENUS AND SPECIES IDENTIFICATION. ... 35
FIGURE 3.6|DESIGN OF THE TRAPS SUBMITTED TO A PERFORMANCE EVALUATION WITH THE USE OF MICROBEADS. ... 36
FIGURE 3.7 | MICROCHIP USED TO STUDY TRAP'S EFFICIENCY AND DETAIL OF THE LIVE IMAGE OF THE CHIP
DURING THE ASSAYS. ... 36FIGURE 3.8|EMMERGENCE OF BUBBLES DURING MICROFLUIDIC PRELIMINARY ASSAYS DUE TO THE RIGHT-ANGLES IN THE TRAPS BORDERS. ... 37
FIGURE 3.9| DIMENSIONS OF THE SPECIFIC TRAPING STRUCTURES USED IN THE MICROFLUIDIC
ASSAYS. ... 38
FIGURE 3.10|DISPLAY AND DIMMENSIONING OF THE TRAPS COMPRISED IN THE DEVICE WALLS. ... 38
FIGURE 3.11|FINAL SCHEMATIC OF THE CHIPS' DESIGN CONCEIVED FOR THE MIGRATION ASSAYS (AUTOCAD2015). ... 39
FIGURE 3.12|DEFINITION OF THE POLARIZATION OF THE FLUIDIC DEVICES, PRECEEDING THE MASK FABRICATION TO APPLY IN THE MICROFABRICATION PROCESS. ... 39
FIGURE 3.13|DISPLAY OF COMSOL-MULTYPHISICS 5.0INTERFACE DURING A GENERIC STUDY OF THE CHEMICAL CONCENTRATION PROFILE IN A FLUIDIC CHAMBER. ... 40
FIGURE 3.14|PARTICLE TRAJECTORY PROFILES PERFORMED TO OPTIMIZE TRAPPING EFFICIENCY ON CHIP NUMBER 1. ... 41
FIGURE 3.15|STREAMLINES OF VELOCITY PROFILES APPLIED TO THE DEVICE UNDER DIFFERENT PRESSURE CONDITIONS. ... 41
FIGURE 3.16|STREAMLINES OF VELOCITY PROFILES DEVELOPED TO DEFINE THE OPTIMAL PRESSURE VALUES FOR THE DEVICE 2 FUNCTIONING. ... 42
FIGURE 3.17|DEVICE IN ANALYSIS, EXHIBITING A DETAIL OF THE TRAPPING STRUCTURES IN THE WALL DIVIDING THE CHAMBER. ... 42
FIGURE 3.18|PARTICLE TRAJECTORY AND VELOCITY STREAMLINES PROFILES ACQUIRED THROUGH PRESSION VARIATIONS IN ORDER TO IMPROVE THE EFFICIENCY OF THE DEVICE. ... 43
XVII FIGURE 3.20|CLOSE-UP VIEW OF THE TRAPPING OBTAINED THROUGH A PARTICLE TRAJECTORY
STUDY. ... 44
FIGURE 3.21|PARTICLE TRAJECTORY PROFILES ACQUIRED THROUGH VARIATION OF THE RELATIVE PRESSURES AT THE RESERVOIRS. ... 44
FIGURE 3.22|RESUME OF THE MODIFICATIONS APPLIED IN THE DEVICE NUMBER 6 GEOMETRY IN ORDER TO PROMOTE SINGLE-CELL TRAPPING ALONG THE CHANNEL. ... 45
FIGURE 3.23|PREVIEW OF THE CONCENTRATION GRADIENT FORMATION WITHIN THE DEVICE. ... 45
FIGURE 3.24|INITIAL DEFORMITIES FOUND DURING CHARACTERIZATION OF DEVICE 6 AND FINAL ACCURATE RESULT AFTER PROTOCOL MODIFICATIONS. ... 46
FIGURE 3.25|PERSISTANCE OF DEFORMITIES ALONG THE CHANNELS OF DEVICE 7 AFTER PROTOCOL READJUSTMENT. ... 46
FIGURE 3.26|DISPLAY OF THE CRITICAL FEATURES OF DEVICES 1 TO 5, CONFIRMING THE INTEGRITY OF THE STRUCTURES AND APPLICABILITY TO THE BIO-ASSAYS. ... 47
FIGURE 3.27|FUNDAMENTAL ROLE OF FIBRONECTINE WITHIN THE CELL PRIMARY ADHESION TO THE GLASS SUBSTRATE. ... 48
FIGURE 3.28|DISPLAY OF THE MIGRATION SEQUENCE ACQUIRED DURING EXPERIMENTAL SLIDE ASSAYS IN 10 MINUTES INTERVALS. ... 49
FIGURE 3.29|OBSERVATION OF CHARACTERISTIC MORPHOLOGICAL CELL TRANSFORMATION DURING THE MIGRATION PROCESS. ... 49
FIGURE 3.30|CONTROL-TEST PERFORMED TO VALIDATE THE ACTION OF THE PRE-DEFINED
SURROUNDING STIMULI AS A CELL MIGRATION TRIGGER. ... 49
FIGURE 3.31|VERIFICATION AND PROGRESSION OF CELL ADHESION IN A FN COATED MICROCHIP. ... 50
FIGURE 3.32|MIGRATION SEQUENCE THROUGH A CHANNEL (18ΜM HEIGHT,225ΜM LENGTH) DURING A PERIOD OF 180 MINUTES. ... 51
FIGURE 3.33|MIGRATION CONTROL-TEST: NO MOTILITY WAS OBSERVED WITHOUT THE INTRODUCTION OF THE ENVIRONMENTAL STIMULI IN STUDY (20X OBJECTIVE). ... 51
FIGURE S1|CALIBRATION RAMP OBTAINED FOR THE TEMPERATURE STABILIZATION AT 37ºC FROM AN
XIX
List of Tables
TABLE 1.1|RELEVANT PHOTORESISTS' CHARACTERISTICS ACCORDING TO THE RESPECTIVE TONE. ... 13
TABLE 2.1|DATASHEET FOR THE SOFT BAKE DURATION ACORDING TO THE DESIRED FILM THICKNESS. ... 23
TABLE 2.2|DATASHEET FOR THE EXPOSURE ENERGY ACORDING TO THE DESIRED FILM THICKNESS... 23
TABLE 2.3|DATASHEET FOR THE POST BAKE DURATION ACORDING TO THE DESIRED FILM THICKNESS. ... 24
TABLE 2.4|DATASHEET FOR THE DEVELOPMENT TIME ACORDING TO THE DESIRED FILM THICKNESS. . 24
TABLE 3.1| PARAMETERS USED TO DETERMINE THE DISTRIBUTION OF CELL DIAMETER AFTER TRYPSINIZAYION IN A SAMPLE CONTAINING 150MEFS (Μ=43.96ΜM,Σ=14.18ΜM2
). ... 34
TABLE 3.2|TRAPPING EFFICIENCY OF THE PRE-DESIGNED STRUCTURES OBTAINED THROUGH
EXPERIMENTS WITH MICROBEADS ... 37
TABLE 3.3| MEASUREMENT RESULTS OF FEATURES ACQUIRED THROUGH STYLUS PROFILOMETRY TECHIQUE AND RESPECTIVE AVERAGE AND STANDARD DEVIATION. ... 47
XXI
Abbreviations
CDC42 CELL DIVISION CONTROL PROTEIN 42
DMEM DULBECCO'S MODIFIED EAGLE'S MEDIUM
DMSO DIMETHYL SULFOXIDE
DPBS DULBECCO’S PHOSPHATE-BUFFERED SALINE
ECM EXTRACELLULAR MATRIX
FBS FETAL BOVINE SERUM
FN FIBRONECTIN
IPSCS INDUCED PLURIPOTENT STEM CELLS
LOC LAB-ON-CHIP
MEA MALT EXTRACT AGAR
MEFS MOUSE EMBRYONIC FIBROBLASTS
MRCK MYOTONIC DYSTROPHY KINASE-RELATED
PDMS POLYDIMETHYLOSILOXANE
PGMEA PROPYLENE GLYCOL MMETHYL ETHER ACETATE
PS PEN/STREP
Re REYNOLDS NUMBER
SCS STEM CELLS
1
Chapter 1
3
1.1.
Project Goals
The aim of this project is to develop a platform suitable for tracking and analysing mouse embryonic fibroblasts migration at a single-cell level, i.e., from an individualized perspective. The first challenges that emerged in this context were “How can we reliably reproduce the cell’s environment?”, “Can we track them individually for a long period of time?”, “Is it possible to create
an easily reproductive platform that allows this assessment?”. These questions found answers
within the microfluidics’ field, so this concept was applied for the development of
microminiaturized platforms suitable for the biological essay in mind. The posterior experimental process was established on behalf of fibronectin coated substrates, in order to comparatively visualize and determine the cells response to a specific stimuli - an increase of serum concentration in the culture medium – that is expected to trigger migration.
1.1.1.
Motivation
Migration is a central process in several physiological and pathological processes for both simple uni-cellular and complex multi-cellular organisms. Indeed, the orchestrated movement of cells in particular directions to specific locations is a fundamental request for tissue formation during embryonic development and errors in this process can lead to diverse health-related dysfunctions, namely osteoporosis and cancer1 (Fig.1.1). The past two decades have witnessed great advances in the understanding of the routines underlying cell migration, nonetheless the overall process exhibits so many regulatory steps that it is foreseen that a deeper knowledge can lead to the development of novel therapeutic approaches and applications2.
Figure 1.1 | Migration in Health Related Processes
Migration stands as central in several physiological and pathological processes. Considering that a cell migration deregulation may lead to serious consequences – osteoporosis, cancer proliferation, among others – a deeper knowledge of factors that regulate migration could lead to the development of novel therapeutic approaches and applications.
4 Making an allowance for a personal perspective, the possibility to engage this project has been sincerely challenging and academically enriching. Microfluidics presents itself as an area of umpteen possibilities and the development of this assay has allowed me to interconnect engineering and biomedicine, broadening my horizons in the investigation field.
1.2.
Cell Line and Relevant Processes
As previously mentioned, the cells chosen to develop this assay were Mouse Embryonic Fibroblasts – MEFs. In this point, a brief characterization and application of these cells is made, as well as a review of the biological phenomena in study, i.e., cell migration.
1.2.1.
Fibroblasts
1.2.1.1.
Characterization
Fibroblasts are a major constituent of the connective tissue that establish an essential support of all animal tissues – the stroma. Stromal tissue is relatively undifferentiated and stems from the mesoderm layer that synthesizes the extracellular matrix (ECM), reticular fibers and respective proteins, such as collagen and fibronectin3. In addition, fibroblasts secrete the ground substance, an amorphous gel-like substance composed of water and specialized molecules that surrounds cells and determines how firm or soft the ECM is. The formation and differentiation of the specialized forms of connective tissue – bone, cartilage, blood and adipose – is, therefore, highly dependent on the composition of the ground substance4.
Therefore, the main function of fibroblasts is the maintenance of the structural integrity of the connective tissues through the segregation of essential precursors, determining the physical properties of the various connective tissues. Morphologically, fibroblasts are large, flat, elongated (spindle-shaped) cells that grow attached to a substrate. This eukaryotic cells (Fig.1.2) display a remarkable capacity to differentiate and, in an active state, present abundant rough endoplasmic reticulum5.
Fibroblasts are the eukaryotic cells responsible for the manufacturing and maintenance of connective tissues, the structural framework supporting the organs of all faunae.6
The primary action of fibroblasts is related to wound healing, the process of tissue self-repair after an injury. These specific cells are key players on this response mediation, playing a fundamental role on proliferation, extracellular matrix (ECM) contraction, migration, and ECM production, under the control of growth factors and respective cellular receptors7,8.
5
1.2.1.2.
MEFs - Secondary Action
This specific cell line is widely used in biotechnological research, essentially due to its’ capacity
of providing a substrate for stem cells (SCs) to grow in and segregating critical growth factors to maintain SCs pluripotency9. Moreover, considerable advances have been made in the embryonic stem cell field as a result of the usage of MEFs, allowing the direct reprogramming of somatic cells to a pluripotent state, i.e., the generation of induced Pluripotent Stem Cells (iPSCs)10.
In addition, MEFs have been employed in numerous studies related to fibroblast biology, cancer and aging and have also been used to understand several mesodermal cells properties, such as cell cycle regulation, transformation, immortalization, senescence and apoptosis.
Nevertheless, such advances are dependent upon the development of novel approaches in order to understand MEF cells behaviour and structural properties. One of the features that requires
particular attention in MEFs’ behaviour is their migration ability, essentially because this is a
central process within several physiological and pathological processes.
1.1.1.
A Glance at Cell Migration
Cell migration is a broad term used to describe the processes involving cells translocation from one location to another. This stands as an evolutionary mechanism that underlies several pathological routines, namely tissue development, functioning and regeneration. Nonetheless, error in this process can lead to severe functional deregulations, such as cancer and osteoporosis1, pointing out the need and importance of developing new approaches to study this phenomena. It is of general acceptance that the mechanisms implicated in cell migration are often regulated by the same effectors, regardless cell type and model of migration. These mechanisms are coordinated by a complex signalling network – signal and receptors – and include a set of complementing processes comprising polarization, protrusion and adhesion, translocation of the cell body and retraction of the rear 11. In order to better understand the sequence and portrayal of this complex process, these mechanisms are briefly described along the next sections.
1.1.1.1.
Polarity
Within the context of cell migration, polarity describes the functional and molecular differences established between the front and the rear of the cell. Cell polarity is a process reinforced by the environment, a provider of directional cues such as chemotactic (induced by chemoattractants), haptotactic (generated for fluctuations on substrates concentration), mechanotactic (cell-cell contact breakdown), electrotactic (due to electric fields) and durotactic (derived from differences in pliability). The recruitment of specific signalling proteins within the cell is directed by this cues, originating morphological asymmetries characterized by the formation of a defined cell front and rear 12
6 Figure 1.3 | Step One in Migration: Polarity
The major mechanisms involved in cell polarity are the activation of MRCK and PAR3/6, in oder to control the nucleus position towards the MTOC and the microtubule dynamics through the dynein/dynactin complex, respectively. Adapted from 14.
The induction of polarized signals in the course of this event generates the formation of a protrusion at the front of the cell and a rear, also known as leading and trailing-edges. In the specific case of fibroblasts, polarization is thought to be also originated by the myosin
II
-induced production of stable actin filament bundles and adhesions and consequent cytoskeleton reorganization15,16.1.1.1.2.
Protrusion
The formation of protrusions comprises a deformation of cellular membranes, a process sustained by the dynamic polymerization of actin cytoskeleton, which consents an expansion in the membrane surface. Actin filaments are essential elements of cell cytoskeletons formed by the polymerization of arrays of monomeric globular G-actin subunits and stand as a physical backbone of a protrusion, determining the cell shape and its internal organization. The self-association of actin filaments into bundles or a branched network is carried by specific actin-binding proteins with cross-linking activity (like α-actinins or myosins) and its’ morphology is
directly conditioned by them13.
7 Figure 1.4 | Step 2 in Migration: Protrusion.
The actin cytoskeleton reorganization in a fibroblast protrusion is determined by the formation of lamellipodia (filaments meshwork) and filopodia (association of parallel filaments), as a consequence of actin filaments polymerization. Adhesion sites (marked in purple) are essential in this process, regulating actin reorganization and the cell stability.17
1.1.1.3.
Adhesion
This mechanism refers to the physical binding of a cell with another cell or with the ECM, under the action of so called cell adhesion molecules - selectins, integrins, and cadherins18- after an environmental stimuli. Taking into account the purpose of this project, the focus on this section is the cell-ECM adhesion establishment. On the course of this process, interactions of transmembrane integrins binding to the ECM promote the transduction of the external stimuli that control cell migration into intracellular biochemical signals.
8 Figure 1.5 | Step Three in Migration: Adhesion
Nascent adhesions are initially formed within lamellipodia and generate signals that activate Rac-1, promoting the formation of focal complexes within the transition zone between lamella and lamellipodia. Focal adhesions are larger structures, comprising a link between the actin cytoskeleton and the ECM. 22
Nascent adhesions are the first adhesive structures formed, emerging within the lamellipodia. These small dot-like structures reside near the leading edge in protrusions and mediate signals that promote actin polymerization19. Since these are highly transient structures, nascent adhesions are not easily identified in some cell types. Focal complexes are also dot-like structures lying at the extreme of the protrusion, which formation is mediated by Rac-1 activation of kinases. On the other hand, focal adhesions are morphologically larger and elongated and are placed at the end of actin filament bundles, both in central and peripheral regions of the migrating cell22. These structures are linked to the actin cytoskeleton through the attachment of integrin receptors associated with large complexes of signalling and structural proteins23, that allow the cell to generate traction and pull its body forward.
1.1.1.4.
Retraction
9
1.3.
Microfluidics Technology
Insurgence of Microfluidics
Microfluidics is a multidisciplinary field that has emerged in the beginning of the 1980s as a powerful tool for investigating the inherent complexity of cellular processes. Commonly, microfluidic devices deal with phenomena at a microscopic scale, exhibiting channels with dimensions between ten and hundreds of microns and a volumetric capacity of 100nl to 10μl24. This network of micro-channels is projected together according to the desired function (sort, mix, pump) and is connected to the outside through inputs and outputs pierced through the chip. The injection and removal of liquids or gases is performed using external active systems, such as peristaltic or syringe-pump, pressure controllers or micromixers and a data acquisition system allows to follow the whole process (Fig.1.6).
Figure 1.6 | Basic Microfluidic System Setup.
A serynge pump system is used to load the samples through the inlets of the microfluidic device and the phenomena in study is analysed recorring to a real time image acquisition platform.
In order to a get a correct sample analysis in microfluidics, the fluid manipulation within the chip is also of great relevance. The ‘pressure driven flow’ is a suitable technique often used in this area based in the appliance of pressure in the inlets in order to promote the liquid propagation through the microchannels. Once the sample is placed on the inlet reservoirs, the pressure difference established with the outlets endorses the fluid circulation within the chip. The fluid velocity and flux on the device are ultimately determined by this pressure difference as well as by
the fluid’s resistance in the microchannels25. Considering that fluids behaviour in a microscale has a great influence on this area, this topic is posteriorly analysed in section 1.3.2.
Microfluidics presents a wide range of applications, revolutionizing areas as molecular biology (DNA Analysis and Proteomics), genetic sequencing, clinical pathology, single-cell analysis and the modelling of fluid dynamics. Indeed, the increasing number of microfluidics’ publications in
journals and conferences from the mid-1990s to today sustains the statement that this is a field with a growing influence in modern science 26. The advances sustained by this area offer a diverse set of advantages, namely the use of small amounts of reagents and samples, a better temperature control, portability and a high throughput. Further advantages include space for parallelization, faster analysis and waste reduction 27.
10 states the scaling down of multiple laboratory processes into a single chip-format (Fig.1.7), allowing the development of scientific studies within a controlled environment and without a formal lab28.
Figure 1.7 | Lab-On-Chip Concept.
LOC designation refers to integration and miniaturization of several laboratory processes on a chip format within a controlled bio-envronment (http://Lab-on-Chip.gene-quantification.info - retrieved in 2015.05).
The next years are likely to be critical in the development of highly integrated microdevices, since the acceptance of microfluidic based technologies in the market will dictate the amount of both private and public funding allocated to this area. Some LOC devices have already been successfully commercialized, in particular a system developed by Biosite, that analysis a drop of blood through a functionalized microchannel and determines if a patient has suffered a heart attack29.
1.3.1.
Single-Cell Analysis in Microdevices
Single-cell analyses (SCA) states for the approach of studying cells’ behaviour at an individual,
and therefore fundamental, level. Cellomics recognise that the way a cell processes input signals decides its particular faith and that individual cells may differ from each other in several aspects. It is likewise defined that a cell dynamics is frequently masked by the bulk response of the average within the same cell type30. Moreover, heterogeneous cell response to stimuli is known to occur under identical environment conditions31, stating the need of a sequential tracking system of single cell dynamics.
Flow cytometry is a technique that allows the quantification of single cell properties within a heterogeneous population, however it reflects the state of the cell at a certain moment in time, presenting merely a snapshot analysis30. Making an allowance for the requirement of a temporal
11 Single-cell analysis and microfluidics are nowadays puzzling keywords in the scientific community in order to achieve a better knowledge on the whole range of possible responses of individual cells and their heterogeneity. Considering microfluidic chips exhibit structures in the order of microns, this appears as a quite suitable technology for single-cell manipulation and tracking. With this aim, several strategies have been reported as an attempt to spatially separate and analyse single cells through microfluidics27. The use of traps32, patterns33, microwell arrays27,34 and droplets35 are frequently used techniques in this context (Fig.1.8). Due to the aim and development of the project in development, special attention is dedicated to the first along this thesis.
Figure 1.8 | Main techniques used in microfluidic single-cell analysis.
The principal techniques comprising single-cell analysis and microfluidics: a) Microfluidic Traps . b) Microfluidic Patterns . c) Microwell Arrays . d) Microfluidic Droplets. 36
1.3.2.
Fluid Behaviour and Properties in Microfluidics
The fluid behaviour at a microscale is one of the properties that must be taken into account within the microfluidic field. Indeed, fluidic phenomena do not scale linearly from macro to micro implementation, essentially due to the increased surface area-to-volume ratio. Janasek et al. described the main dissimilarities to considerate when working with microfluidic systems, namely the fluids’ turbulence –or its’ absence: the laminar flow37. Undeniably, as the characteristic length in fluidic devices decreases, the inertial forces - that are dominant at a macroscale level - drop significantly compared to the viscous forces. Bearing in mind that inertial forces are the source of turbulence in a fluidic system, the flow regime tends toward laminar at micro dimensions24. In this context, the Reynolds number (Re) is a dimensionless parameter of high relevance that expresses the ratio of inertial to viscous forces in studying fluids, according to the equation 1.1.
𝑅𝑒 =
𝑖𝑛𝑒𝑟𝑡𝑖𝑎𝑙 𝑓𝑜𝑟𝑐𝑒𝑣𝑖𝑠𝑐𝑜𝑢𝑠 𝑓𝑜𝑟𝑐𝑒=
𝜌𝑣𝜇𝑣 𝐿2⁄⁄𝐿2=
𝜌𝑣𝐿𝜇Equation (1.1)
where ρ stands for the fluid density; v is the velocity; L is a characteristic dimension (often the smallest length scale of the system, e.g. the smallest width of a channel) and µ is fluid viscosity.
12 Figure 1.9 | Sketch of Reynolds experiment to determine the various flow regimes.
(A) Laminar flow: smooth, ordered with constant fluid velocity; (B) Transitional flow: intermittent pulses of turbulence; (C) Turbulent flow: disorganised movement with eddy current formation38.
The transition between laminar and turbulent flow usually occurs for a Re of approximately 2000 (the so called critical Reynolds number), nonetheless this value fluctuates according to the
systems’ characteristics39. In microfluidic systems, the Re is usually below 1, essentially due to the low characteristic dimension values of the devices.
Contrarily to large scales, at a microfluidic level fluids do not mix connectively, i.e., when two fluidic streams come together in a microchannel they flow in parallel, without turbulence, and mixing only occurs as a result of molecules diffusion between the fluids24. Therefore, the mass transport takes place only in the direction of the fluid, which is an important characteristic when developing fluidic experiments. In one dimension, the diffusion process can be modelled according to the equation 1.2.
𝑑2= 2𝐷𝑡 Equation (2.2)
where 𝑑 is the mean distance that a particle travels, 𝐷 is the diffusion constant and 𝑡 is the time.
1.3.3.
Microfabrication
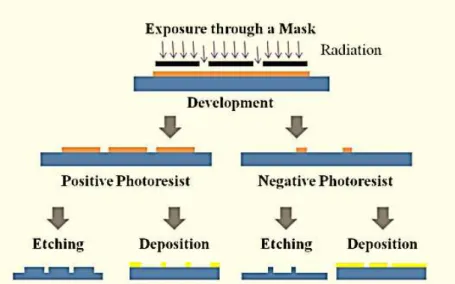
13 Figure 1.10 | Lithography: sketch of a standard microfabrication process.
This technique consists on the obtention of a direct replica of the original mask (positive resist) or its' inverse (negative resist), prior to exposure and development. In due course, deposition and etching can be performed through addition and subtraction to achieve the desired pattern.
Subsequently, a substrate is spin-coated with a layer of a photoresist – a high sensitive polymeric film. In the second step, the resist is exposed to radiation through a mask and it is observed that the exposed regions change their solubility towards an appropriate solvent called developer. After the development, the exposed pattern is released and the resulting structure can be the final one or be transferred to the substrate by addition or etching processes.
Photoresists are photosensitive polymeric materials commonly used to form a patterned coating on a surface. The development of such advanced materials have allowed the reduction of lithographic structures down to sub-100nm dimensions46. Photoresists can be either positive or
negative, a fundamental property defined as tone. When a negative photoresist is used, the coated region remains insoluble to the developer once it is exposed to radiation and the unexposed one becomes soluble. On the other hand, treatment with a positive photoresist conducts to the solubility of exposed areas and consequent insolubility of the unexposed. According to the microelectromechanical systems industry, photoresists’ relevant characteristics differ according to its’ tone (Table 1.1). Examples of photoresists regularly used in microfluidic device fabrication include negative toned SU-8 or P-50100 and, as a positive variant, the novolac resin SPR 220-745.
Table 1.1 | Relevant photoresists' characteristics according to the respective tone.
Photoresists’ characteristics relevant in the microfluidic device fabrication device, according to the
microelectromechanical systems industry45.
Characteristic Negative
Photoresist Positive Photoresist
14 Regarding the materials, silicon and glass were the prime options explored in this area, mainly due to their known reputation in the semi-conductor industry. In the late years, novel materials have been introduced to the field, essentially with the purpose of manufacturing simplification and respective cost reduction47. In this context, polymers suitable for soft lithography gained special attention, in particular elastomeric polymer poly-dimethylsiloxane (PDMS). In addition to the lower production costs, PDMS is a soft polymer with attractive chemical and physical properties, such as elasticity, optical transparency, low permeability to water and low electrical conductivity. Ultimately, the use of an elastomeric polymer moulding during soft lithography allows the rapid prototyping of microchips, discarding the need of re-using microchips and contributing to a decrease of contamination between assays48. Nevertheless, PDMS based micro-devices may
present a few disadvantages, namely the possibility of features’ shrinking or sagging during microfabrication and the incapability with some organic solvents47.
15
Chapter 2
17
2.1.
Biological Samples
As previously mentioned, Mouse Embryonic Fibroblast (MEF) was the cell line used in the course of this project. MEF cells – a kind gift from CEDOC (Chronic Diseases Research Centre) - were cultured and arranged to the assays according to that institution´s protocol, as described in this section. This process comprises the cell growth within the appropriate conditions and the post-treatment to suit the migration experiments. In this context, cells were mitotically inactivated (to prevent the nucleus division during the biological assays) and coated with fibronectin (FN, a protein that shall promote migration). The biological samples were then adopted to growth medium with a serum concentration of 1% (𝑣 𝑣⁄ ) and applied to a microfluidic system in order to reproduce a migration process. A schematic representation of the biological samples acquisition is displayed below, in Figure 2.1.
Figure 2.1 | Schematic representation of the steps comprised in the cell line development
After the murine extraction, the cells were plated and thawed in a sterile environment. Cell medium was exchanged every 2 days and the MEFs were passed at specific confluency and concentration levels. Afterwards, the cells were mitotically inactivated, coated with fibronectin (FN) and adapted to growth in a medium with lower serum concentration.
In order to preserve the integrity of the cells and according to cell culture fundamentals, all the routines described within the cell handling were proceeded in a laminar air flow (LAF) chamber, until the moment they were introduced in the chips. The development of the cell line was handled with resource to ITQB facilities and through the tuition of the Biomolecular Diagnosis Team.
2.1.1.
Cell Line and Culture Media
Thawing the Cells
18 Sigma Life Science) and supplemented with 10% (𝑣 𝑣⁄ ) FBS (Fetal Bovine Serum, Lonza) and 1% (𝑣 𝑣⁄ ) PS (Pen/Strep, Gibco). Cells were pelleted by centrifugation (1100rpm, 7min, 4ºC @ Biofuge 28RS) and, after supernatant removal, resuspended in the medium in a final volume of 6mL. After transferring the suspension culture into a 6cm dish shaker flasks, it was placed on an incubator at 37ºC in a humidified atmosphere containing 5% CO2.
Medium Exchange
Medium was replaced by removing the remaining in culture and adding 6mL of fresh growth medium at 37ºC. The cell culture was then transferred into the incubator again. Culture medium was replaced every 2 days until growth and confluence became evident.
Passaging the Cells
Cell passaging was conducted once cell confluency achieved a level of 60% to 70% and at a cell concentration of approximately 1 × 10⁶ 𝑐𝑒𝑙𝑙𝑠 𝑚𝐿 ⁄ . After culture medium removal, MEF cells
were washed twice with DPBS (Dulbecco’s Phosphate-Buffered Saline, Gibco) and trypsinized with 1mL of a 1x Trypsin-EDTA solution (Gibco). The culture was then transferred into the 37ºC, 5% CO2 for a period of approximately 7 minutes, to promote the actuation of trypsin. The trypsinization process was interrupted by the addition of 6mL of pre-warmed fresh medium [cell de-attachment is completed once turbidity is observed in the solution]. Cells were then transferred to a centrifugation tube, pelleted (1100rpm, 7min, 4ºC) and re-suspended in 6mL of fresh medium. The final solution was aliquot in three vials with 2mL, each containing an approximate concentration of 1 × 10⁶ 𝑐𝑒𝑙𝑙𝑠 𝑚𝐿⁄ . One of the aliquots was transferred to a new culture dish and kept for further passaging in the incubator with a supplement of 4mL of fresh growth medium. The remaining aliquots were centrifuged (1100rpm, 7min, 4ºC ) and, after supernatant removal, resuspended in 1mL of cryopreservant – 20% (𝑣 𝑣⁄ ) FBS, 70% (𝑣 𝑣⁄ ) DMEM, 10% (𝑣 𝑣⁄ ) DMSO (Sigma). Cells were then placed in cryopreservation tubes and kept in liquid nitrogen as a resource to a future prospect of recreating the same experiments with the descendants through posterior passaging.
The obtention of growth profiles allowing the determination of the cell concentration are broadly described below, as it is a relevant procedure included in the cell line establishment.
*Cell Concentration Determination
Growth profiles were acquired through monitoring cell concentration and correspondent viability every 48h. These parameters were obtained with the trypan blue exclusion method through a 0.1% (𝑣 𝑣)⁄ solution with DPBS, with a dilution factor of 5. Cell count was proceeded in a
haemocytometer (0.100 nm, 0.0400 mm2OptikLabor) on an inverted microscope (Nikon Eclipse TE
2000-5) with an aim of a 1 × 10⁶ 𝑐𝑒𝑙𝑙𝑠 𝑚𝐿 ⁄ concentration. This process was implemented
19 Figure 2.2 | Haemocytometer used to determine cell concentration and correspondent reading method.
In this project, the cells located on the haemocytometer lines marked in green were included in the counting whereas the ones marked on red were discarded.
2.1.2.
Adaptation of the Cell Line for the Experiment
Mitotic Inactivation
Cell medium was replaced by the addition of 6mL of fresh medium containing 1.5 𝜇𝑔
𝑚𝐿 containing mitomycin-C (Sigma, 0.5 𝑚𝑔
𝑚𝐿 stock). The culture was then incubated for approximately two hours at 37ºC in an atmosphere containing 5% CO2. Afterwards, the medium was removed and the plate containing the adherent culture was washed three times with fresh medium to remove all the existent mitomycin. To prepare the cells for the subsequent steps, additional 6mL of fresh growth medium was added to the plate. When handling mitomycin-C one must consider that this is a genotoxic substance and must be manipulated with reinforced gloves and disposed according to the house rules for these materials.
Adjustment to Lower Serum Concentration
20
2.2.
Non-Biological Samples
Along this section, the processes preceding and including the microdevices’ fabrication are
described according to the procedures adopted to develop this project. In a summary, this process was initiated with the design of the microfluidic patterns and correspondent modelling and optimization. Furtherly, the chips were fabricated in a temperature controlled clean room, according to the stated specifications, and integrated in the migration assay.
2.2.1.
Chip Design and Performance Simulations
AutoCAD design of microfluidic devices
The process of microfluidic devices’ fabrication requires a prior stage of design and simulation,
consistent with the specific aim of the experiment in development. In this context, AutoCAD Software (2015) was used to project the mask comprising the microdevices employed in the migration studies. This software is widely used for engineering layout of geometric features, allowing a high degree of detail, organization, complexity and replication49. This aspects make it a very useful tool for low-cost photolithographic processing, conventional in the microfluidic field.
The suitable designs were developed in order to allow single-cell trapping and quantification, forecasting the need of a chemical gradient formation within the chip. The micro-structures were designed taking into account the MEF cells’ dimensions, containing at least two inlets for the injection of the medium containing the different serum levels.
COMSOL Multiphysics Simulations
COMSOL Multiphysics is a software based on advanced numerical methods used for modelling and simulating diverse physical phenomena. This platform was exploited with the purpose of optimizing the microchips and respective structures in a process comprising several variations of
the experimental parameters (traps’ dimensions and distribution, fluid initial velocity, relative
pressures) and consequent re-design.
Considering the purpose of the microfluidic devices projected, the modelling was done through studies of fluid characterization, particle tracing and transport of diluted species. All of the simulations were performed at a two dimensional level and the structural material was defined as PDMS, with water as the fluid flowing through the microchannels. The modelling ultimately
allowed the determination of the final microfluidic’ structures, according to the specifications of the migration assay projected – formation of a chemical gradient, single-cell trapping and a suitable environment to promote migration.
21 Figure 2.3 | Plot of the specific mask (A) used to optically obtain the chip's patterning through the exposure to Ultra-Violet Radiation (B).
(A): Display of the mask with the microfluidic devices´ structures imprinted, in a total of six chips. (B): Application of the mask in the posterior microfabrication process, according to the chosen photoresist.
2.2.2.
Microfluidic Platform
The chips used in the assays were obtained through a lithography-based process, according to the priorly obtained chromium mask. PDMS was the material chosen to manufacture the devices, with SU-8 as the photoresist used to coat the substrate. Microfabrication comprises a sequence of slightly complex procedures, which parameters must be adapted according to the specifications of the biological assay in course. The devices were manufactured with resource to the CEMOP (Centre of Excellence in Microelectronics Optoelectronics and Processes) facilities and under the considerate guidance of the investigator Catarina Freitas.
2.2.2.1.
Wafer Preparation
The microfabrication process starts with a pre-treatment of the substrate, the silicon wafers that supplement the SU-8 deposition. At first, the wafer is cleaned with acetone and isopropanol and submitted to ultrasounds for a period of 10minutes. Posteriorly, it is baked at 180ºC for 10minutes
– to promote the removal of the adsorbed water molecules – and left to cool down for approximately 10minutes.
2.2.2.2.
SU-8 Processing
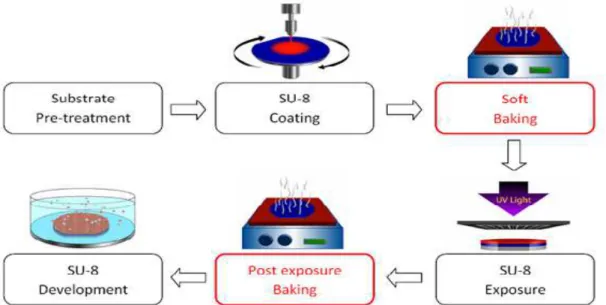
22 Figure 2.4 | Representation of the sequential procedures of the SU-8 master fabrication.
After the substrate pre-treatment, the samples were submitted to spin-coating and soft baked to promote the solvent evaporation. The samples were then UV irradiated to initiate the cross-linking, that is enhanced during the post bake. At last, a developer bath was prepared and the unexposed regions of SU-8 are removed within the solution. 51
Spin-coating is the first step of microfabrication and the spin speed was set at a known room temperature, according to the Datasheet on Fig.2.5. One must considerate that these values are stated for a room temperature of 21ºC and that a variation of 1ºC implicates a readjustment in the order of 25rpm in the spinning speed. This rearrangement was set due to the fact that SU-8 viscosity decreases with temperature, hence the speed should be reduced 25rpm for a temperature increase of 1ºC and contrariwise.
Therefore, after pouring 4mL of 2050 SU-8 in the wafer (10cm diameter), the sample was submitted to spin-coating at 21.0ºC during 7seconds with a speed of 1850rpm and 300 𝑟𝑝𝑚⁄𝑠 of acceleration. In order to optimize the procedure and obtain the specified height, the primary experiments included three trials with a deviation of 100 rpm, i.e., 1700rpm, 1800rpm, 1900rpm, leading to the mentioned value above.
Figure 2.5 | Datasheet Representation of the spin coating speeds according to the fil thickness.
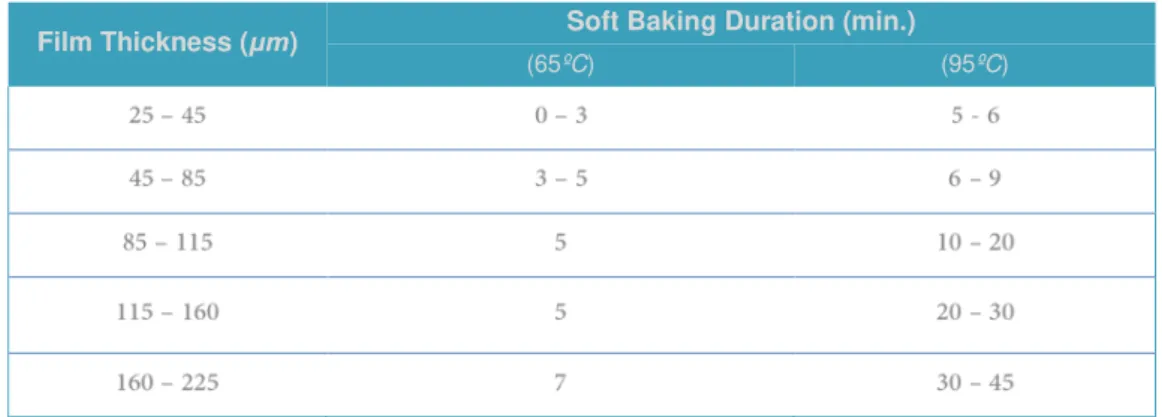
23 Posteriorly to the spin-coating process, the wafer was soft baked in the course of two stages in order to promote the evaporation of the solvent. The wafer was placed on a levelled hot plate at 65°C during 4 minutes and then transferred to another hot plate at 95°C for 8min. Once again, these parameters are dependent upon the desired thickness of the final chip and must, therefore, be readjusted towards a different constraint (Table 2.1). The baking time was optimized by keeping the wafer a few additional minutes at 95ºC if wrinkles would appear after cooling down.
Table 2.1 | Datasheet for the soft bake duration acording to the desired film thickness.
The soft baking time was defined considering the thickness of the final chip in a two phases sequential process – at first for 65ºC and formerly for 95ºC. Adapted from52.
After the wafer has cooled down and SU-8 deposition was completed, the sample was UV exposed in a mask aligner (MA6, Suss MicroTec, Germany). The exposition was proceeded by submitting the wafer to UV radiation of approximately 400nm, through the chromium mask with the chip structure imprinted. The exposure energy applied was chosen according to the SU-8 datasheet specifications (Table 2.2) and the time of exposition determined by means of the Equation 2.1, considering a power density of 18.4𝑚𝑊
𝑐𝑚2 . As a result, the UV exposure parameters
were set for an energy of 200 𝑚𝐽
𝑐𝑚2 in a period of 11 seconds, allowing the demarcation of the mask – and respective microfluidic structures - within the SU-8 in the wafer.
Table 2.2 | Datasheet for the exposure energy acording to the desired film thickness.
The exposure dose was chose as a function of the thickness of the micro-chip, allowing the determination of the UV exposition time. Adapted from 52.
𝐸𝑥𝑝𝑜𝑠𝑢𝑟𝑒 𝑇𝑖𝑚𝑒 (𝑠) = 𝐷𝑜𝑠𝑒 (
𝑚𝐽 𝑐𝑚2)
𝑃𝑜𝑤𝑒𝑟 𝐷𝑒𝑛𝑠𝑖𝑡𝑦 (𝑐𝑚2𝑚𝑊)=
200 (𝑐𝑚2𝑚𝐽)
18.4 (𝑚𝑊𝑐𝑚2)≈ 11𝑠 Equation (2.3.)
Film Thickness (μm) Soft Baking Duration (min.)
(65ºC) (95ºC)
Film Thickness (μm) Exposure Energy (𝒎𝑱
𝒄𝒎𝟐
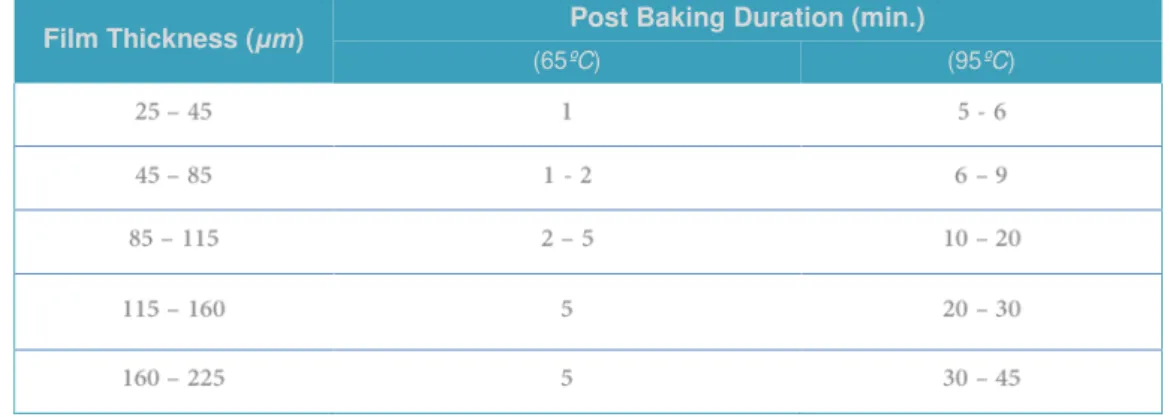
24 As soon as the the exposure was completed, the wafer was submited to a post bake bound for completing the cross-linking process. This procedure comprises two heating phases – 65ºC and 95ºC -, for a period of, respectively 2 minutes and 7.5 minutes (Table 2.3). It is important to notice when the micro-pattern becomes evident by naked eye, which should happen between 5 to 15 seconds after plating at 95ºC. Otherwise, one should readjust the exposition dose considering that a shorter time may be a consequence of a higher than recommended dose of UV, and contrariwise for a longer time.
Table 2.3 | Datasheet for the post bake duration acording to the desired film thickness.
The post baking time was defined considering the thickness of the final chip in a two phases sequential process – at first for 65ºC and formerly for 95ºC. Adapted from52.
To conclude the SU-8 Processing, a developer was used to chemically dissolve the unexposed regions covered by the photoresist. The wafer was developed in constant magnetic agitation at 500 rpm by means of propylene glycol methyl ether acetate (PGMEA) for approximately 7 minutes, according to the specifications on Table 2.4. Subsequently, it was rinsed in clean developer and then washed with isopropanol for another 10 seconds with strong manual agitation. At last, the wafer was gently dried with compressed nitrogen and the existence of white traces in its surface was evaluated. If white traces would appear the sample was developed in a fresh agent for an additional minute and rinsed, until no traces were evident in the wafer. At last, the wafer was observed by optical microscopy to verify if the development time was appropriated, considering that peeling of the SU-8 may occur if the development exposure time is too high.
Table 2.4 | Datasheet for the development time acording to the desired film thickness.
The development process is essential to promote the dissolution of the unexposed regions of the wafer and the obtention of the design structures. The time of actuation of the developer was established considering the desired thickness Adapted from52.
Film Thickness (μm) Post Baking Duration (min.)
(65ºC) (95ºC)
25
2.2.2.3.
Casting of PDMS mould
The casting of the PDMS mould consists in obtaining an intermediate replica of the original SU-8 master made of PDMS. Subsequently, a new replica can be casted from the PDMS mould – an epoxy mould – and the final PDMS chips are then acquired. Even though the chips could be directly casted from the SU-8 master, this intermediate process was chosen because the master has a tendency to peel and thus the process was optimized in a long term perspective.
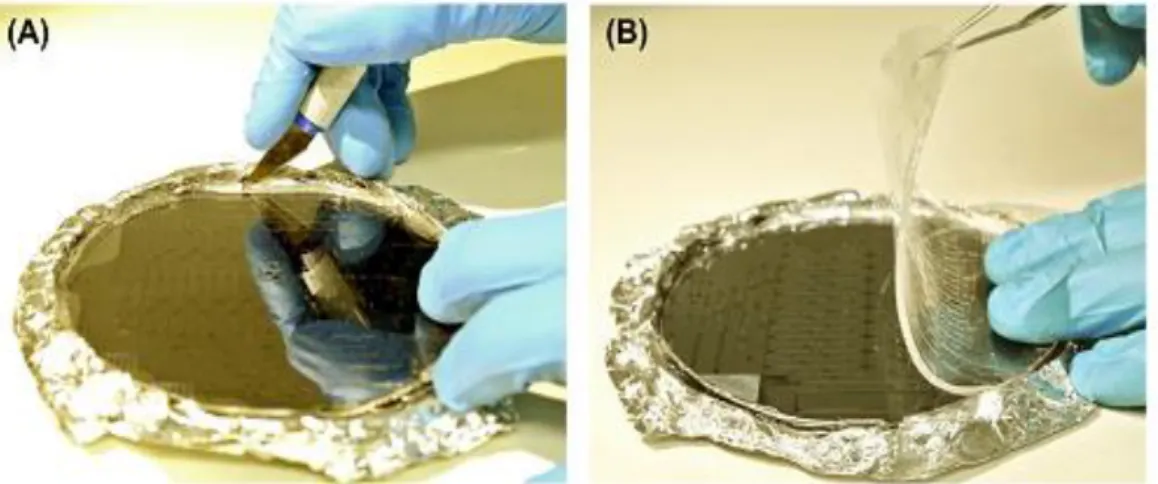
A 35g solution of PDMS (Sylgard 184, Dow Corning, Spain) was prepared by mixing a curing agent and a base in a 10:1 weight ratio. The sample was then mixture and transferred to a vacuum desiccator for 1 hour, to facilitate the degasification of the bubbles formed. Simultaneously, the SU-8 master was placed in a Petri dish covered with acetate foil and also desiccated during 1 hour. Subsequently, the PDMS was poured over the SU-8 mould, and the sample was desiccated and thermally cured. The curing was performed on a levelled hot plate at 65ºC for approximately 3h30. Ultimately, the cured PDMS was peeled from the S8-8 master by cutting and gently pulling the layer formed upon the wafer (Fig 2.6).
Figure 2.6 | Photographs of the steps used to cast the PDMS and obtain a replica of the SU-8 master mould during the chips fabrication.
(A): A PDMS solution containing a current agent was poured onto the SU-8 master and cured. (B): After the curing, the PDMS replica was peeled of the master by cutting and gently pulling the polymer layer.
2.2.2.4.
Casting of Epoxy mould
As previously stated, a processing technique using epoxy as an intermediate mould was included in the fabrication process. This resolution was made considering that epoxy is a much more robust material (due to its monolithic structure) than SU-8, which has a tendency to peel after a few processing.
26
2.2.2.5.
Casting of PDMS chips
At last, the final PDMS chips were casted from the epoxy mould through soft-litography, in a procedure similar to the described for the obtention of the first PDMS mould (Sections 2.2.2.3 to 2.3.3.). The inlets and outlets were then obtained by piercing the PDMS with a blunt needle. The microfabrication procedures used in this experiment are resumed in Fig.2.7, through a display of the samples obtained in each step.
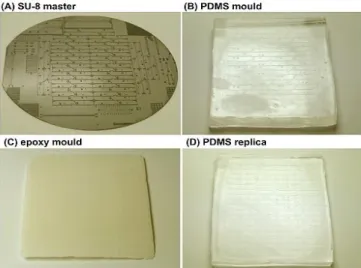
Figure 2.7 | Samples obtained in each step of microfabrication - a summary of the process.
The process was initiated with the fabrication of a SU-8 master (A) and, subsequently, a PDMS mould was casted once (B) to obtain a mould suitable for patterning of an intermediate epoxy mould (C). The epoxy mould was then used to produce several PDMS replicas containing the final chips (D).
2.2.2.6.
Sealing of PDMS chips
The last step of microfabrication comprises the irreversible sealing of the PDMS chips, a process required to prevent fluid leakage during the experimental assays. The final chips were bonded by oxygen plasma at 100W during 60 seconds in 13Pa (Plasma electronic Buck Technologien, Germany) to glass slides – Fig.2.8. Afterwards, the microchips were put into contact with glass and submitted to baking in a hot plate for 15 minutes at 65ºC.
Figure 2.8 | Oxygen plasma chamber used to seal the PDMS structures to a glass slide.
27
2.3.
Slide Migration Assays
Primary biological assays were conducted with resource to standard slide experiments, aiming to validate the migration stimuli hypothesis and forecast the systems behaviour before exploring the microfluidic approach. The protocol developed comprised a set of sequential routines, including FN coating, 37ºC incubation, cell extraction for slide loading and the stimuli introduction, as summarised in Figure 2.9.
Figure 2.9 | Sequential steps comprised in the development of slide migration assays.
The experiment comprises the slide coating with FN, incubation for 37ºC, cell line preparation and loading and, ultimately, the insertion of a stimuli that is expected to promote migration.
On behalf of fibronectin coating, a volume of 80μL (10 𝜇𝑔
𝑚𝐿) fibronectin solution (Sigma) was poured into the cell plate and incubated for one hour at 37ºC without agitation. The fibronectin solution was then removed and the plate was ultimately washed with DPBS solution. Posteriorly, pre-trypsinized cells were loaded onto the inferior half of the slide and, after cell adhesion became evident, the stimuli was introduced – injection of an increased serum medium (89% (𝑣 𝑣⁄ ) DMEM, 10% (𝑣 𝑣⁄ ) FBS and 1% (𝑣 𝑣⁄ ) PS). It is important to refer the need to submit the cells to a lower serum concentration when introducing them in the system, as described in Section 2.1.2.
Furthermore, and taking into account MEFs’ specifications and optimal conditions, emerged a
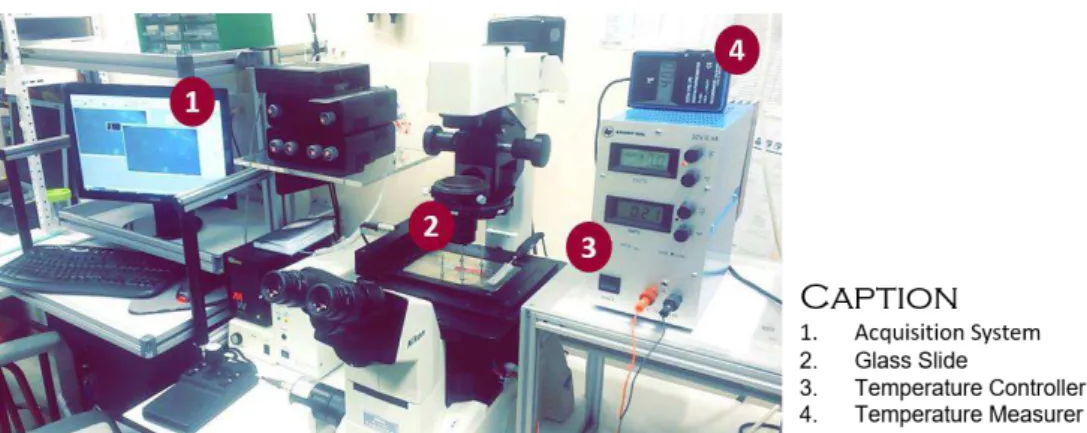
need to create a micro-environment with regulated temperature at approximately 37ºC. The platform was developed with resource to a stainless steel stage of 159 ∗ 109 ∗ 2 𝑐𝑚3 containing two 17W power resistances and coupled to the microscope structure. The fabricated platform was then calibrated through sequential registries of temperature towards voltage until the desired 37ºC degrees were achieved. The results acquired are resumed on Supplementary Information (S1) through a calibration ramp from room temperatures of 25ºC. The final setup of the assembly engaged during a slide experiment is displayed on Fig.2.10.
Figure 2.10 | Experimental setup of the assembly used to proceed the slide primary migration assays.
28
2.4.
On-Chip: Migration Assays
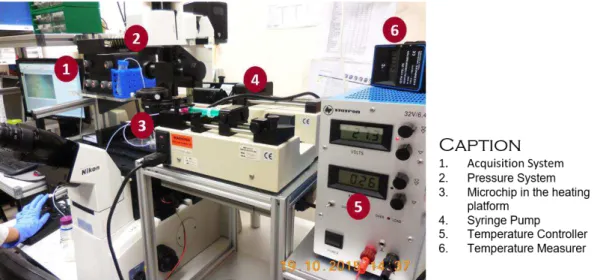
The final biological assays were performed with resource to a microfluidic system, comprising the microdevice itself and the entire structure involved in the course of the experiment. In this context, the temperature control platform and a syringe pump were coupled to the system in order to simplify the handling of the device and optimize the protocol. The setup of the complete assembly used in this project is displayed on Fig. 2.11.
Experimental Protocol
The biological assays’ protocol was initiated with the cleaning of the microdevices in a routine comprising the sequential use of ethanol and PBS. The fluidic block was then connected to a pneumatic pressure supplier through the inlets and outlets and the pressure was controlled through the employment of LabView Software, allowing the samples to flow along the channels.
After the assembly of the platform, a volume of 10-15μL fibronectin (10 𝜇𝑔
𝑚𝐿) was injected in the chip and left at 37ºC during a minimum period of 1 hour. The cells were then inoculated into the microchips within a medium solution with 98% (𝑣 𝑣⁄ ) DMEM supplemented with 1% (𝑣 𝑣⁄ ) FBS and 1% (𝑣 𝑣⁄ ) PS. At this point, the cells were individually separated and imprisoned by dedicated traps, bearing in mind the aim of a single-cell study. After cell adhesion was confirmed, a solution containing an increased serum level (89% (𝑣 𝑣⁄ ) DMEM, 10% (𝑣 𝑣⁄ ) FBS and 1% (𝑣 𝑣⁄ ) PS) was injected in the chamber through the remaining inlets and the flow was progressively reduced in order to allow the formation of a chemical gradient within the device. Once again, it is important to refer that the cell culture must be handled in parallel with the microfluidic assembly –
trypsinization and adaptation to starvation - to prevent viability losses.
The MEFs’ behaviour and response to the stimuli was then followed in real time through optical microscopy and the results were recorded using the Image ProPlus Software. A general display
of the assays’ dynamics after the cleaning and FN incubation is presented in Fig.2.12 for a general microdevice – the protocol was then adapted to the several chips in use.
29 Figure 11.12 | Overall display of a generic microchip along the migration experiments.
31
Chapter 3
33
3.1.
Cell Line Culture
Routines comprising the cell Iine development and adaptation were carefully monitored and registered, bearing in mind that the cells have a central role within the course of the proposed study. In this context, cell growing was followed every 2 days until passage for confluency evaluation and counting after trypsinization (Fig.3.1.).
Figure 3.1 | Cell confluency from plating day (day 0) until trypsinization.
The confluency was followed every two days until an approximate value of 70%, when MEFs passaging is recommended (20x objective).
Cell trypsinization was required before each assay, since this routine allows adherent MEFs to become in suspension within culture medium. This process was found possible within a period of approximately six days since thawing, i.e., cells in culture were ready for passaging after two or three medium exchanges. First attempts of trypsinization were not successful due to the fact that the recommended incubation after trypsin was not enough to de-attach the cells from the substrate. A review of the protocol led to the value mentioned in section 2.1.1, that has made possible to remove MEFs from the well and, according to the expected, microscopic observation revealed a round-shape in the recently suspended cells (Fig.3.2.A).
Subsequent plating was performed after haemocytometer count and according to the table S2 (on Supplementary Information). In order to predict the diameter of a single MEF, a group of trypsinized cells was evaluated in terms of size. The results were acquired through the assessment of 150 generic cells with resource to ImageJ Software (Fig.3.2.B). The cells area was measured and, assuming a spherical shape, the average diameter and respective standard deviation was determined.
34 Statistical evaluation led to an average diameter of 43.96 +
− 14,18 𝜇𝑚, according to the values extracted from ImageJ and resumed in Table S2. The distribution study – Table 3.1- revealed a Gaussian Distribution, as described in Fig.3.3.
Table 3.1 | Parameters used to determine the distribution of cell diameter after trypsinizayion in a sample containing 150 MEFs (μ=43.96μm, σ=14.18 μm).
Size Class (μm) xi Number of Cells fr Zi Gi
The distribution, exhibiting an inferior limit of 19.15μm and superior of 85.85μm was performed
considering classes of 5μm intervals. Regarding Table 3.1., Xi refers to the median value of the class, fr the relative frequency of the occurrence, Zi the standardized value and Gi the correspondence within the Gaussian distribution.
Figure 3.3 | Distribution of MEFs diameters within a sample of 150 cells (μ=43.96μm, σ=14.18 μm).