Vol.55, n. 4: pp. 505-512, July-August 2012
ISSN 1516-8913 Printed in Brazil BRAZILIAN ARCHIVES OF
BIOLOGY AND TECHNOLOGY
A N I N T E R N A T I O N A L J O U R N A L
Optimization
of
Process
Parameters
for
Cellulase
Production from Bacillus sp. JS14 in Solid Substrate
Fermentation Using Response Surface Methodology
Jagdish Singh
*and Pawandeep Kaur
Department of Biotechnology; Mata Gujri College Fatehgarh Sahib Punjab - 147 002, India
ABSTRACT
The aim of this work was to isolate the potent bacterial strains for the production of cellulose enzyme. A total 30 bacterial isolates showed positive results for the cellulase production but highest enzyme activity was shown by isolate JS 14. From the morphological and biochemical reactions, the isolate was identified as Bacillus sp. Cellulase production was studied by this strain using response surface methodology (RSM). A central composite design (CCD) quadratic response surface was applied to explicate the parameters that significantly affected cellulase production in solid substrate fermentation (SSF). The wheat bran concentration and incubation period were significant factors. The process parameters optimized with response surface methodology was wheat bran concentration 400 g/L; pH, 6.5; temperature, 400C and incubation period 5 days when inoculum 10 % (1x10⁷ cells/ ml) was used for cellulase production in SSF. Supplementation of lactose and CMC to the wheat bran medium favored the enzyme formation.
Key words: Cellulase, response surface methodology, optimization
*Author for correspondence: jagdish122@rediffmail.com
INTRODUCTION
Cellulosic material is the most abundant renewable carbon source in the world. Cellulose may be hydrolyzed using enzymes to produce glucose, which can be used for the production of ethanol, organic acids and other chemicals. Cellulase (E.C 3.2.1.4) refers to a class of enzyme that catalyze the hydrolysis of 1, 4 β-D glycosidic linkages in cellulose are mainly produced by fungi, bacteria and protozoans (Beguin and Aubert 1994) and have broad range of industrial and commercial applications (Bhat 2000; Adsul et al. 2007; Kaur et al. 2007). An important obstruction in the exploitation of cellulase is expensive production affecting the overall cost of hydrolysis (Chahal et
building models, evaluating the effects of factors and searching for the optimum conditions, has successfully been used in the optimization of bioprocesses (Dey et al. 2001; Wejse et al. 2003; Kristo et al. 2003; Chen et al. 2005). The objective of this work was to isolate an efficient cellulase producing microorganism and produce the enzyme in SSF.
MATERIALS AND METHODS
Isolation screening and identification of microorganisms
Cellulase producing bacteria were isolated from the soils, decomposing logs and composts collected from the Fatehgarh Sahib Punjab (India) by the spread plate techniques using CMC agar media. The plates were incubated at 370C for 24 h. To visualize the hydrolysis zone, the plates were flooded with an aqueous solution of 0.1% Congo red for 15 min and washed with 1 M NaCl (Ariffin et al. 2008). To indicate the cellulase activity of the organisms, diameters of clear zone around colonies on CMC agar were measured. Besides the cellulase activity of the selected bacterial isolate in liquid medium. The cellulase activity of each culture was measured by determining the amount of reducing sugar liberated by using a dinitrosalicylic acid (DNS) method (Miller 1959). The bacterial isolates with high enzyme production were identified by means of the morphological and biochemical characterizations. The parameters investigated included colonial morphology, Gram staining, catalase production, starch hydrolysis and nitrate reduction test. The results were compared with Bergey’s Manual of
Determinative Bacteria (Buchanan and Gibbons 1974).
Experimental design and optimization of process parameters for cellulase production A central composite design (CCD) was used to pick the factors that influence cellulase production significantly with software Design expert 8.01. In CCD, the range and the levels of the variables investigated in this study are given in Table 1.The central values (zero level) chosen for the experimental design were; wheat bran concentration (X1) 35%; pH (X2) 6.25; temperatures (X3) 350C and incubation time (X4) 5.5 days. Different combination of variables of wheat bran and pH was adjusted according to the design (Table 2) in the alkaline soya casein medium. Inoculation was carried with 10% (1×10⁷ cells/mL) inoculum and incubated at various temperature and time combinations, according to RSM design (Table 2). Low and high factor settings were coded as –1 and 1, the midpoint was coded as 0. The factor settings of trails that ran along the axes drawn from the middle of the cube through the centers of each face of the tube were coded as 1.414 or –1.414. The Design expert 8.0.1 software, was used for regression and graphical analyses of the data obtained. The optimal concentrations of the critical medium components were obtained by the ridge analysis and also by analyzing the contour plots. The statistical analysis of the model was performed in the form of analysis of variance (ANOVA). The enzyme was extracted by phosphate buffer (0.1M and pH 6.5) from the solid medium on rotary shaker at 200 rpm by filtration and enzyme activity in filtrate was determined.
Table 1 - Factors involved in RSM for optimization of cellulose production.
Factors andCodes value (X) Value (-1) Value (0) Value (+1)
Wheat Bran % (X1) 30 35 40
pH (X2) 5 6.25 7.5
Temperature (°C) (X3) 30 35 40
Incubation Period in days (X4) 2 5.5 9
Effect of inoculum size on cellulase production Inoculum concentration of Bacillus sp. JS14 was varied from 5-20% (1×10⁷ cells /mL) in different batches of 200 mL of the sterilized alkaline soya casein medium containing what bran 40% pH 6.5 and Incubation was carried out at 40 0C for 5 days.
Enzyme was harvested by filtration method and enzyme activities was determined
Determination of cellulase activity
Reducing sugar was measured by the DNS method using glucose as the standard (Miller 1959). In this study, one international unit (IU) of enzyme activity was defined as the amount of enzyme that liberated one µmol of glucose per minute under the specified conditions from the appropriate substrate.
RESULTS AND DISCUSSION
Isolation, screening and identification of cellulase producing microorganisms
Total 30 bacterial isolates when applied the Congo red test, showed positive results with clear zone ranging from 1 to 7 mm (data not shown). Upon further quantitative determination of cellulose degrading enzyme, all the isolates displayed activity of cellulase with the highest enzyme activity from the isolate JS14. Although the Congo red test was sensitive enough for primary isolation and screening of cellulytic bacteria, but the clear zone width did not indicate the amount of cellulase
activity, Krootdilaganandh, (2000) reported that bacterial isolates CMU4-4 grown on CMC agar, exhibited the highest enzyme activity in the liquid medium whereas its clear zone was smaller than other isolates. The isolate JS14 showed white colonies on CMC agar. A microscopic examination of the isolate revealed that it was a Gram positive bacterium and produced enzyme catalase. Furthermore, the JS14 displayed starch and nitrate reduction test. From these morphological and biochemical characterization, the isolate was identified as Bacillus sp.
Optimization of process parameters in SSF by Response surface methodology (RSM) for cellulase production
The concentration of wheat bran (X1 400 g/L), pH (X2 6.5), temperature (X3 40 0C) and incubation period (X4 5days) in solid substrate were chosen as optimum for cellulase production by SSF. Table 2 shows the design and the results of this experiment.
Table 2 - A central composite designs for cellulase enzyme production using RSM.
S.No Values of factors (X) Cellulase activity
(IU/L)
X1 X2 X3 X4
1. 35 5.50 30 5.50 540
2. 35 6.50 30 9 420
3. 35 7.50 35 2 210
4. 40 6.50 40 5 2040
5. 35 5.50 40 5.50 1070
6. 35 6.50 40 9 520
7. 30 6.50 35 2 130
8. 30 6.50 30 5.50 590
9. 35 7.50 40 5.50 2010
10. 40 6.50 35 9 460
11. 35 5.50 35 9 290
12. 40 5.50 35 5.50 1030
13. 30 7.50 35 5.50 650
14. 35 6.50 35 5.50 1330
15. 35 6.50 30 2 230
16. 35 6.50 35 5.50 1330
17. 35 6.50 35 5.50 1330
18. 30 6.50 40 5.50 1080
19. 40 6.50 35 2 290
20. 35 6.50 40 2 250
21. 35 7.50 35 9 330
22. 35 6.50 35 5.50 1330
23. 30 6.50 35 9 280
24. 40 6.50 30 5.50 1550
25. 35 7.50 30 5.50 200
26. 35 5.50 35 2 170
27. 35 6.50 35 5.50 1330
28. 40 7.50 35 5.50 1490
29. 30 5.50 35 5.50 780
Braz. Arch. Biol. Technol. v.55 n.4: pp. 505-512, July/Aug 2012 Regression analysis was performed to fit the
response function with the experimental data. The statistical significance of the second order model equation was checked by an F-test (ANOVA) and the data were shown in Table 3.The regression model for cellulase production was highly significant (p<0.003) with a satisfactory value of determination coefficient (R2=0.95), indicating that 95 % of the variability in the response could be explained by the second-order model equation given as below:
y=284.09494+37.31286X1+225.23766X243.4724 3X3+790.58161X4+28.95995X1X2+0.043204X1X 3+0.28792X1X4+64.21602X2X3+0.011021X2X4+ 1.14198X3X4-2.47136X12-261.78389X22
where y is the measured response, and X1, X2, X3 and X4 are coded independent variables. The Model F-value of 8.16 implied the model was significant (Table 3). There is only a 0.01% chance that a "Model F-Value" this large could occur due to noise. Values of "Prob > F" less than 0.0500 indicated that the model terms were significant. The "Pred R-Squared" of 0.7664 was as close to the "Adj R-Squared" of 0.7757 as one might normally expect (Table 4). "Adeq Precision" measures the signal to noise ratio. A ratio greater than 4 is desirable. Ratio of 9.309 indicated an adequate signal. This model could be used to navigate the design space.
Table 3 - ANOVA for Response Surface Quadratic Model Analysis of variance table [Partial sum of squares - Type III].
Source* Sum of Squares Df Mean Square F Value P value Prob > F Model
X1 X2 X3 X4
X1 X2
X1 X3
X1 X4
X2 X3
X2X4 X3X4 X12 X22 X32 X42 Residual Lack of Fit Pure Error Cor Total 8.405E+006 6.060E+005 3.812E+005 4.427E+005 67779.73 98643.63 321.72 75.80 4.225E+005 6.007E-003 450.17 23311.90 4.621E+005 11264.03 5.386E+006 1.103E+006 1.103E+006 0.000 9.509E+006 14 1 1 1 1 1 1 1 1 1 1 1 1 1 1 15 11 4 29 6.004E+005 6.060E+005 3.812E+005 4.s427E+005 67779.73 98643.63 321.72 75.80 4.225E+005 6.007E-003 450.17 23311.90 4.621E+005 11264.03 5.386E+006 73559.26 1.003E+005 0.000 8.16 8.24 5.18 6.02 0.92 1.34 4.374E-003 1.030E-003 5.74 8.166E-008 6.120E-003 0.32 6.28 0.15 73.22 0.0001 0.0117 0.0379 0.0269 0.3523 0.2650 0.9481 0.9748 0.0300 0.9998 0.9387 0.5818 0.0242 0.7011 < 0.0001
*X1 Concentration of wheat bran (%), X2 pH, X3 Temperature (0C) and X4 incubation period (days).
Table 4 - ANOVA results for cellulase production obtained from CCD.
S.NO Parametr Value
1. Std. Dev 271.22
2. Mean 817.00
3. Adj R-Squared 0.7757
4. C.V. % 33.20
5. R-Squared 0.8840
6. Pred R-Squared 0.7664
Braz. Arch. Biol. Technol. v.55 n.4: pp. 505-512, July/Aug 2012 variables such as wheat bran concentration, pH,
temperature and incubation period are shown in Figure 1. The canonical analysis revealed that maximum CMCase activity of 2040 IU/L was achieved at wheat bran concentration 400 g/L; pH 6.5; temperature 40 0C and incubation period of five days.
Effect of inoculum size on cellulase production Lower inoculum size requires longer time for the cells to multiply to sufficient number to utilize the
number of cells in the inoculums would ensure a rapid proliferation and biomass synthesis. When inoculum size was increased from 5 to 10% there was increase in enzyme production but after that the activity was decreased (Fig. 2) due to depletion of nutrients by the enhanced biomass, which resulted dwindle in metabolic activity (Kashyap et al. 2002). A balance between the increasing biomass and accessible nutrient would yield an optimal enzyme production (Ramachandran et al. 2004).
Figure 1 - Surface plot for the effect of (a) wheat bran and pH (b) temp and pH (c) incubation period and substrate conc. and (d) temp and substrate conc. on CMCase activity.
A B
C D
Braz. Arch. Biol. Technol. v.55 n.4: pp. 505-512, July/Aug 2012 Figure 2 - Effect of inoculum (%) on enzyme production.
Effect of supplementation of what barn with different carbon sources and ions
Although wheat bran supported the growth of
Bacillus sp. JS14 and cellulase production, but it might not supply sufficient nutrients needed by the organism for maximum enzyme production. Hence, the addition of different carbon sources to the medium was conceded to improve the cell growth and enzyme production. The supplementation of wheat straw, rice husk and baggase had little effect on cellulase production,
while lactose and carboxy methyl cellulose enhanced enzyme production. Among them, lactose improved the cellulase production the most, which increased 40% compared to the control (Fig. 3). Lactose was also considered as a good inducer for cellulase production by the Seiboth et al (2005).
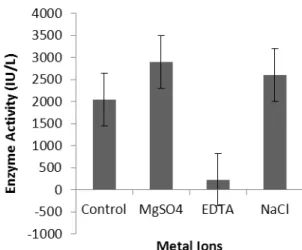
The production of cellulase was enhanced by the addition of NaCl and MgSO4 while EDTA reduced the production (Fig.4).
Figure 4 - Effect of different ions on the cellulase production.
REFERENCES
Adsul MG, Bastawde KB, Varma AJ, Gokhale DV. Strain improvement of Penicillium janthinellum NCIM 1171 for increased cellulaseproduction. Bioresour Technol. 2007; 98: 1467-1473.
Ariffin HN, Abdullah MS, Umikalsom Y, Shirai, Hassan MA. Production of bacterial endoglucanase from pretreated oil palm empty fruit bunch by Bacillus pumilus EB3. J Biosci Bioeng. 2008; 106: 231-236.
Beguin P, Aubert JP. The biological degration of cellulose. FEMS Microbiol Rev. 1994; 13: 25-28. Bhat MK. Cellulases and related enzymes in
biotechnology. Biotechnol Adv. 2000; 18:355-383. Buchanan RE, Gibbons NE. Bergey’s of determinative
bacteriology. America: United States of America. 1974; 529-563.
Chahal PS, Chahal DS, Andre G. Cellulase production profile of Trichoderma reesei on different cellulosic substrates at various pH levels. J Ferment Bioeng. 1992; 74: 126-128.
Chen F, Cai TY, Zhao GH, Liao XJ, Guo LY, Hu XS. Optimizing conditions for the purification of crude octacosanol extract from rice bran wax by molecular distillation analyzed using response surface methodology. J Food Eng. 2005; 70: 47–53.
Dey G, Mitra A. Banerjee R, Maiti BR. Enhanced production of amylase by optimization of nutritional constituents using response surface methodology. Biochem. Eng. J. 2001; 7: 227–231.
Duff SJ, Murray WD. Bioconversion of forest products industry waste cellulosics to fuel ethanol: a review. Bioresour Technol. 1996; 55: 1-33.
Kashyap P, Sabu A, Pandey A, Szakacs G. Extra-cellular Lglutaminase production by Zygosaccharomyces rouxii under solidstate fermentation. Process Biochem. 2002; 38: 307–312 Kaur J, Chadha BS, Kumar BA, Saini HS. Purification
and characterization of two endoglucanases from Melanocarpus sp. MTCC 3922. Biores Technol. 2007;98: 74-81
Kristo E, Biliaderis CG, Tzanetakis N. Modelling of the acidification process and rheological properties of milk fermented with a yogurt starter culture using response surface methodology. Food Chem. 2003; 83: 437–446.
Krootdilaganandh J. Isolation and selection of thermotolerant bacteria capable of producing cellulase. Chiang Mai: Chiang Mai University Press. 2000;88: 20-21.
Lee SL, Chen WC. Optimization of medium composition for the production of glucosyltransferase by Aspergillus niger with response surface methodology. Enzyme Microb Technol. 1997; 21: 436–440.
Mandels M. Applications of cellulases. Biochem Soc Trans. 1985; 13: 414–416.
Nieves RA, Ehrman CL, Adney WS, Elander RT, Himmel ME. Technical communication: survey and analysis of commercial cellulase preparations suitable for biomass conversion to ethanol. W J Microbiol Biotechnol. 1998; 14: 301-304.
Ramachandran S, Patel AK, Nampoothiri KM, Francis F , Nagy V, Szakacs G, Pandey A. Coconut oil cake– –a potential raw material for the production of amylase. Biores Technol. 2004; 93: 169–174.
Reczey K, Szengyel Z, Eklund R, Zacchi G. Cellulase production by T. reesei. Biores Technol. 1996; 57: 25-30.
Seiboth B, Lukas H, Salovuori N, Karin L, Robson DG, Vehmaanpera J, Penttila ME, Kubicek CP. Role of the bga1-encoded extracellular galactosidase of Hypocrea jecorina in cellulase induction by lactose. Appl Environ Microbiol. 2005 ;71:851–857.
Silva CJ, Roberto C. Optimization of xylitol production by Candida guilliermondii FTI 20037 using response surface methodology. Process Biochem. 2001; 36: 1119–1124.
Teruel MLA, Gontier E, Bienaime C, Saucedo JE, Barbotin JN. Response surface analysis of chlortetracycline and tetracycline production with K-carrageenan mmobilized Streptomyces aureofaciens. Enzyme Microb Technol. 1997; 21: 314–320.
Wejse PL, Ingvorsen K, Mortensen KK. Xylanase production by a novel halophilic bacterium increased 20-fold by response surface methodology. Enz Microb Technol. 2003; 32: 721–727.


![Table 3 - ANOVA for Response Surface Quadratic Model Analysis of variance table [Partial sum of squares - Type III]](https://thumb-eu.123doks.com/thumbv2/123dok_br/15958532.683424/4.892.107.790.494.835/table-response-surface-quadratic-analysis-variance-partial-squares.webp)