Vol.56, n.6: pp. 985-995, November-December 2013
ISSN 1516-8913 Printed in Brazil BRAZILIAN ARCHIVES OF
BIOLOGY AND TECHNOLOGY
A N I N T E R N A T I O N A L J O U R N A L
Action of a Pancreatin and an
Aspergillus oryzae
Protease on
Whey Proteins: Correlation among the Methods of Analysis
of the Enzymatic Hydrolysates
Harriman Aley Morais
1,2, Marialice Pinto Coelho Silvestre
2,3*, Josianne Nicácio Silveira
2,
Ana Cristina Simões e Silva
2, Viviane Dias Medeiros Silva
3and Mauro Ramalho Silva
31Universidade Federal dos Vales do Jequitinhonha e Mucuri; Diamantina - MG - Brasil. 2Universidade Federal de
Minas Gerais, Belo Horizonte - MG - Brasil. 3Edetec Indústria Alimentícia S/A.; Belo Horizonte - MG - Brasil
ABSTRACT
The objectives of this study were to hydrolyze whey proteins using a pancreatin and an Aspergillus oryzae protease; to evaluate the degree of hydrolysis (DH) and the peptide profile; and to establish the correlations among the analytical methods. Ten hydrolysates were prepared at different reaction times and the highest DH was obtained by the protein content method. Good correlations (r ≥ 0.87) between the methods of formaldehyde and orthophthalaldehyde (OPA), formaldehyde and osmometry as well as osmometry and OPA were observed using pancreatin. Similar results were obtained between OPA and soluble protein content for the A. oryzae protease. The action of pancreatin produced the highest contents of di- and tripeptides (9.07, 7.12 and 6.46%) and the lowest of large peptides (42.43, 41.33 and 41.13%), after 3, 4 and 5 h of hydrolysis, respectively. Using pancreatin, the DH measured by formol titration and OPA was positively correlated with medium peptide content and negatively correlated with large peptide content. For the A. oryzae protease, a strong negative correlation was observed between the large peptide content and the DH measured by the OPA method.
Key words: Whey, Protein Hydrolysates, Degree of Hydrolysis, Peptides, Pancreatin, Aspergillus oryzae Protease
*Author for correspondence: [email protected]
INTRODUCTION
Cheese manufactures generate whey, a byproduct that is considered an industrial waste with low added value in several countries. The main destination of whey is disposal in waterways, or use as animal feed (Madureira et al. 2007; Carrasco and Guerra 2010). Nutritional value of whey can be improved by enzymatic hydrolysis of proteins and increase the functional, technical, physiological and bioactive properties of its proteins (Benítez et al. 2008; Cheison et al. 2009). Although whey is a source of ingredients with significant biological value, its use in natura is
limited because of its perishable components and their excessive dilution. However, certain membrane separation technologies can be used to partially concentrate the whey, giving rise to whey protein concentrate (WPC) as 35-80% proteins (Brans et al. 2004).
(Silvestre 1997). Silvestre et al. (1994a, b) developed a method based on the fractionation of peptides by size exclusion high performance liquid chromatography, which allowed the separation and quantification of peptides with molecular masses smaller than 1,000 Da.
The extent of proteolysis can be evaluated by the degree of hydrolysis (DH), referring to the percentage of cleaved peptide bonds in proteins. Although there have been many studies on the determination of the DH for whey proteins, there are far fewer data in the literature comparing the methods used for assessing this parameter, especially for techniques that are based on different principles. Moreover, in these studies, the comparisons had been carried out only between the methods based on the reaction of α-amino
groups with either derivatizing agent (Nielsen et al. 2001) or the pH stat method (Spellman et al. 2003; Cheison et al. 2009). It is worth stating that the correlation between the DH and the peptide profile of WPC hydrolysates has not previously been established.
The objectives of this study were as follows: to employ a pancreatin and an Aspergillus oryzae
protease to hydrolyze the WPC proteins; to evaluate the degree of hydrolysis using four different methods as well as the distribution of the peptides according to the chain size; and to establish correlations among the methods of DH determination and between the DH and the peptide profile.
MATERIALS AND METHODS
Materials
Pancreatin (Corolase PP, activity of 5.97 U.mL-1)
and an Aspergillus oryzae protease
(FlavourzymeTM, activity of 0.69 U.mL-1) were
kindly provided by AB Enzymes (Barueri, SP, Brazil) and Novozymes (Araucária, PR, Brazil), respectively. In this study, the enzyme activity was defined as the amount of enzyme required to liberate 1 g of tyrosine in 1 min at 37 ºC. WPC (Kerrylac 750) in powdered form was kindly provided by Kerry of Brazil Ltd. (Três Corações, MG, Brazil). Formic acid was purchased from Merck (Whitehouse Station, NJ, USA). Orthophthalaldehyde (OPA, Code P0657), 2-mercaptoethanol (code M6250) and Folin-Ciocalteu reagent (code F9252) were purchased from Sigma (São Paulo, SP, Brazil). The
tangential flow system with a 10 kDa cut-off membrane and the polyvinylidene fluoride membranes used for the filtration of the samples (0.22 µm) and solvents (0.45 µm) were purchased from Millipore (São Paulo, SP, Brazil). All other reagents used in this study were of analytical grade. The HPLC system used for fractionating the protein hydrolysates consisted of one isocratic pump and a UV-Vis detector (1200 Series, Agilent, Santa Clara, CA, USA) coupled to a computer with ChemStation software for LC Systems (Agilent, Santa Clara, CA, USA). A poly(2-hydroxyethylaspartamide)-silica (PHEA) column (250 x 9.4 mm, 5 µm and 200 Å pore size) was used for HPLC. The water for HPLC was purified by passage through a MilliQ water purification system (Millipore, Billerica, MA, USA).
Preparation of hydrolysates from whey protein concentrate
Ten WPC hydrolysates were prepared with (A) pancreatin, pH 7, 50 °C (H1 to H5) and (B)
Aspergillus oryzae protease, pH 7, 50°C (H6 to
H10), varying the hydrolysis time (1, 2, 3, 4 and 5 h, respectively) for both enzymes. The pH (7.0) and temperature (50°C) values corresponded to the optimal conditions for the both the enzymes. WPC solutions (10%), which corresponded to 3.42% protein (w/v), were prepared in distilled water and the pH was adjusted to 8.0 with a 3 mol L-1 NaOH
solution. Subsequently, the WPC solutions were heated in an oil bath with continuous stirring (stirrer model 752A from Fisatom, São Paulo, SP, Brazil) and the enzymes were added in an appropriate quantity to attain an enzyme:substrate ratio of 8.0:100 (w/w). The reaction time varied from 1 h to 5 h, which was stopped by heating the samples at 75 ºC for 15 sec. The hydrolysates were immediately used for the determination of DH and then freeze-dried (Freeze Dry System/FreeZone 4.5, model 77500, Labconco, Kansas City, MO, USA) for the characterization of the peptide profile. The hydrolysates were stored in the freezer (-20 ºC) until analysis.
Determination of the degree of hydrolysis
on the quantification of the soluble protein content after precipitation with trichloroacetic acid. For each method, a blank using unhydrolyzed WPC was subjected to the same procedure that was used for the hydrolyzed samples.
Formol titration
The DH was calculated using the relationship between α-amino nitrogen (AN) and total nitrogen (TN) according to Equation 1:
100 (TN) nitrogen total (AN) nitrogen amino DH
% = α ×
(1) The Sorensen method (AOAC 1995) was used for quantifying the AN. The formaldehyde reagent was prepared by diluting 25 mL of the commercial solution with 50% ethanol to a final volume of 250 mL. The pH was adjusted to 7.0 with 0.2 mol L-1
NaOH solution just prior to use. The pH of the hydrolysate solution was also adjusted to 7.0 with 0.2 mol L-1 NaOH solution. Three milliliters of the
formaldehyde reagent was added to 3.0 mL of the hydrolysate solution and the mixture was stirred and titrated with a 0.2 mol L-1 NaOH solution with
phenolphthalein as an indicator of its final endpoint. An excess of the 0.2 mol L-1 NaOH
solution was added and the solution was then back-titrated with a 0.2 mol L-1 HCl solution until
it became colorless. The required volumes of NaOH and HCl solutions were recorded. The TN was determined by the Kjeldahl method (AOAC 1995).
Derivatization with orthophthalaldehyde
For this analysis, the OPA reagent was prepared according to the method of Church et al. (1983). A 25 mL volume of sodium tetraborate solution (100 mmol L-1) was mixed with 2.5 mL of 20% (w/v)
sodium dodecyl sulfate solution, 40 mg of OPA (dissolved in 1.0 mL of methanol) and 100 µL of 2-mercaptoethanol. The volume was adjusted to 50 mL using type I water. The reagent was always prepared immediately before the use and placed in a vial covered with aluminum foil to protect it from the light. The method described by Spellman et al. (2003) was used with some modifications for the derivatization. A volume of 10 µL of the sample was mixed with 3.4 mL of the OPA reagent and the mixture was allowed to stand at 25°C for 2 min. Subsequently, the absorbance was read at 340 nm. The degree of hydrolysis was calculated according to Equation 2:
c ) d x 934 , 1 x ABS ( (%)
DH = (2)
where ABS is the absorbance of the samples, d is the dilution factor and c is the protein concentration of the sample (g L-1).
Osmometry
For this analysis, a sample volume of 50 µL was immediately removed after the reaction to determine the freezing point, which was measured using a micro-osmometer (Precision System 5004, Spectrun, São Paulo, Brazil). The freezing point depression was used to determine the degree of hydrolysis according to Equation 3, as proposed by Adler-Nissen (1986):
100 h 1 1 f % P C (%) GH tot
osm ×
× ω × × ∆ = (3)
where ∆C is the osmolarity (mOsmol L-1), P% is
the protein concentration (g of protein/kg of water), 1/ω is the calibration factor of the
osmometer, representing the reciprocal of the osmotic coefficient of peptides, typically a constant value of 1.04, and htot is the total number
of peptide bonds in the protein, which is 8.8 mEq g-1 of protein for whey.
Soluble protein content in trichloroacetic acid
The degree of hydrolysis of WPC was also determined by the percentage of soluble protein in 10% (w/v) trichloroacetic acid (TCA) in relation to the total protein content of the sample according to the method of Hoyle and Merritt (1994), with modifications. Hydrolysate aliquots of 500 µL were mixed with 500 µL of a 20% (w/v) TCA solution to obtain soluble and insoluble fractions in 10% TCA. After 30 min of incubation at room temperature, the mixture was centrifuged at 3000 x
g. The soluble protein content of the supernatant
was determined by the method of Lowry et al. (1951), which was modified by Hartree (1972), and the result was expressed as mg of protein. Bovine serum albumin was used as the standard. The degree of hydrolysis was calculated according to Equation 4:
) mg ( content protein total 100 ) mg ( TCA % g 10 in content protein le lub so (%)
DH = ×
Characterization of peptide profiles from WPC Hydrolysates
The characterization of peptide profiles was performed in two stages, which included the fractionation of peptides by size and their subsequent quantification. The fractionation of WPC hydrolysates was performed by size exclusion (SE) HPLC on a PHEA column, according to the method of Silvestre et al. (1994a) using 0.05 mol L-1 formic acid (pH 2.5) as the
mobile phase and isocratic conditions at a flow rate of 0.5 mL min-1 for 35 min. The samples were
dissolved in the mobile phase (0.1% w/v) and filtered through a 0.22 µm membrane, and 50 µL of these solutions were injected onto the column. The mobile phase was filtered through a 0.45 µm membrane and degassed by sonication in an ultrasound bath (USC1400 model, Unique, Santo Amaro, SP, Brazil) for 30 min prior to use. The rapid method of Correct Fraction Area (CFA) as described by Silvestre et al. (1994b) was used to quantify the peptides and free amino acids in the SE-HPLC fractions of the WPC hydrolysates. Briefly, five whey standard hydrolysates (two using trypsin and three using pancreatin) were prepared and then fractionated into four fractions by SE-HPLC, as described above. The four fractions were collected (Fraction Collector, CF-1 model, Spectrum Chrom, Houston, TX, USA) and submitted for amino acid analysis after solvent removal (Centrivap, 78100-00D model, Labconco, Kansas City, MO, USA). The calculation of the CFA was performed using specific formula after detection at three wavelengths (230, 280 and 300 nm) to remove the contribution of aromatic amino acids. A standard curve was drawn to correlate the CFA with the amino acid contents of the fractions.
Statisticalanalysis
All the assays were performed in three replicates, each measured by triplicate analysis. To verify the significant hydrolysis effects among the different treatments, a completely randomized design was adopted using a split-plot (4 x 6 method hydrolysis times) analysis scheme, and the results were analyzed with SISVAR version 5.3 software (Ferreira 2010). An experimental design consisting of complete randomization was adopted for the factorial analysis (2 x 6 enzyme hydrolysis times) of the peptide profiles and the results were analyzed with Statistica software. The ANOVA and Duncan tests at 5% probability were used to
determine the differences between the means of the degree of hydrolysis as well as the contents of peptides and free amino acids in the WPC hydrolysates. Significant differences (p < 0.05) between the means were evaluated by Duncan's test (Pimentel-Gomes 2000). Correlations between the degrees of hydrolysis obtained by the different methods with the contents of the peptides and free amino acids were obtained by the Pearson's correlation coefficient (r), which measured the degree of association between two variables; p was calculated by t-tests using BioStat software (Ayres et al. 2007) for data analysis.
RESULTS AND DISCUSSION
Influence of the methods on the degree of hydrolysis
Regarding pancreatin action, a wide range of values of DH can be observed in Figure 1, depending on the type of method used in this analysis. The results of the DH of the samples were deducted by the DH values of the blank (26.6% for OPA, 8.4% for soluble protein content, 6.7% for formol titration and 7.4% for osmometry). The highest DH results (mean 35.85%) were obtained for H1, H2, H3 and H4 hydrolysates using the soluble protein content method. For all the hydrolysates (H1 to H5), the highest values were obtained by this method and were much higher than those obtained by the other three methods (OPA, osmometry and formol titration).
and chymotrypsin) and exopeptidase (carboxypeptidases) activities (NC-IUBMB 2010) with high activity (5.97 U mL-1), its action might
have led to an efficient hydrolysis of WPC, resulting in a large content of small peptides. These peptides remained soluble after the addition of trichloroacetic acid, producing high DH values with the soluble protein content method.
17.20Bc
24.86Ab
26.51Ab
29.82Ab
30.52Ab
21.33Ab
21.70Ac 22.16Ac 22.28Ac 22.48Ac
3.26Ad 3.32Ad 3.61Ad 3.80Ad 4.02Ad
35.62ABa 35.68ABa 36.41Aa 35.68ABa
34.28Ba
0.0 10.0 20.0 30.0 40.0
H1 H2 H3 H4 H5
D
e
g
re
e
o
f
h
y
d
ro
ly
s
is
(
%
)
WPC hydrolysates
Figure 1 - Degree of hydrolysis of WPC hydrolysates obtained by the action of a pancreatin. Methods of formol titration ( ), derivatization with orthophthalaldehyde ( ), osmometry ( ) and soluble protein content ( ). The results represent the means of triplicate experiments. Different capital letters represent significantly different (p < 0.05) values for a same
method and different hydrolysates. Small letters represent significantly different (p <
0.05) values for a same hydrolysate and different methods.
After the soluble protein content method, the method that produced the highest values of DH with pancreatin was formol titration, whose result was only inferior to that obtained by the OPA method for H1 (Fig. 1). The action of two enzymes found in the pancreatin preparation could explain the higher DH values obtained by the formaldehyde method in relation to OPA for most of the samples. One enzyme is trypsin, which preferably cleaves the peptide bonds containing residues of lysine, or arginine, and the other enzyme is chymotrypsin, which hydrolyzes peptide bonds with basic, or aromatic amino acids (Gupta et al. 2002; Hinsberger and Sandhu 2004; Page and Di Cera 2008). The action of these enzymes most likely increased the exposure of
basic amino acid residues whose side chains also had protons that could be released by the addition of formaldehyde (Levy 1935; Taylor 1957). The OPA method produced the third highest DH value, as demonstrated in Figure 1 for pancreatin. When using the OPA method, it is important to note that although whey proteins have a high percentage of lysine, whose ε-amino group can also react with the derivatizing agent leading to an overestimation of DH (Church et al. 1983). They are also rich in cysteine, which reacts weakly and unstably with OPA, and may reduce the DH of WPC hydrolysates (Spellman et al. 2003). This explained the third position occupied by the OPA method in terms of DH value. The practically constant values of DH obtained by the OPA method in the present study could be attributed to the fact that while the actions of trypsin and chymotrypsin found in pancreatin would lead to a greater exposure of lysine (Gupta et al. 2002; Hinsberger and Sandhu 2004; Page and Di Cera 2008), thus increasing the DH, the action of carboxypeptidase A would increase the content of free sulfhydryl groups by the release of cysteine and low molecular weight peptides containing cysteine (Pacheco and Sgarbieri 2005), thus leading to lower DH values.
Other authors have also used the OPA method for evaluating the DH of WPC proteins hydrolyzed by pancreatin. Using different hydrolytic conditions of the present study (pH 8, 37 °C, E:S 1:50, reaction time of 8:30 h), Smyth and FitzGerald (1998) have reported a maximum DH of 11.5%, which is lower than the values obtained in the current work (21.33 to 22.48%). The higher results obtained here could be explained by the addition of 2-mercaptoethanol. According to Roth (1971), the reaction of cysteine with OPA can be optimized when the reagent is mixed with a solution of amino acids in the presence of a strong reducing agent.
exposure of aromatic, or basic amino acid residues (Gupta et al. 2002; Rawlings et al. 2010). This would cause a pH change in the solution, leading to the aggregation of peptides and, consequently, gradually increasing the viscosity and turbidity of the solution (Doucet et al. 2003). There are no reports in the literature using soluble protein content, osmometry, or formaldehyde to assess the degree of hydrolysis of WPC by the action of pancreatin.
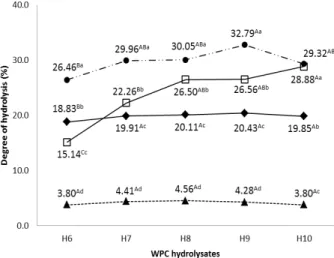
As shown for pancreatin, a wide range of DH values were also observed for A. oryzae protease,
which varied with the method used (Fig. 2). The DH values of the blank (26.6% for OPA, 8.4% for soluble protein content, 6.7% for formaldehyde and 7.4% titration for osmometry) were subtracted from the DH values of the samples. It was noteworthy that for this enzyme, the influence of the method on the DH results showed a similar ranking as pancreatin, i.e., higher DH values were
obtained with the soluble protein content method, followed in order by formol titration, OPA method and osmometry.
Figure 2 - Degree of hydrolysis of WPC hydrolysates obtained by the action of Aspergillus oryzae
protease. Methods of formol titration ( ), derivatization with orthophthalaldehyde ( ), osmometry ( ) and soluble protein content ( ). The results represent the means of triplicate experiments. Different capital letters represent significantly different (p <
0.05) values for the same method and different hydrolysates. Small letters represent significantly different (p < 0.05)
values for the same hydrolysate and different methods.
For all the hydrolysates (H6 to H10), the DH results obtained by the soluble protein content method were superior to those found for the other three methods, except for H10, where no significant difference was observed with the formol titration results (Fig. 2). As the A. oryzae
protease (FlavourzymeTM) has endo- and
exopeptidase activities, its action might have released considerable amounts of soluble small peptides, which would have reduced the Folin-Ciocalteau reagent (Zaia et al. 1998), resulting in higher DH values obtained by the soluble protein content method. The lower DH results obtained with the A. oryzae protease by the soluble protein
content method compared to pancreatin could be explained by the predominant activity of the exopeptidase of the A. oryzae protease
(FlavourzymeTM) (Smyth and FitzGerald 1998;
Briczinski and Roberts 2002) as well as its lower activity (0.69 U mL-1). Furthermore, the action of
the A. oryzae protease might have resulted in less
protein breakdown than pancreatin, leading to a reduced amino acid content in the supernatant and, consequently, the inferior degree of hydrolysis measured by this method.
After the soluble protein content method, the method that produced the highest DH values with
the A.oryzae protease was formol titration, whose
results were only inferior to that obtained for H6 by the OPA method (Fig. 2). The use of formol titration for assessing the degree of hydrolysis is based on the fact that the reaction of the sample with formaldehyde releases a proton (H+) from the
free amino group that can be titrated with an alkaline solution. Thereafter, the amount of alkali added, after subtraction of the blank value, is considered to be equivalent to the amount of α -amino groups present in the protein solution (Denis et al. 2008). However, the release of certain amino acids with titrated side chains and the buffering capacity of the amino groups might interfere with this titration (Levy 1935). Although the low activity of the A. oryzae protease could
have led to a lower cleavage of the protein molecule and resulted in a lower amino acid content in the supernatant, according to Margot et al. (1994), large peptides that were eventually released, showed no buffering capacity because the amino groups found in their peptide bonds did not accept protons. Thus, the number of amino groups released by the action of the A. oryzae
protons that were released. This could partially explain the results found in the current study when this method was used to determine the degree of WPC hydrolysis.
As in the case of pancreatin, the lowest values of DH were found when osmometry was used to evaluate this parameter. Considering the low enzymatic activity of the A. oryzae protease, the
action of this enzyme could have caused in a less protein breakdown, resulting in significant production of large peptides having a higher capacity for aggregation and gel formation (Otte et al. 1996). This would change the viscosity of the samples, thus reducing the DH measured by osmometry. There are no reports in the literature using soluble protein content, OPA, osmometry or formaldehyde to assess the degree of A. oryzae
protease-mediated hydrolysis of WPC.
Influence of reaction time on the degree of hydrolysis
The effect of the reaction time on the DH is shown in Figure 1. For pancreatin, reaction time had no influence on the DH obtained by the soluble protein content, OPA and osmometry methods. The only change in the DH due to reaction time was observed for the formaldehyde method at the beginning of the reaction. A sharp increase (44.5%) was found when the reaction time increased from 1 h (17.20%) to 2 h (24.86%). From this point forward, no significant differences were observed for up to 5 h of reaction time. These results indicated that the formaldehyde method was the most suitable among the tested methods for assessing the DH of WPC hydrolysates obtained by the action of a pancreatin, with the caveat that hydrolysis proceeded for a maximum of 2 h.
In the case of the A. oryzae protease, the effect of
the reaction time on the extent of WPC hydrolysis was somewhat more evident than for pancreatin (Fig. 2). The reaction time changed the DH not only measured by the formaldehyde method, but also when soluble protein content and OPA methods were used. When the reaction time was increased from 1 h to 2 h, there was a small increase in the DH, as measured by the soluble protein content (from 26.46 to 29.96%) and OPA (from 18.83 to 19.91%). For the formaldehyde method, the influence of the reaction time on the DH was higher and longer because a significant increase in the DH occurred when the reaction
time increased from 1 h (15.14%) to 2 h (22.26%) and from 2 h to 3 h (26.50%).
The A. oryzae protease (FlavourzymeTM) has both
endo- and exopeptidase activities, with the latter being more predominant (Smyth and FitzGerald 1998; Briczinski and Roberts 2002). Thus, the gradual increase of the DH measured by formol titration could be related to the gradual release of amino acids, whose pKa values were different when they were in the free form vs. the peptide form. This results in alterations of the reaction medium pH, thereby allowing the titration of the side chains of certain amino acids, as well as the reaction of free α-amino groups with formaldehyde (Levy 1935; Taylor 1957).
Taking into account the more pronounced variation of the DH results with the reaction time found for the formol titration compared to the other methods, this method could be considered to be the most suitable for the evaluation of the DH of WPC hydrolysates obtained by the action of an
A. oryzae protease, as shown for pancreatin. Only
one report was found in the literature addressing the evaluation of the DH of WPC hydrolysates obtained by an A. oryzae protease. In contrast to
the current work, Smyth and FitzGerald (1998), using different hydrolytic conditions (pH 8, 37 ºC, E:S ratio 1:50), found a significant variation between the DH obtained after 30 min (7.1%) and that was obtained after 8 h (24.3%) of reaction using the OPA method.
Correlation among the methods for evaluating the degree of hydrolysis
Table 1 shows the occurrence of a positive and significant correlation of strong intensity in three cases for pancreatin (formaldehyde with OPA, formaldehyde with osmometry and OPA with osmometry) and in only one case for the A. oryzae
protease (OPA with soluble protein content), according to the values established by Sampaio (2002), i.e., r > 0.7 and p < 0.05. There were no
prior reports in the literature in which a correlation was evaluated among the same methods employed in this study to determine the DH of WPC hydrolysates obtained by the action of pancreatin
and A. oryzae protease.
Peptide profile of WPC protein hydrolysates
lower than 1,000 Da. The hydrolysates were resolved in four fractions: F1 - large peptides, with more than seven amino acids residues; F2 - medium peptides, with four to seven amino acids residues; F3 - di- and tripeptides and F4 - free amino acids. This result agreed with previous studies using the same technique for fractionating the enzymatic hydrolysates obtained from several
protein sources and varied hydrolytic conditions. Specifically, studies with casein (Morais et al. 2005), skim milk (Soares et al. 2007), whey (Silva et al. 2007; Souza et al. 2008), rice (Lopes et al. 2008) and wheat flour (Carreira et al. 2011) could be highlighted.
Significant variations in the peptide profiles of the different hydrolysates are shown in Table 2.
Table 1 - Correlation among the methods for the evaluation of the degree of hydrolysis.
Comparisons Pancreatin Aspergillus oryzae protease
ra pb ra pb
Formaldehyde with OPAc 0.9616 0.0090 0.8461 0.0707
Formaldehyde with Osmometry 0.8784 0.0493 0.3022 0.6211
Formaldehyde with Soluble Protein -0.3337 0.5831 0.7180 0.1719
OPAc with Osmometry 0.9515 0.0127 0.6582 0.2271
OPAc with Soluble Protein -0.3552 0.5575 0.9596 0.0097
Osmometry with Soluble Protein -0.5659 0.3199 0.5921 0.2927
ar: correlation; b
p: determined by t-Student test with significant differences for p < 0.05; cOPA: orthophthalaldehyde
Table 2 - Peptide and free amino acid content in chromatographic fractions of WPC hydrolysates.
Hydrolysates Reaction time (h) F1
a
F2b F3c F4d
Pancreatin
H1 1 56.69 ± 1.94C 35.63 ± 2.03B 4.22 ± 0.23D 3.46 ± 0.34D
H2 2 45.54 ± 0.58D 42.02 ± 0.63A 6.43 ± 0.70B 6.01 ± 0.84B
H3 3 42.43 ± 2.82DE 44.65 ± 2.00A 9.07 ± 0.70A 3.85 ± 0.15CD
H4 4 41.33 ± 4.83E 43.57 ± 4.79A 7.12 ± 0.73B 7.98 ± 0.63A
H5 5 41.13 ± 2.56E 44.18 ± 3.41A 6.46 ± 0.15B 8.22 ± 1.08A
Aspergillus oryzae protease
H6 1 81.35 ± 1.42A 14.57 ± 1.65E 0.21 ± 0.02F 3.87 ± 0.28CD
H7 2 70.55 ± 1.27B 23.40 ± 1.93C 2.79 ± 0.45E 3.26 ± 0.51D
H8 3 72.10 ± 0.41B 20.52 ± 0.74CD 3.14 ± 0.11E 4.23 ± 0.42CD
H9 4 72.23 ± 1.75B 21.10 ± 1.15C 2.62 ± 0.10E 4.05 ± 0.57CD
H10 5 72.73 ± 1.46B 16.74 ± 2.03DE 5.66 ± 0.42C 4.87 ± 0.49C
Values are in % of nmol of the four fractions and represent the means of triplicate ± standard error. Different numbers represent significantly different (p<0.05) values for different fractions of the same hydrolysate. aF1: large peptides (> 7 amino acid residues); bF2:
medium peptides (4 to 7 amino acid residues); cF3: di- and tripeptides; dF4: free amino acids. Different letters (A, B, C...) represent
significantly different (p < 0.05) values for the same fraction of different hydrolysates.
Aiming at choosing the most appropriate hydrolysates for the development of nutritional supplements for clinical use,previous studies were considered. During protein metabolism, the first stage of hydrolysis leads to the formation of free amino acids (AA) and small peptides (2-6 AA residues), which can be further hydrolyzed by brush border peptidases to produce AA and di- and tripeptides (Hinsberger and Sandhu 2004). The amino acids can be absorbed either in the free form, by simple and facilitated diffusion (membrane transporters), or in the di- and tripeptide form (oligopeptide transporters) (Gilbert et al. 2008). Furthermore, according to Frenhani and Burini (1999), the di- and tripeptides are more
efficiently absorbed than is an equivalent mixture of free amino acids.
From a nutritional point of view, hydrolysates H3, H4 and H5, prepared using pancreatin, showed the best peptide profiles. Hydrolysate H3 had a higher di- and tripeptide content, whereas H4 and H5 had higher amount of free amino acids. The quantity of large peptides was similar for these three hydrolysates.
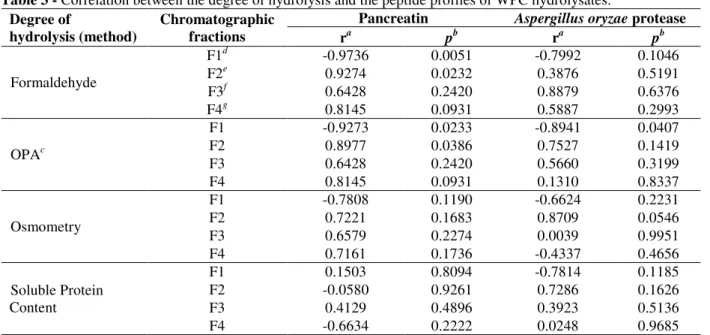
Correlation between the peptide profile and the degree of hydrolysis
A significant correlation (p < 0.05) between the
Table 3 - Correlation between the degree of hydrolysis and the peptide profiles of WPC hydrolysates. Degree of
hydrolysis (method)
Chromatographic fractions
Pancreatin Aspergillus oryzae protease
ra pb ra pb
Formaldehyde
F1d -0.9736 0.0051 -0.7992 0.1046
F2e 0.9274 0.0232 0.3876 0.5191
F3f 0.6428 0.2420 0.8879 0.6376
F4g 0.8145 0.0931 0.5887 0.2993
OPAc
F1 -0.9273 0.0233 -0.8941 0.0407
F2 0.8977 0.0386 0.7527 0.1419
F3 0.6428 0.2420 0.5660 0.3199
F4 0.8145 0.0931 0.1310 0.8337
Osmometry
F1 -0.7808 0.1190 -0.6624 0.2231
F2 0.7221 0.1683 0.8709 0.0546
F3 0.6579 0.2274 0.0039 0.9951
F4 0.7161 0.1736 -0.4337 0.4656
Soluble Protein Content
F1 0.1503 0.8094 -0.7814 0.1185
F2 -0.0580 0.9261 0.7286 0.1626
F3 0.4129 0.4896 0.3923 0.5136
F4 -0.6634 0.2222 0.0248 0.9685
ar: correlation; b
p: determined by t-Student test with significant differences for p < 0.05; cOPA: orthophthalaldehyde; dF1: large peptides
(> 7 amino acid residues); eF2: medium peptides (4 to 7 amino acid residues); fF3: di- and tripeptides; gF4: free amino acids.
However, the intensity of the correlation (r) varied
depending on the type of the method used for determining the DH as well as the type of enzyme used in the WPC hydrolysis. According to Sampaio (2002), r values higher than 0.7 with p <
0.05 indicated a strong association between the data.
With regard to pancreatin, a strong positive correlation was observed between the content of medium peptides (F2) and the DH obtained by formaldehyde and OPA. Additionally, a strong negative correlation with the content of large peptides (F1) was found for these two methods. In the case of the A. oryzae protease, only a strong
negative correlation was observed between the concentration of large peptides (F1) and the DH for the OPA method. As expected, these results indicated that, in some cases, an increase in the hydrolysis time of WPC proteins produced more small peptides and less large peptides. Among the fractions where a strong correlation with the DH was detected, F1 was a nutritional value parameter for protein hydrolysates. Therefore, for pancreatin, it was inferred that formaldehyde and OPA could be used as rapid screening methods for the preparation of nutritional formulas, especially the former method, which showed the highest r value (-0.9736). For the A. oryzae protease, only the
OPA method could be used for this purpose. No report was found in the literature correlating the DH of WPC hydrolysates and the peptide profile.
CONCLUSIONS
The hydrolytic conditions tested in the current study yielded WPC hydrolysates with varying degrees of hydrolysis. The best results were found using the soluble protein content method. However, the most accentuated differences in the DH and the reaction time were obtained by the formaldehyde method for both the enzymes (pancreatin and A. oryzae protease). With regard to
the peptide profile, the best results were obtained by the action of pancreatin, and this enzyme produced three hydrolysates (H3, H4 and H5) with similar peptide profiles. Moreover, in some cases, there was a significant correlation between the degree of hydrolysis and the large peptide content.
ACKNOWLEDGMENTS
The authors thank CNPq, CAPES and FAPEMIG for their financial support.
REFERENCES
Adler-Nissen J. Enzymic hydrolysis of food proteins.
New York: Elsevier Applied Science Publishers; 1986.
AOAC - Association of Official Analytical Chemists.
Official Methods of Analysis, 16th ed., Arlington:
Ayres M, Ayres Jr M, Ayres DL, Santos AAS.
BioEstat: aplicações estatísticas nas áreas das ciências biológicas e médicas. Belém: Sociedade
Civil Mamirauá - MCT-CNPq; 2007 [cited 2012 Mar 15]. Available from: http://www.mamiraua.org.br/ downloads/programas.
Benítez R, Ibarz A, Pagan J. Hidrolizados de proteína: procesos y aplicaciones. Acta Bioquím Clín Latinoam. 2008; 42: 227-236.
Brans G, Schroën CGPH, van der Sman RGM, Boom RM. Membrane fractionation of milk: state of the art and challenges. J Memb Sci. 2004; 243: 263-272.
Briczinski EP, Roberts RF. Production of an exopolysaccharide-containing whey protein concentrate by fermentation of whey. J Dairy Sci.
2002; 85: 3189-3197.
Carrasco CA, Guerra M. Lactosuero como fuente de péptidos bioactivos. An Venez Nutr. 2010; 23: 42-49.
Carreira RL, Ornellas CBD, Morais HA, Da Motta S, Silvestre MPC. Efeito da precipitação pelo ácido tricloroacético (TCA) e da ultrafiltração sobre o perfil peptídico de hidrolisados de caseína. Cienc Agrotec.
2003; 27: 414-421.
Carreira RL, Silva VDM, Lima LG, Morais HA, Silvestre MPC Perfil peptídico de hidrolisados proteicos da farinha de trigo. Pesq Agropec Trop.
2011; 41: 481-489.
Cheison SC, Zhang, SB, Wang Z, Xu SY. Comparison of a modified spectrophotometric and the pH-stat methods for determination of the degree of hydrolysis of whey proteins hydrolysed in a tangential-flow filter membrane reactor. Food Res Int. 2009; 42:
91-97.
Church FC, Swaisgood HE, Porter DH, Catignani GH. Spectrophotometric assay using o-phthaldialdehyde for determination of proteolysis in milk and isolated milk proteins. J Dairy Sci. 1983; 66: 1219-1227.
Denis A, Brambati N, Dessauvages B, Guedj S, Ridoux C, Meffre N, et al. Molecular weight determination of hydrolyzed collagen. Food Hydroc. 2008; 22:
989-994.
Doucet D, Otter DE, Gauthier SF, Foegeding EA. Enzyme-induced gelation of extensively hydrolyzed whey proteins by Alcalase: peptide identification and determination of enzyme specificity. J Agric Food Chem. 2003; 51: 6300-6308.
Ferreira DF. SISVAR version 5.3 (build 75). Lavras:
DEX/UFLA; 2010.
Frenhani PB, Burini RC. Mecanismos de absorção de aminoácidos e oligopeptídeos: controle e implicações na dietoterapia humana. Arq Gastroent. 1999; 36:
227-237.
Gilbert ER, Wong EA, Webb Jr KE. Peptide absorption and utilization: implications for animal nutrition and health. J Animal Sci. 2008; 86: 1493-1501.
Gupta R, Beg QK, Lorenz P. Bacterial alkaline proteases: molecular approaches and industrial applications. Appl Microbiol Biotechnol. 2002; 59:
15-32.
Hartree EF. Determination of protein: a modification of the Lowry method that gives a linear photometric response. Anal Biochem. 1972; 48: 422-427.
Hinsberger A, Sandhu BK. Digestion and absorption.
Curr Paediatrics 2004; 14: 605-611.
Hoyle NT, Merritt JH. Quality of fish protein hydrolysates from herring (Clupea harengus). J Food Sci. 1994; 59: 76-79.
Levy M. Equilibria of the basic amino acids in the formol titration. J Biol Chem. 1935; 109: 365-381.
Lopes DCF, Bizzotto CS, Carreira RL, Afonso WO, Lopes Jr CO, Silvestre MPC. Removal of phenylalanine from protein hydrolysates prepared with rice. J Food Technol. 2008; 6: 57-65.
Lowry OH, Rosebrough NJ, Farr AL, Randall RJ. Protein measurement with the Folin phenol reagent. J Biol Chem. 1951; 193: 265-275.
Madureira AR, Pereira CI, Gomes AMP, Pintado ME, Malcata FX. Bovine whey proteins: overview on their main biological properties. Food Res Int. 2007; 40:
1197-1211.
Margot A, Flaschel E, Renken A. Continuous monitoring of enzymatic whey protein hydrolysis. correlation of base consumption with soluble nitrogen content. Process Biochem. 1994; 29: 257-262.
Morais HA, De Marco LM, Oliveira MC, Silvestre MPC. Casein hydrolysates using papain: peptide profile and encapsulation in liposomes. Acta Alimentaria 2005; 34: 59-69.
NC-IUBMB - Nomenclature Committee of the International Union of Biochemistry and Molecular Biology. Enzyme Nomenclature: recommendations of the Nomenclature Committee of the International Union of Biochemistry and Molecular Biology on the nomenclature and classification of enzymes by the reactions they catalyse. Londres: School of
Biological and Chemical Sciences, Queen Mary University; 2010 [cited 2012 Feb 20]. Available from: http://www.chem.qmul.ac.uk/iubmb/enzyme. Nielsen PD, Petersen D, Dambmann C. Improved
method for determining food protein degree of hydrolysis. J Food Sci. 2001; 66: 642-646.
Otte J, Ju ZY, Skriver A, Qvist KB. Effect of limited proteolysis on the microestructure of heat-induced whey proteins. Int Dairy J. 1996; 79: 782-790.
Pacheco MTB, Sgarbieri VC. Effect of different hydrolysates of whey protein on hepatic glutathione content in mice. J Med Food. 2005; 8: 337-342.
Page MJ, Di Cera E. Serine peptidases: classification, structure and function. Cell Mol Life Sci. 2008; 65:
Pimentel-Gomes F. Curso de estatística experimental.
14th ed. Piracicaba: Nobel; 2000.
Rawlings ND, Barrett AJ, Bateman A. MEROPS: the peptidase database. Nucleic Acids Res. 2010; 38:
D227-D233.
Roth M. Fluorescence reaction for amino acids. Anal Chem. 1971; 43: 880-882.
Rutherford SM. Methodology for determining degree of hydrolysis of proteins in hydrolysates: a review. J AOAC Int. 2010; 93: 1515-1522.
Sampaio IBM. Estatística aplicada à experimentação animal. 2rd ed. Belo Horizonte: FEPMVZ; 2002.
Silva VDM, Marco LM, Afonso WO, Lopes DCF, Januário JN, Aguiar MJB, et al. Preparation of low-phenylalanine whey hydrolysates using papain and pancreatin immobilized on activated carbon and alumina. Am J Food Technol. 2007; 2: 327-341.
Silvestre MPC, Hamon M, Yvon M. Analyses of protein hydrolysates. 1. Use of poly (2-hydroxyethyl-aspartamide)-silica column in size-exclusion chromatography for the fractionation of casein hydrolysates. J Agric Food Chem. 1994a; 42:
2778-2782.
Silvestre MPC, Hamon M, Yvon M. Analyses of protein hydrolysates. 2. Characterization of casein hydrolysates by a rapid peptide quantification method. J Agric Food Chem. 1994b; 42: 2783-2789.
Silvestre MPC. Review of methods for the analysis of protein hydrolysates. Food Chem. 1997; 60: 263-271.
Smyth M, FitzGerald RJ. Relationship between some characteristics of WPC hydrolysates and the enzyme complement in commercially available proteinase preparations. Int Dairy J. 1998; 8: 819-827.
Soares RDL, Capobiango MB, Rolim EA, Silvestre MPC. Enzyme-catalyzed production of oligopeptides from skim milk. Food Biotech. 2007; 21: 45-56.
Souza MWS, Biasutti EAR, Carreira RL, Afonso WO, Silva VDM, Silvestre MPC. Obtaining oligopeptides from whey: use of subtilisin and pancreatin. Am J Food Technol. 2008; 3: 315-324.
Spellman D, McEvoy E, O´Cuinn G, Fitzgerald RJ. Proteinase and exopeptidase hydrolysis of whey protein: comparasion of the TNBS, OPA e pH-stat method for quantification of degree of hydrolysis. Int Dairy J. 2003; 13: 447-453.
Taylor SH. Formol titration: an evaluation of its various modifications. Analyst 1957; 82: 488-498.
Wong TM, Boyce COL. Monitoring Proteolysis by Osmometry: A Rapid Method. In: Cherry JP, Barford
RA, editors. Methods for protein analysis.
Champaign: American Oil Chemists Society; 1988. p. 42-51.
Zaia DAM, Zaia CTBV, Lichti J. Determinação de proteínas totais via espectrofotometria: vantagens e desvantagens dos métodos existentes. Quím Nova
1998; 21: 787-793.