Genetic control of traits related to phosphorus use efficiency in
tropical maize
Flávia Ferreira Mendes1, Lauro José Moreira Guimarães2, Cláudia Teixeira Guimarães2, João Cândido Souza3, Paulo Evaristo Oliveira Guimarães2 and Sidney Netto Parentoni2*
Received 1 August 2013
Accepted 7 November 2014
Abstract – Abstract – Knowing the inheritance of traits is essential to establish selection strategies in breeding programs. The aim of this study was to determine the genetic control of traits related to the phosphorus use efficiency in maize. A total of 280 progenies were developed according to design III, which were evaluated in the field under high and low phosphorus (P) availability. The genetic variance components were estimated for the agronomic traits and indices that define P use efficiency. The results indicated that the additive and dominance effects were important in explaining the genetic variability for the flowering time, grain yield and P efficiency indices. However, dominance effects prevailed, indicating that breeding efforts should be made to develop hybrids exploiting the heterosis for traits related to P use efficiency.
Key words: Abiotic stress, P acquisition efficiency, design III. Crop Breeding and Applied Biotechnology 15: 59-65, 2015 Brazilian Society of Plant Breeding. Printed in Brazil
ARTICLE
http://dx.doi.org/10.1590/1984-70332015v15n2a12
1 CNPq/Embrapa Milho e Sorgo
2 Embrapa Milho e Sorgo, MG 424, km 45, 35.701-970, Sete Lagoas, MG, Brazil. *E-mail: [email protected] 3 Universidade Federal de Lavras, Departamento de Biologia, CP 37, 37.200-000, Lavras, MG, Brazil
INTRODUCTION
Maize is currently the most cultivated cereal in the world. In the last decade, the world production of this cereal increased by approximately 40%, to about 1 billion tons in the 2013 growing season (FAOSTAT 2015). Despite the
significant increase in production, there are still areas with
low yield potential, especially in tropical regions, where most soils have a high phosphorus (P) adsorption capacity.
The P deficiency of the soils is a major limiting factor of
agricultural production in several countries. Phosphorus use
efficiency is one of the areas of long term public research
commitment in maize breeding in Brazil, with research efforts been more recently focused on innovation assets instead of direct cultivar development (Parentoni et al. 2013). Due to the high costs of P fertilizers, along with the fact that this resource is non-renewable, research aiming to develop plants
more efficient in P use will become increasingly important
for agriculture in the coming years.
Understanding the genetic control of P use efficiency
is highly strategic for a successful breeding program. Information about the gene action is useful to choose the most appropriate breeding strategies. Studies based on the
generation means indicated that dominance effects were
more important for P use efficiency in maize than additive
effects (Parentoni and Souza Júnior 2008, Parentoni et al. 2010). However, scarce results have been published for
maize under tropical field conditions, using efficiency in -dices based on grain yield. Furthermore, several procedures described in literature can be used to estimate the additive variance, dominance and mean degree of dominance for the traits of interest. A few of the best of these methods are the evaluation of inbred lines, Mather (1949)’ method, diallel crosses, and the use of segregating progenies and the genetic designs I, II and III of Comstock and Robinson (1952). The different methods were described in detail by Hallauer et al. (2010).
Among these methods, the design III of Comstock and Robinson (1952) has the advantage of estimating additive and dominance genetic variances with the same accuracy. In design III, plants of the F2 generation, derived from a cross between two contrasting lines, are backcrossed with their parental lines. Thereafter, backcrossed progenies are evaluated for the traits of interest. Based on the mathematical expectations of mean squares of the analysis of variance, the additive (σˆ 2
estimated. However, Comstock and Robinson (1952) pointed out that in the case of linkage disequilibrium, the variance estimates may be biased. A strategy that can minimize this problem would be to advance the inbreeding of the F2 prog-enies, leading to the breakage of the linkage blocks. The effect of linkage disequilibrium on estimates of genetic variance components of agronomic traits in maize was analyzed in several studies (Gardner and Lonnquist 1959, Moll et al.
1964, Moreno-Gonzales et al. 1975, Dudley 1994). Briefly,
these papers estimate the variance components in F2
popula-tions and advanced selfing generapopula-tions, confirming that the
estimates of the mean degree of dominance decreased with the increase of inbreeding. Thus, it is expected that the use of recombinant inbred lines (RILs) in design III provides more accurate estimates of the mean degree of dominance than the use of F2 progenies.
This study aimed to estimate the additive and dominance genetic variances, and mean degree of dominance of traits
related to phosphorus use efficiency in tropical maize.
MATERIAL AND METHODS
Plant material
One hundred and forty recombinant inbred lines (RILs) of maize were used in the F7 generation, backcrossed with the parental lines L3 and L22, in design III of Comstock and Robinson (1952), resulting in a total of 280 progenies.
The parental lines (L3 and L22), as well as the RIL popu-lation were developed by the breeding program of Embrapa
Maize and Sorghum. The lines L3 and L22 were classified as efficient and inefficient in terms of P use, respectively
(Parentoni et al. 2010). These lines are contrasting in grain yield, early maturity, plant development (Parentoni and Souza Júnior 2008, Parentoni et al. 2010), and root morphology traits (Brasil et al. 2007, De Sousa et al. 2012).
Experimental design
The 280 families were evaluated in two contrasting en-vironments, with low and high phosphorus (P) availability
in the soil. The progenies were divided in five experiments
arranged in a rectangular 7x8 lattice design with three replicates. Each experiment was composed of 28 RILs backcrossed with both parents with a total of 56 progenies per lattice, with plots consisting of 4-m long rows spaced 80 cm apart. The experiments were evaluated in the growing season 2010/2011 at the experimental station of Embrapa Maize and Sorghum, in Sete Lagoas, MG.
At sowing, 400 kg ha-1 of NPK (8-28-16) fertilizer
mixture (i.e., 32 kg ha-1 of N, 112 kg ha-1 of P
2O5 and 64 kg
ha-1 of K
2O) were applied to the soil in high-P environment.
In the low-P environment, 150 kg ha-1 of NPK (20-00-20)
along with 60 kg ha-1 potassium chloride (30 kg ha-1 of N
and 64 kg ha-1 of K
2O) were used. Additionally, 30 d after
planting, the soil was further supplemented with 90 kg ha-1
of N, supplied as urea in both environments.
The total P available in the soil of each environment was calculated as the amount of P in the 0-60 cm soil layer, determined by chemical analysis, plus the P amount sup-plied by fertilization. The other crop practices were apsup-plied according to regional recommendations for maize. Supple-mental irrigation was applied in the plots when necessary to prevent water stress.
Phenotypic traits
The traits evaluated in all experiments were days to
male flowering (MF) and female flowering (FF), anther-silk
interval (ASI) and grain yield (GY), computed by weighing
the grains per plot, adjusting the weight to a standard 13 %
grain moisture and then transformed into kg ha-1.
In the low-P environment, shoot sample (including
leaves, stalk and husks) from five representative plants
per plot and grain samples were collected. Grain and shoot samples were weighed after drying to constant weight in a forced-air oven at 65 °C, to determine the dry weight.
Sub-sequently, the samples were ground, blended, and subjected to nitric perchloric acid digestion following P quantification
with inductively coupled argon plasma (ICP) emission spectrometry (Silva 2009). The P content in the grain (Pg) or in the shoot (Ps) was calculated by multiplying grain or shoot dry weight, respectively, by the P concentration in the corresponding plant component. The total P content in the plant (Pt) was calculated as Pt = Pg + Ps. Based on these
components, we calculated The P use efficiency (PUE)
index for each plot according to Moll et al. (1981), using the formula PUE = PAE × IPUE, where IPUE (internal P
use efficiency) calculate by GY / Pt and PAE (P acquisition
efficiency), calculated by Pt / Psoil.
Statistical analysis
Individual analyses of variance for all traits were per-formed by the model proposed by Comstock and Robinson (1952): yijklw = m + bk(lw) + rl(w) + sw + gi(w) + pj(w) + gpij(w)
+ ēijklw, where: yijklw is the observation on progeny i
back-crossed with parental line j in block k in the replication l
is the inbred parents effect in trial w (j = 1, 2); gpij(w) is the parent and progeny interaction effect; in trial w; ēijklw is the experimental error.
For these analyses, all sources of variation were consid-ered random, except for the general mean and for parental lines. From the expected mean squares of the analyses of variance we estimated the components of additive genetic variance (σˆ 2
A) and dominance (σˆ 2D), as proposed by Comstock and Robinson (1952), and the mean degree of dominance
was determined by 2
2
ˆ ˆ 2 ˆ
A
D
d =
σ
σ
.The experimental precision was evaluated by the se-lective accuracy estimated for each trait, by the following
estimator:
F
r
gg1
1
ˆ
ˆ=
−
, in which rˆgˆg is the selectiveac-curacy (Resende 2007) and F the value of the F test, of the analysis of variance, for the progeny effect. The accuracy,
according to Resende and Duarte (2007), can be classified
as very high (rˆgˆg≥ 0.90), high (0.70 ≤ rˆgˆg≤ 0.90), moderate (0.50 ≤ rˆgˆg ≤ 0.70), and low (rˆgˆg ≤0.50).
The relative importance of P acquisition efficiency (PAE) and internal P use efficiency (IPUE) for P use efficiency
(PUE) were determined according to Moll et al. (1981), described by Parentoni and Souza Júnior (2008). The
in-dices of efficiency were log-transformed and the variables
determined for each plot: Y = LogPUE; X1 = LogPAE; and
X2 = LogIPUE. Thereafter, the y variables x1 and x2 were
determined, which are defined, respectively, as deviations
from the means of Y, X1 and X2.
The relative importance of each index for use efficiency
was obtained by the following expressions: EPAE / EPUE =
rx1y × sx1
/
sy; and EIPUE / EPUE = rx2y × sx2/
sy, where: rx1y is thecorrelation coefficient between variables x1 and y; rx2y the
coefficient of correlation between variables x2 and y; Sy the standard deviation of variable y; Sx1 the standard deviation of variable x1; and Sx2 the standard deviation of variable x2.
RESULTS AND DISCUSSION
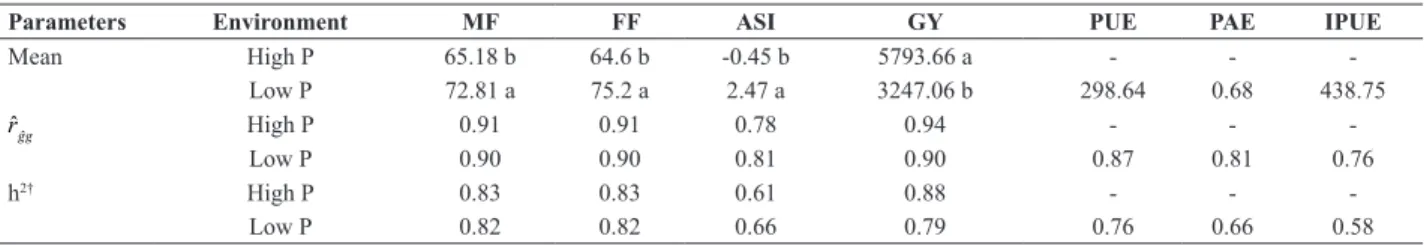
Selective accuracy estimates (rˆgˆg) for the agronomic
traits and P efficiency indices in low and high P environ -ments varied between 0.94 and 0.76 (Table 1), indicating high to very high experimental precision, according to the
classification of Resende (2007). Additionally, the heritabil -ity estimates (h2) ranged from 0.58 to 0.88, suggesting that
most of the phenotypic variability among the progenies was due to genetic causes in both environments.
Significant differences (p < 0.01) were observed between
environments in the analysis of variance for flowering time
and grain yield (data not shown). In the low-P environment, grain yield was reduced by 44% compared to the mean of
the high-P environment (Table 1). Under P deficiency, the
cycle of the progenies were extended, with an average delay
of 11 days in female flowering and 8 days in male flowering
(Table 1). Furthermore, the mean value for ASI under low P was approximately six times higher than in the high-P
soil (-0.45 and 2.47 days, respectively), These confirming the stress condition caused by P deficiency. Increases in
ASI have been associated with increased susceptibility to various stresses, such as drought (Ziyomo and Bernardo
2013), nitrogen deficiency (Lafitte and Edmeades 1994), and phosphorus deficiency (Parentoni and Souza Júnior 2008).
These authors reported that, under stress conditions, the
female flowering occurs after the male flowering, causing
a lack of pollen during the period of style-stigma emission and an increase in the percentage of grain abortion after pollination. Bolanos and Edmeades (1993) reported that for each day of increase in ASI, the grain yield of maize grown under drought stress was reduced by 8.7%, on average.
In this study, design III was applied to 140 RILs backcrossed with the two parental lines, which presented
significant effect (p < 0.01) for parents in the analysis of
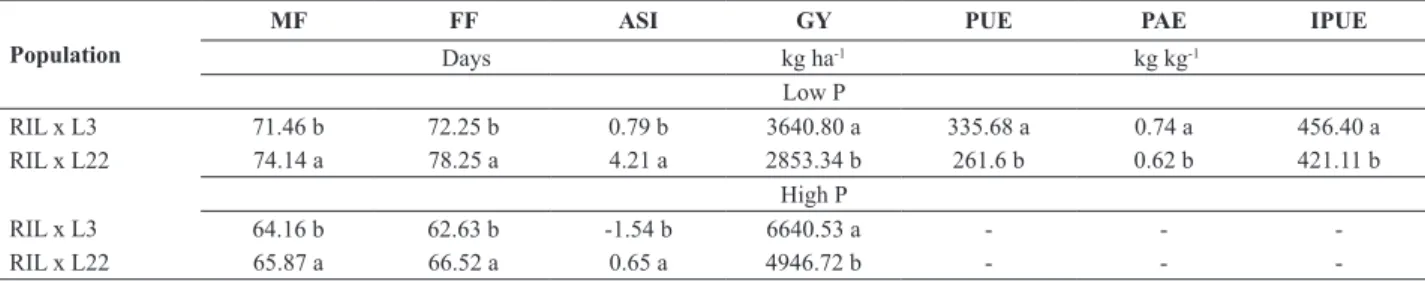
variance for agronomic traits and P efficiency indices (data not shown). Under P deficiency, the means for flowering
traits were superior in the progenies backcrossed with L22 (Table 2), with a delay of approximately three days to male
Table 1. Overall means for environments, selective accuracy (rˆgˆg) and heritability (h2) to male flowering (MF), female flowering (FF), anther-silk interval
(ASI), grain yield (GY), P-use efficiency (PUE), P acquisition efficiency (PAE) and internal P use efficiency (IPUE), evaluated in maize progenies
arranged in Design III, grown in environments with high and low soil-availability of P
Parameters Environment MF FF ASI GY PUE PAE IPUE
Mean High P 65.18 b 64.6 b -0.45 b 5793.66 a - -
-Low P 72.81 a 75.2 a 2.47 a 3247.06 b 298.64 0.68 438.75
rˆgˆg High P 0.91 0.91 0.78 0.94 - -
-Low P 0.90 0.90 0.81 0.90 0.87 0.81 0.76
h2† High P 0.83 0.83 0.61 0.88 - -
-Low P 0.82 0.82 0.66 0.79 0.76 0.66 0.58
flowering and six days to female flowering, compared to the
progenies backcrossed with L3. In the high-P environment,
the delay in female and male flowering of the progenies
backcrossed with L22 in relation to those backcrossed with L3 was about one and four days, respectively. Thus, L3 increased the earliness of the progenies, aside from a better
synchronization of male and female flowering under P stress,
as would be expected for a line previously characterized as
P-use efficient. The anthesis-silk interval for the progenies
backcrossed with L3 was 0.79 days, whereas the anthesis-silk
interval of the progenies backcrossed with the inefficient
parent (L22) was 4.21 days in low P soil (Table 2).
The P-use efficiency (PUE) is a function of the compo
-nents that assess the efficiency indices of P acquisition (PAE)
and internal utilization (IPUE). In this study, these indices were obtained only for the low-P environment, which were calculated based on grain yield. The phenotypic correlation between the grain yield means in both environments was 0.78, indicating a predominantly simple interaction and no
changes in the genotype classification in both environments.
The yield performance of the progenies backcrossed
with the efficient parent (L3) was 19.5% higher for PAE
and 8% for IPUE, compared to the progenies backcrossed
with the inefficient parent (L22), indicating a higher grain
production capacity per P unit in the plant and superior P concentration in the plant in the population backcrossed with L3 (Table 2). Additionally, the relative importance of PAE for PUE was 70.4%, while IPUE had a relative importance of 29.6% (Table 3). These values were close to those obtained by Parentoni and Souza Júnior (2008), which were 64.5% and 35.5%, for PAE and IPUE, respectively. According to Wang et al. (2010), the contribution of PAE
and IPUE for PUE varied according to the plant species and environmental conditions. However, PAE is almost twice as important as IPUE in the variability observed for PUE in maize under low P availability (Parentoni and Souza Júnior 2008). Therefore, breeding programs aiming to develop
maize cultivars with higher P use efficiency should focus more on the mechanisms related to the uptake efficiency
of this nutrient.
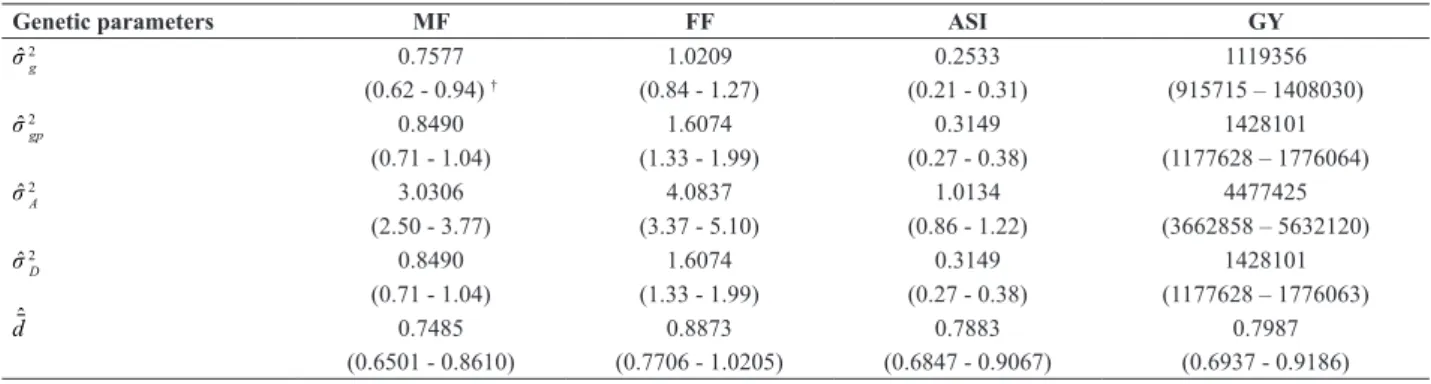
The existence of genetic variability among progenies was
confirmed by the estimates of genetic variance among RILs
(σˆ 2
g), in which the lower limits of the confidence interval were greater than zero (p ≤ 0.05). The estimates of additive (σˆ 2
A) and dominance (σˆ 2
D) genetic variances were also significant, indicating that both additive and dominance effects were
important to explain the genetic variability for flowering traits, grain yield and P efficiency indices (Tables 4 and 5).
The degrees of dominance estimates (d) were close to 1.00, indicating a predominance of dominance effects for P-use
efficiency and its components as well as for flowering and
grain yield (Table 4 and 5). Similar results were obtained by Parentoni and Souza Júnior (2008) and Parentoni et al. (2010) using mean and variance estimates for P-use
ef-ficiency traits under field conditions, confirming that the
dominance effects were more important than the additive effects for most traits. However, the design III of Comstock and Robinson (1952) for genetic control studies was more appropriate to estimate the additive and dominance vari-ances with the same accuracy. For maize, several authors who used design III in F2 or F2:3 populations, backcrossed to the respective parents to estimate variance components, reported that the degree of dominance estimates was over 1.00 for grain yield and its components (Cockerham and
Table 2. Means of male flowering (MF), female flowering (FF), anther-silk interval (ASI), grain yield (GY), P use efficiency (PUE), P acquisition
efficiency (PAE) and internal P use efficiency (IPUE), evaluated in two maize populations grown in environments with high and low soil P
Population
MF FF ASI GY PUE PAE IPUE
Days kg ha-1 kg kg-1
Low P
RIL x L3 71.46 b 72.25 b 0.79 b 3640.80 a 335.68 a 0.74 a 456.40 a
RIL x L22 74.14 a 78.25 a 4.21 a 2853.34 b 261.6 b 0.62 b 421.11 b
High P
RIL x L3 64.16 b 62.63 b -1.54 b 6640.53 a - -
-RIL x L22 65.87 a 66.52 a 0.65 a 4946.72 b - -
-Table 3. Relative importance of P acquisition efficiency and internal P use efficiency for P-use efficiency (PUE) in a low-P environment
Trait rxiy sxi/sy Relative importance for PUE(%)
P acquisition efficiency – PAE (x1) 0.89 0.791 70.4
Internal P use efficiency – IPUE (x2) 0.60 0.493 29.6
rxiy: phenotypic correlation between PAE, IPUE and PUE
Zeng 1996, Wolf et al. 2000, Lu et al. 2003). In this situ-ation, Comstock and Robinson (1952) emphasized that in the presence of linkage disequilibrium, estimates of additive variance and dominance may be biased. In the repulsion linkage phase, additive variance is underestimated, while variance due to dominance is overestimated, resulting in an estimated degree of dominance above 1.00, or over-dominance. As the genetic linkage effects are dissipated
through genetic recombination after selfing generations,
overdominance decreases and tends to disappear with the progress of inbreeding (Comstock and Robinson 1952). In this study, we used a RIL population backcrossed with the parents and possibly the estimates of degree of dominance (d) are free of overdominance, making them interesting for conclusions about the genetic control of grain yield and other agronomic traits.
A RIL population should represent the variability in a F2 for a target trait, so the greater the number of genes
controlling the trait, the greater should be the population
size to represent these loci. Phosphorus use efficiency is a
quantitative trait and is therefore controlled by several genes.
Mendes et al. (2014) mapped QTLs for P-use efficiency in
the same population used in this study and found that six QTLs were responsible for much of the phenotypic varia-tion in PUE. These six loci involved in genetic control of PUE would require a RIL population composed of at least 64 lines in the advanced inbreeding generations (26 = 64),
which is far below the number of 140 RILs currently used.
The predominance of complete dominance for P-use efficiency and its components as well as for flowering time and grain yield indicate that for breeding, these traits should be assessed preferably in crosses, not in lines per se. These data also indicate that efforts should be directed to develop hybrids in order to exploit heterosis for P-use
efficiency related traits.
Table 5. Estimates of variance components and degree of dominance (dˆ) for male flowering (MF), female flowering (FF), anther-silk interval (ASI)
and grain yield (GY), evaluated in maize progenies grown in environment with high P soil
Genetic parameters MF FF ASI GY
σˆ 2
g 0.7577 1.0209 0.2533 1119356
(0.62 - 0.94) † (0.84 - 1.27) (0.21 - 0.31) (915715 – 1408030)
σˆ 2
gp 0.8490 1.6074 0.3149 1428101
(0.71 - 1.04) (1.33 - 1.99) (0.27 - 0.38) (1177628 – 1776064)
σˆ 2
A 3.0306 4.0837 1.0134 4477425
(2.50 - 3.77) (3.37 - 5.10) (0.86 - 1.22) (3662858 – 5632120)
σˆ 2
D 0.8490 1.6074 0.3149 1428101
(0.71 - 1.04) (1.33 - 1.99) (0.27 - 0.38) (1177628 – 1776063)
dˆ 0.7485 0.8873 0.7883 0.7987
(0.6501 - 0.8610) (0.7706 - 1.0205) (0.6847 - 0.9067) (0.6937 - 0.9186)
σˆ 2
g: Genetic variance between progenies; σˆ
2
gp: variance of the interaction between progenies x parents; σˆ
2
A: additive genetic variance; σˆ 2D: dominance genetic variance.
† confidence interval at 95% probability (in parentheses).
Table 4. Estimates of variance components and mean degree of dominance (dˆ) for male flowering (MF), female flowering (FF), anther-silk interval
(ASI), grain yield (GY), P use efficient (PUE), P acquisition efficiency (PAE) and internal P use efficiency (IPUE) evaluated in maize progenies grown
in a low-P environment
Genetic
parameters MF FF ASI GY PUE PAE IPUE
σˆ 2
g 1.03 1.93 0.44 263146 2139.19 0.007 929.39
(0.85 - 1.28)† (1.59 - 2.39) (0.37 - 0.53) (218559 - 325731) (1783 - 2636) (0.006 - 0.008) (789 - 1114)
σˆ 2
gp 1.35 2.80 0.48 465599 3926.9 0.012 1238.46
(1.13 - 1.66) (2.32 - 3.43) (0.41 - 0.57) (388227 - 575102) (3276 - 4821) (0.009 - 0.014) (1061 - 1471)
σˆ 2
A 4.12 7.70 1.75 1052587 8556.78 0.026 3717.58
(3.41 - 5.12) (6.36 - 9.55) (1.47 - 2.12) (874236 - 1302927) (7133 - 10546) (0.022 - 0.032) (3158 - 4459)
σˆ 2
D 1.35 2.80 0.48 465599 3926.89 0.012 1238.46
(1.13 - 1.66) (2.32 - 3.43) (0.41 - 0.57) (388227 - 575102) (3276 - 4821) (0.009 - 0.014) (1061 - 1471)
dˆ 0.81 0.85 0.74 0.94 0.96 0.95 0.82
(0.70 - 0.93) (0.74 - 0.98) (0.64 - 0.85) (0.82 – 1.08) (0.84 - 1.10) (0.82 - 1.11) (0.71 - 0.92)
σˆ 2
g: Genetic variance among progenies; σˆ
2
gp: variance of the interaction between progenies x parents; σˆ
2
A: additive genetic variance; σˆ 2D: dominance genetic variance.
ACKNOWLEDGEMENTS
The authors are indebted to Embrapa Maize and Sorghum
for supporting research, the Brazilian Council for Scientific
and Technological Development (CNPq) for a scholarship and the Generation Challenge Program (GCP) for the partial
funding of the project.
Controle genético de características relacionadas à eficiência no uso de fósforo
em milho tropical
Resumo – Conhecer a herança de características utilizadas na seleção é fundamental para estabelecer estratégias de melhoramento. O objetivo desse trabalho foi determinar o controle genético de características relacionadas à eficiência no uso de fósforo em milho. Foram desenvolvidas 280 progênies segundo delineamento III, que foram avaliadas em ambientes com alta e baixa disponibilidade de fósforo (P). Os componentes de variância genética foram estimados para as características agronômicas e para os índices que compõem a eficiência de uso de P. Os efeitos aditivos e de dominância foram importantes para explicar a variabilidade genética para as características de florescimento, produtividade de grãos e para os índices de eficiência ao P. Contudo, houve predomínio dos efeitos de dominância, indicando que, do ponto de vista de melhoramento, esforços devem ser direcionados para obtenção de híbridos a fim de explorar a heterose para as características relacionadas à eficiência no uso de P.
Palavras-chave: Estresse abiótico, eficiência de aquisição de P, delineamento III.
REFERENCES
Brasil EC, Alves VMC, Marriel IE, Pitta GVE and Carvalho JG (2007) Matéria seca e acúmulo de nutrientes em genótipos de milho
contrastantes quanto à aquisição de fósforo. Ciência Agrotecnologia
31: 704-712.
Bolanos J and Edmeades GO (1993) Eight cycles of selection for drought tolerance in lowland tropical maize: II, responses in reproductive
behaviour. Field Crops Research 31: 253-268.
Cockerham CC and Zeng Z-B (1996) Design III with marker loci. Genetics
143: 1437-1456.
Comstock RE and Robinson HF (1952) Estimation of average dominance
of genes.In Gowen JW (Ed) Heterosis. Ames, Iowa, p. 494-516.
De Sousa SM, Randy T, Clark RT, Mendes FF, Oliveira AC, Kochian LV, Vasconcelos MJV, Parentoni SN, Guimarães CT and Magalhães JV (2012) A role for root morphology and related candidate genes in P
uptake efficiency in maize. Functional Plant Biology 39: 925-935.
Dudley JW (1994) Linkage disequilibrium in crosses between Illinois
maize lines divergently selected for protein percentage. Theoretical
and Applied Genetics87: 1016-1020.
Food and Agriculture Organization of the United Nations - FAOSTAT (2015) Available at <http:/faostat.fao.org> Accessed on Jan 26, 2015.
Gardner CO and Lonnquist JH (1959) Linkage and the degree of dominance of genes controlling quantitative characters in maize.
Agronomy Journal51: 524-528.
Hallauer AR, Carena MJ and Miranda Filho JB (2010) Quantitative
genetics in maize breeding. Springer, New York, 663p.
Lafitte HR and Edmeades GO (1994) Improvement for tolerance to low
soil nitrogen in tropical maize: I., selection criteria. Field Crops
Research39: 1-14.
Lu H, Romero-Severson J and Bernardo R (2003) Genetic basis of heterosis explored by simple sequence repeat markers in a random-mated maize
population. Theoretical Applied Genetics107: 494-502.
Mather K (1949) Genetical considerations in the utilisation of hybrid
vigour. Journal ofHeredity3: 125-126.
Mendes FF, Guimarães LJM, Souza JC, Guimarães PEO, Magalhães JV, Garcia AAF, Parentoni SN and Guimarães CT (2014) Genetic
architecture of phosphorus use efficiency in tropical maize cultivated
in a low-p soil. Crop Science 54: 1-9.
Moll RH, Kamprath EJ and Jackson WA (1981) Analysis and interpretation
of factors which contribute to efficiency of nitrogen use. Agronomy Journal74: 562-564.
Moll RH, Lindsey MF and Robinson HF (1964) Estimates of genetic
variances and level of dominance in maize. Genetics49: 411-423.
Moreno-Gonzalez J, Dudley JW and Lambert RJ (1975) A design III study
of linkage disequilibrium for percent oil in maize. Crop Science15:
840-843.
Parentoni SN and Souza Júnior CL (2008) Phosphorus uptake and internal
use efficiency in tropical maize genotypes. Pesquisa Agropecuária Brasileira 43: 893-901.
Parentoni SN, Souza Junior CL, Alves VMC, Gama EEG, Coelho AM, Oliveira AC, Guimarães CT, Vasconcelos MJV, Pacheco CAP, Meirelles WF, Magalhães JV, Guimarães LJM, Silva ARda, Mendes FF and Schaffert RE (2010) Inheritance and breeding strategies for
phosphorus efficiency in tropical maize (Zea mays L.). Maydica
1: 1-15.
Parentoni SN, De Miranda RA and Garcia JC (2013) Implications on the introduction of transgenics in Brazilian maize breeding programs.
Crop Breeding and Applied Biotechnology13: 9-22
Resende MDV (2007) Matemática e estatística na análise de
experimentos e no melhoramento genético. Embrapa Florestas, Colombo, 561p.
Resende MDV and Duarte JB (2007) Precisão e controle de qualidade
Tropical 37: 182-194.
Silva FC (2009) Manual de análises químicas de solos, plantas e
fertilizantes. Embrapa Informações Tecnológicas, Brasília, 627p.
Wang X, Shen J and Liao H (2010) Uptake or use, which is more critical
for enhancing phosphorus efficiency in modern crops. Plant Science
179: 302-306.
Wolf DP, Peternelli LA and Hallauer AR (2000) Estimates of genetic
variance in an F2 maize population. The Journal of Heredity 91:
384-391.