O R I G I N A L P A P E R
Teresa Santos-SilvaÆJose´ Trinca˜o
Ana Luı´sa CarvalhoÆCecı´lia Bonifa´cio
Franc¸oise Auche`re ÆPatrı´cia Raleiras
Isabel Moura ÆJose´ J. G. MouraÆ Maria Joa˜o Roma˜o
The first crystal structure of class III superoxide reductase
from
Treponema pallidum
Received: 2 November 2005 / Accepted: 20 March 2006 / Published online: 6 May 2006
SBIC 2006
AbstractSuperoxide reductase (SOR) is a metalloprotein containing a non-heme iron centre, responsible for the scavenging of superoxide radicals in the cell. The crystal structure of Treponema pallidum (Tp) SOR was deter-mined using soft X-rays and synchrotron radiation. Crystals of the oxidized form were obtained using poly(ethylene glycol) and MgCl2and diffracted beyond
1.55 A˚ resolution. The overall architecture is very simi-lar to that of other known SORs butTpSOR contains an N-terminal domain in which the desulforedoxin-type Fe centre, found in other SORs, is absent. This domain conserves the b-barrel topology with an overall arrangement very similar to that of other SOR proteins where the centre is present. The absence of the iron ion and its ligands, however, causes a decrease in the cohe-sion of the domain and some disorder is observed, particularly in the region where the metal would be harboured. The C-terminal domain exhibits the char-acteristic immunoglobulin-like fold and harbours the Fe(His)4(Cys) active site. The five ligands of the iron
centre are well conserved despite some disorder observed for one of the four molecules in the asymmetric unit. The participation of a glutamate as the sixth ligand of some of the iron centres in Pyrococcus furiosusSOR was not observed inTpSOR. A possible explanation is that either X-ray photoreduction occurred or there was a mixture of redox states at the start of data collection. In
agree-ment with earlier proposals, details in the TpSOR structure also suggest that Lys49 might be involved in attraction of superoxide to the active site.
Keywords Superoxide reductase ÆTreponema pallidum ÆOxidative stressÆ Iron–proteinÆSyphilis
Abbreviations Db:Desulfoarculus baarsiiÆ Dd: Desulfovibrio desulfuricans27774Æ Dfx:
DesulfoferrodoxinÆDg:Desulfovibrio gigasÆ Dv: Desulfovibrio vulgarisÆ Dx: DesulforedoxinÆFOM:
Figure of meritÆICP-OES: Inductively coupled
plasma–optical emission spectroscopyÆ MAD:
Multiple-wavelength anomalous diffractionÆ Pf: Pyrococcus furiosusÆrmsd: Root mean square
deviationÆ SAD: Single-wavelength anomalous
diffractionÆSOD: Superoxide dismutase ÆSOR:
Superoxide reductaseÆ Tp: Treponema pallidum
Introduction
Superoxide reductases (SORs) are small non-heme iron containing proteins that catalyse the one-electron reduction of superoxide to hydrogen peroxide, having rubredoxin as their putative electron donor [1–7], according to Eq. 1:
RdredþO2 þ2Hþ! SOR
RdoxþH2O2; ð1Þ
where Rd is rubredoxin. These enzymes participate in oxygen detoxification through a mechanism different from the well-known dismutation of superoxide ion by superoxide dismutase (SOD). They are found only in anaerobic or microaerophilic organisms belonging to Bacteria or Archaea kingdoms and, unlike SOD, only iron has been found at their catalytic site. SOR was first isolated from sulphate-reducing bacteria [8] and its gene was later identified in pathogenic bacteria, such as the syphilis spirochete Treponema pallidum (Tp) [3]. SOR was also isolated and characterized from other
organ-This work is dedicated to the memory of Prof. Frank Rusnak. Coordinates and observed structure factor amplitudes have been deposited in the Protein Data Bank under the accession code 1Y07.
T. Santos-SilvaÆJ. Trinca˜oÆA. L. CarvalhoÆC. Bonifa´cio F. Auche`reÆP. RaleirasÆI. MouraÆJ. J. G. Moura M. J. Roma˜o (&)
REQUIMTE/CQFB, Departamento de Quı´mica, Faculdade de Cieˆncias e Tecnologia,
isms such as Pyrococcus furiosus (Pf) [4], Desulfovibrio vulgaris (Dv) [8] andDesulfoarculus baarsii(Db) [5].
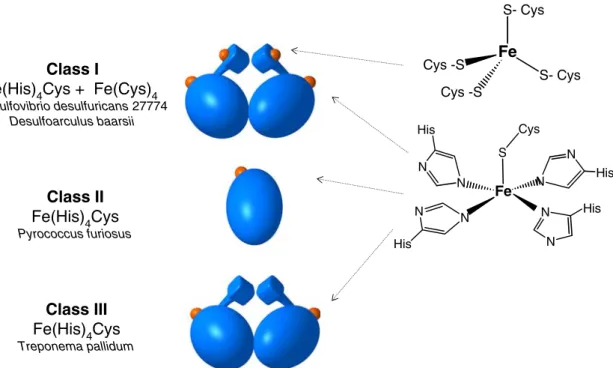
SOR can be grouped into three major classes. Members of class I (2Fe-SOR) contain two types of iron centres: a desulforedoxin (Dx) type centre Fe(Cys)4, and
a Fe(His)4(Cys) centre. Members of classes II and III
(1Fe-SOR) contain only the Fe(His)4(Cys) catalytic site.
Class II is the smallest member of the family and folds into one single domain (Fig. 1). SOR belonging to classes I and III present an additional N-terminal do-main, which, in the case of class I, also contains the extra Fe(Cys)4centre. This domain is very similar to the one
present in Dx [9,10]. Classes II and III are also desig-nated as 1Fe short-chain and 1Fe long-chain neelare-doxins, while the 2Fe-SORs are also known by the trivial designation of desulfoferrodoxin (Dfx) [8]. Class I and III SORs are homodimers in solution. The dimer-ization is stabilized by a net of intersubunit hydrogen bonds in a pattern which is conserved in the two classes of the family.
The iron atom of the active site has an unusual arrangement of four histidines in the equatorial plane and one cysteine in the axial position [11, 12] and only reacts with superoxide in the ferrous state. After one catalytic cycle (reduction of superoxide to hydrogen peroxide), the iron ion is in the ferric state and a further reductive step is required in order to regenerate the ac-tive state. An additional ligand has been proposed to be implicated in the catalytic site of SOR. InPfSOR, Glu14 has been assigned as a sixth labile ligand of the iron atom in its ferric state, corresponding to a ‘‘resting’’ state of the enzyme [12]. This proposal was further sustained by Fourier transform IR studies on DbSOR
(Glu47) and TpSOR (Glu48) [13]. Site-directed muta-genesis studies have revealed that this glutamic acid is not rate-limiting in the reaction of SOR with superoxide [14]. Nevertheless, this residue has been implicated in the release of hydrogen peroxide in the proposed two-step mechanism of SOR [15].
Although the sequence of several microbial genomes has revealed the widespread presence of SOR, only some of these proteins have been fully or partially character-ized spectroscopically, including SOR from Tp [3, 5],
Desulfovibrio gigas (Dg) [16], Archaeoglobus fulgidus
[17], Pf [18], Dv, Desulfovibrio desulfuricans (Dd) [5, 8,
19, 20] and Db [5]. The gene encoding DvSOR was cloned in two fragments in order to obtain polypeptides corresponding to the N- and C-terminal domains [19]. Structurally, the N-terminal domain mimics Dx, while the C-terminal domain accommodates the Fe(His)4(Cys)
catalytic site. These experiments have shown that the two domains of class I SOR (Dfx) preserve the structural properties of the respective centres when expressed sep-arately [19, 21]. This suggests a probable evolutionary gene fusion between the genes for the two domains. In independent work [22] theDvSOR gene was mutated in order to remove the Fe(Cys)4 centre, and the resulting gene product was shown to retain the activity of the wild-type enzyme. Although the Dx domain has been proposed to be involved in intramolecular electron transfer towards the catalytic site [19], so far, no experimental evidence has been gathered and its pres-ence in class I SOR (Dfx) remains an intriguing ques-tion. The presence/absence of the Dx domain may be a consequence of an evolutionary step from class I SOR to class II SOR.
Class III
Fe(His)4Cys
Treponema pallidum
Class I
Fe(His)4Cys + Fe(Cys)4
Desulfovibrio desulfuricans27774
Desulfoarculus baarsii
Class II
Fe(His)4Cys
Pyrococcus furiosus
S- Cys
S- Cys Fe
Cys -S
Cys -S
His N
N
N
N His
N N
N N
S
His
Fe Cys
His
Crystal structures of members of classes I and II have been solved:DdSOR [11] andDbSOR [23] belonging to class I, and PfSOR [12] from class II. The structure of
TpSOR now reported is the first representative of a class III SOR. A more complete view of the versatility of the SOR structures can now be discussed. By comparison and analysis of the amino acid sequences and structural details of the three classes of SOR it is clear that the proteins vary in complexity, but their active site is incorporated in a structurally well-defined site. It is interesting to note that in class III TpSOR the N-ter-minal fold is maintained even in the absence of the so-called structural iron centre.
Materials and methods
Crystallization and data collection
TpSOR was cloned into vector pTpNeelT77-8/19 and overexpressed in Escherichia coli BL21 (DE3) cells. It was purified to homogeneity using a combination of anion exchange and gel filtration chromatography, as described previously [3].
The oxidized form of TpSOR was obtained using Na2IrCl6as an oxidant. Pure protein was incubated with an excess of Na2IrCl6, which was subsequently removed using a desalting column. Crystals were grown using the hanging-drop vapour-diffusion method in the presence of 25% (w/v) poly(ethylene glycol) 3350, 0.2 M mag-nesium chloride and 0.1 M tris(hydroxymethyl)amino-methane HCl at pH 7.0. Blue plate-shaped crystals of 0.15· 0.05·0.05 mm3 grew within approximately 12 days. Crystallization details have been described elsewhere [24].
Preliminary X-ray diffraction experiments using monochromatic CuKaX-ray radiation from a rotating
anode generator, showed that crystals belong to space group C2, with cell constants a=119.3 A˚, b=59.9 A˚,
c=65.5 A˚ and b=104.9. The calculated Matthews coefficient [25], 2.2 A˚3Da1, indicates the presence of four molecules in the asymmetric unit, with a solvent content of approximately 43%. A highly redundant data set was collected in-house to 1.9-A˚ resolution. A second data collection experiment was performed at beamline BM14 at the ESRF, in Grenoble, France. The same crystal was used to collect data at two wavelengths corresponding to the iron edge absorption peak (1.739 A˚) and to a high-energy remote wavelength (1.033 A˚). With synchrotron radiation the crystals diffracted beyond 1.55 A˚ resolution. Data collection statistics are summarized in Table1.
Structure determination
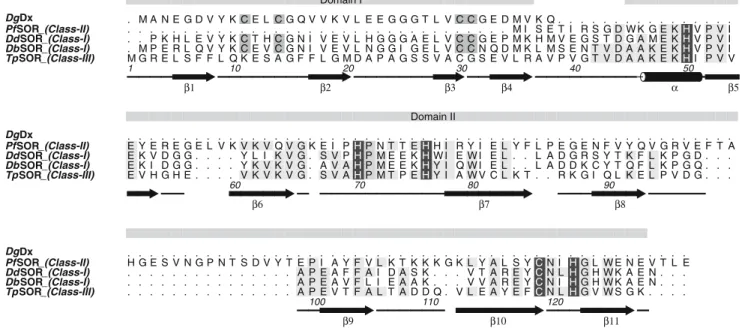
In spite of the high amino acid sequence homology among all members of this family (Fig.5), molecular replacement attempts systematically failed. Therefore, single-wavelength anomalous diffraction (SAD) and multiple-wavelength anomalous diffraction (MAD) experiments were performed in order to solve the phase problem.
The in-house collected data set, with an overall completeness of 94.2% and an overall redundancy of 19.2, allowed the calculation of preliminary phases [26,
27]. Although the SAD data were collected far from the iron absorption edge, the corresponding phases revealed the position of the four iron atoms in the asymmetric unit. However, the phases obtained were not of sufficient quality to produce an interpretable electron density map and to allow model building. These preliminary phases had a figure of merit (FOM) of 0.38 and a phasing power of 0.47.
Table 1 Data collection statistics forTreponema pallidumsuperoxide reductase (TpSOR) crystals in the oxidized form
Values in parentheses corre-spond to the highest resolution shell
Rsym¼PjIiðjÞ hIðjÞij=
P
IiðjÞ, whereIi(j) is theith
measurement of reflectionjand
hIðjÞiis the overall weighted mean ofjmeasurements
Crystal
Space group C2
Unit cell (A˚)
a 119.3
b 60.0
c 65.6
b() 104.9
High-energy remote Iron absorption peak In-house CuKa
Data collection statistics
Wavelength (A˚) 1.033 1.739 1.542
No. of observed reflections 366,944 219,096 581,439 No. of unique reflections 53,059 28,909 30,190
Resolution limits (A˚) 24.7–1.55 (1.63–1.55) 24.0–2.00 (2.11–2.0) 22.0–1.96 (2.07–1.96) Redundancy 6.9 (5.4) 7.6 (7.6) 19.2 (18.1)
Completeness (%) 82.4 (82.4) 95.0 (95.0) 94.2 (94.2) Anomalous completeness (%) 95.0 (92.3) 94.0 (86.9)
hI=rðIÞi 8.8 (4.3) 9.6 (5.3) 8.8 (1.9)
Rsym(%) 4.3 (17.7) 4.5 (11.4) 8.2 (39.6)
The synchrotron data sets provided higher resolution data and a much stronger anomalous signal. The MAD experiment confirmed the four iron sites found by SAD and supplied better phases for model building and refinement. Patterson anomalous difference maps cal-culated for the two wavelengths showed clear peaks for each iron centre. A combination of density modification protocols and NCS averaging yielded a highly detailed experimental map (FOM of 0.67), where the position of the four molecules was clearly established. At this stage, theDdSOR model (PDB accession code 1DFX) [28] was used as a starting model.
Model building and refinement
Manual model building was straightforward using the experimental map. Apart from a few flexible loops at the surface of the protein, where electron density was un-interpretable, all four polypeptide chains were built and most side chains assigned.
In the first cycles of refinement, data up to 2 A˚ resolution were used together with NCS restraints for the four molecules of the asymmetric unit. Resolution cutoff was gradually increased and TLS refinement was applied to the two domains of each monomer. The experimental phases, used throughout the refinement, were excluded in the last stages and the NCS copies were refined with no restraints with data up to 1.55 A˚ resolution.
The refinement cycles resulted in better phases and clearer electron density maps, allowing the localization of some missing side chains at the surface of the protein. However, the electron density for the most exposed loops could not be improved and the amino acid residues in those regions (approximately 5% of the total asymmetric unit) were not included in the final model. Residues Lys11–Gly15 are located at the surface of the protein, and show no continuous elec-tron density in molecules A and B; however, in mol-ecules C and D, the corresponding residues show continuous electron density and model building of this loop was possible. The same was observed for loop Thr42–Ala45, where the electron density is absent for molecules B and C. In molecule A all the residues from this region could be assigned, while in molecule D the electron density for residues Ala45–Glu48 is missing. In this stretch of residues, the refined tem-perature factors of the side chain atoms are about twice the average temperature factors of the main chain atoms. Water molecules were added using ARP-waters [29] and manually checked with graphics soft-ware [30].
After the last round of refinement, theR-work andR -free factors converged to 18.2 and 23.5%, respectively. The final model has 92% of the residues in the most favoured regions of the Ramachandran plot, with 8% in the additionally allowed regions. Statistical data of the refined model are summarized in Table2.
Software
The in-house data set was processed with MOSFLM [31] and SCALA [32], from the CCP4 suite [33], while the HKL2000 package [34] was used for the MAD data sets. Molecular replacement attempts were performed using several programs, such as MOLREP [35], AMoRe [36] and Phaser [37]. The determination of the protein sub-structure was accomplished with RANTAN [38] imple-mented in autoSHARP [39], using the in-house data. Later, the HySS program [40], a module of the Phenix package [41], was used for the synchrotron data. Density modification protocols were done with Pirate from the CCP4 suite of programs. Refmac5 [42] was used for refinement and TURBO–FRODO [30] for model building. The geometrical validation was performed with PROCHECK [43]. Sequence alignment analysis was done using ClustalW [44]. The superposition cal-culations were performed with TURBO–FRODO [30] and the figures were prepared with PyMOL [45] and Alscript [46].
Inductively coupled plasma–optical emission spectroscopy analysis
In order to investigate the presence of different metal atoms in the oxidized form of TpSOR, inductively coupled plasma–optical emission spectroscopy (ICP– OES) was performed. Several crystals grown with the same crystallization conditions were transferred from
Table 2 Refinement statistics for theTpSOR model
Refinement statistics
Resolution limits (A˚) 24–1.55
Rfactor (%) 18.2
No. of reflections 53,560
Rfree (%) 23.5
No. of reflections 2,678
No. residues per molecule 128 No. residues per asymmetric unit 489 No. atoms per asymmetric unit 4,091
No. residues missing 22
rmsd bond length (A˚) 0.02
rmsd bond angles (A˚) 1.765
Average temperature factor (A˚2)
Molecule A main chain atoms 11.95 Molecule A side chain atoms 15.27 Molecule B main chain atoms 18.40 Molecule B side chain atoms 20.37 Molecule C main chain atoms 11.31 Molecule C side chain atoms 14.39 Molecule D main chain atoms 16.09 Molecule D side chain atoms 18.76
Water molecules 38.59
Ramachandran plot (%)
Residues in most favoured regions 92 Residues in additionally allowed regions 8 Residues in disallowed regions 0
the original drops and dissolved in water. The analysis was done with Jobin-Yvon equipment, ULTIMA mod-el, for iron, calcium, magnesium and zinc separately. Significant amounts of iron and magnesium were found; however, neither zinc nor calcium were detected in the sample.
Results
Overall structure
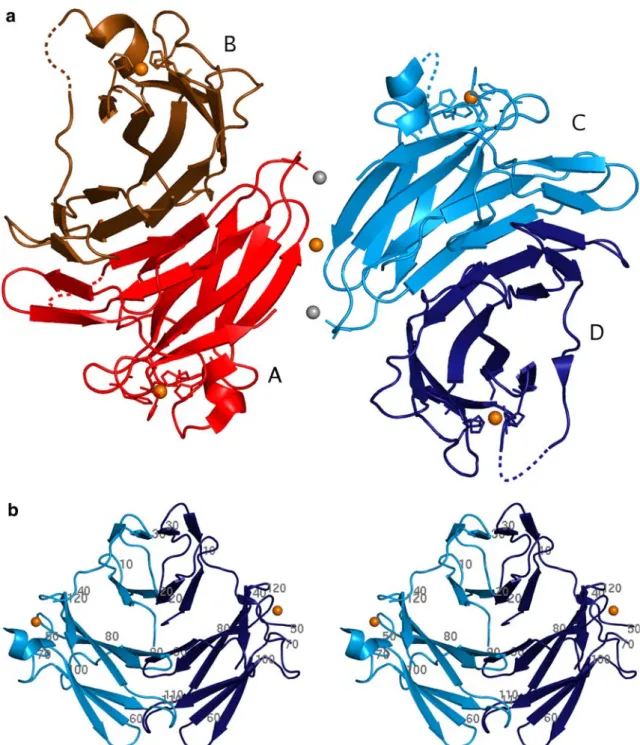
The structure solution of TpSOR in the oxidized form was achieved by a combination of SAD and MAD techniques, using the anomalous signal of the four iron atoms present in the asymmetric unit, to a resolution of 1.55 A˚. The structure revealed four copies (chains A, B, C and D) of the same polypeptide chain in the asymmetric unit of the crystal (Fig.2a). The four molecules are related to each other by noncrystallo-graphic symmetry operations. Molecule A is related to molecule B by a twofold NCS axis, while molecule C is related to molecule D by a second twofold NCS axis, perpendicular to the first. A third twofold NCS axis emerges, 45 from the other two, roughly parallel to the b-axis of the unit cell, relating group AB with group CD. TpSOR crystallizes as a dimer of homod-imers (AB and CD). Chain A of the TpSOR model consists of 121 amino acid residues from a total of 128 that comprise the recombinant protein. The final model includes 367 water molecules. Statistics for the diffraction data processing and model refinement are presented in Tables 1 and 2.
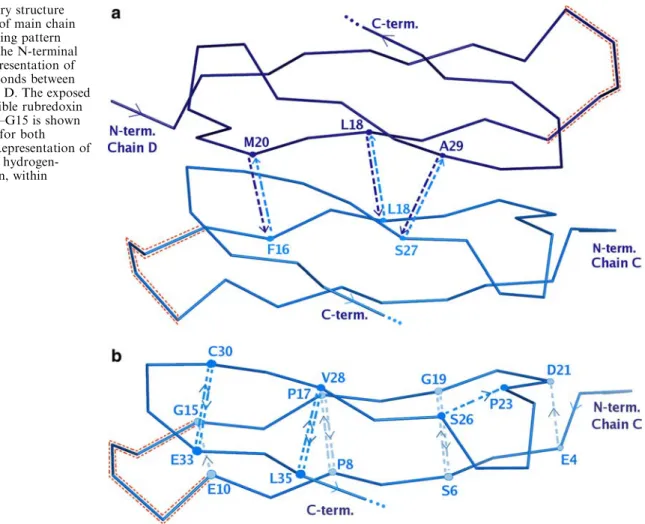
The TpSOR monomer is composed of two distinct domains (Figs. 1, 2b). The N-terminal domain (Met1– Arg36) exhibits a Dx-like fold with four b-strands, similar to the N-terminal domain of class I SOR. The C-terminal domain (Ala45–Lys125), harbours the catalytic Fe(His)4(Cys) site and displays an immunoglobulin-like fold, with sevenb-strands and a shorta-helix, in analogy to the C-terminal domain of classes I and II SOR. As mentioned before TpSOR is a homodimer in solution, with an overall arrangement resembling that of classes I and II dimers (Fig. 2b). At the N-terminal domain, dimerization produces two four-stranded antiparallel b -sheets (Fig. 3a), similar to theDgDx structure [9]. At the C-terminal domain an openb-barrel is formed. One side of the barrel is defined by an eight-stranded antiparallel b-sheet showing the typical twist between the first and eighth strands, while the other side is formed by a six-stranded b-sheet.
Between the N- and the C-terminal domains of each dimer, a small cavity is found. In class I DdSOR and
DbSOR, this cavity is approximately 430 A˚3and holds a calcium ion. This ion is coordinated by the side chains of amino acid residues of the C-terminal domain, and it was considered to be crucial for the stabilization of the dimers in the crystals [11]. In class III TpSOR no cal-cium ion is found at this position. In fact, a much
smaller cavity is formed (approximately 180 A˚3) owing to a tighter packing of the domains. The residues responsible for Ca2+ coordination in DdSOR (Ser87 and Thr89) have been replaced by hydrophobic residues in TpSOR (Ile89 and Leu91). Besides making it impos-sible to coordinate any ions, these residues are important for dimer stabilization. The amino acid sequences of other class III SORs such asClostridium acetobutylicum
SOR [47] or Treponema denticola SOR [48] also have hydrophobic residues at these positions. These results suggest that Ca2+ is not needed to maintain the dimer structure inTpSOR and will probably also be absent in other class III SOR proteins.
The four molecules in the asymmetric unit are very similar to each other with a root mean square deviation (rmsd) of approximately 0.3 A˚ for 100 Caatoms (out of 128 amino acids). However, there are differences in three loops where the poor quality of the electron density maps suggests disorder. The first of these loops, Phe8– Phe16, corresponds to the rubredoxin ‘‘knuckle’’ [49] and, together with the second loop (Cys30–Glu33), corresponds to the iron binding motif of Fe(Cys)4 in
DgDx and in class I SOR. This centre is absent in
TpSOR. Three of the four cysteine residues that coor-dinate the iron atom inDgDx and in class I SOR are not present in TpSOR, which may explain the increased disorder of the domain. Molecules A and B show no continuous electron density in the experimental electron density maps for the rubredoxin ‘‘knuckle’’, which is well defined only in molecules C and D. The third loop (Thr42–Glu48) is part of the linker segment between the N- and the C-terminal domains and it could be com-pletely traced only for molecule A. In molecules B and D, the poor quality of the electron density maps im-paired complete model building of this segment.
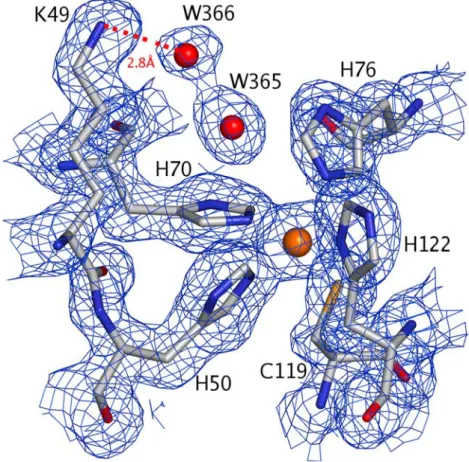
The active site: iron centre [Fe(NeHis)3(NdHis)(Sc–Cys)]
The iron centre is located in the C-terminal domain, close to the linker segment between the N- and the C-terminal domains. It is coordinated by four histidines (NeHis50, NeHis70, NeHis76, NdHis122) and one
cyste-ine (Sc–Cys119) (Fig.4) in a square-pyramidal
geome-try, and is highly exposed to the solvent, similar to what has been described for other SORs. In the homodimer, the two centres lie at opposite ends, 44 A˚ apart from each other. All four centres have been modelled with full occupancy.
The distances between the iron and the coordinating atoms are in agreement with the other SOR structures (Table3). The relatively wide range of values for the bond distances can be possibly explained by X-ray photoreduction and/or partial Zn occupancy (see later). The five ligands of the metal have well-defined density in the 2mFo–DFc maps. However, in molecule D weak
31 A˚2, respectively) when compared with the other ligands (18 A˚2on average). This may be due to disorder of the loop 73–77 and/or to crystal packing effects since molecule D has fewer crystal contacts in comparison with the other molecules.
The structure of PfSOR in the oxidized form [12] shows, for only half of the molecules in the asymmetric unit, a sixth labile ligand (Glu14). This glutamate
belongs to a disordered loop and is coordinated to the iron atom in the ferric state, with an Fe–O distance of 2.1 A˚.
In TpSOR the corresponding loop (Thr42–Glu48) is also disordered but Glu48 (Glu14 inPfSOR) is located 10–12 A˚ away from the iron centre (where only for molecule D, Glu48 could not be traced). Since crystals were grown after treatment of the protein with an
oxi-Fig. 2 Crystal structure of the oxidized form of Treponema pallidum (Tp) SOR. a One asymmetric unit of TpSOR showing the two functional dimers (ABandCDin two shades ofredand
blue, respectively) and viewed along one of the local dyads. The four iron atoms, approximately 40 A˚ apart within each dimer,
dizing agent, this result was unexpected. As suggested for PfSOR [12], X-ray photoreduction could affect the oxidation state of the TpSOR centre, preventing hexa-coordination of the iron atom. In fact, forDbSOR [23] some of the iron centres are photoreduced within 3 s of X-ray exposure, although it seems unlikely that a motion of approximately 10 A˚ occurs at 100 K.
In all SOR structures reported so far, a positive dif-ference electron density is observed at about 4.5 A˚ from the iron atom, in the free axial position. This has been assigned to the effect of a chloride ion inDbSOR, but in
DdSOR it could not be identified. In TpSOR a water molecule was modelled in this density, with B factors (35–40 A˚2) comparable to the averageBfactor of waters (38.6 A˚2) (Table1). In one of the molecules (C) (Fig.4) this water molecule contacts with Lys49, via a second water molecule. This is a highly conserved lysine and has been described as an important residue for the catalytic activity of SOR [15], attracting the superoxide ion to the active site. Comparing the H2O–Fe distances (Table3) it
is noteworthy that, while for molecules A–C the dis-tances are approximately 4.3 A˚, for molecule D the corresponding water molecule (W360) is only 2.7 A˚ away from the Fe atom. In fact, in PfSOR, a water molecule was also found at approximately 2.6 A˚ from
the Fe atom, for the two molecules where Glu14 is not bound [12].
Anomalous difference Patterson maps were calcu-lated for the two data sets, collected at two different wavelengths: the iron absorption peak (1.739 A˚) and a higher-energy remote wavelength (1.033 A˚). As ex-pected, strong anomalous difference peaks, correspond-ing to the four iron centres in the asymmetric unit, were observed using the structure factors of the iron absorp-tion peak data set. These anomalous difference peaks were also detected in the Patterson maps of the higher-energy data set. Even though the anomalous scattering properties of iron extend over a wide range of wave-lengths, we would have expected that the observed anomalous density would be smaller when compared with the peak data. This suggests that a different metal could be competing for the same position. Overexpres-sion ofTpSOR inE. coliis known to result in a mixture of both iron- and zinc-bound forms of the protein [3]. In fact, at the remote wavelength (1.033 A˚), zinc exhibits a higher anomalous signal than iron. Although the anomalous difference intensities for the peak data are similar among the four molecules, the anomalous intensities for the remote data set (1.033 A˚) are different, which could be due to the presence of zinc in some of the
Fig. 3 Secondary structure representation of main chain hydrogen bonding pattern (NHfiO) at the N-terminal
crystal molecules. Metal atom analysis (ICP–OES) was performed in dissolved crystals; however, the analysis did not reveal the presence of zinc, probably owing to the low amount of the metal present in the crystals. Additional information could be obtained by collecting data above and below the zinc absorption edge, but this could not be performed. Furthermore, ICP analysis did not detect the presence of calcium atoms, in agreement with what was discussed before.
Together with the anomalous signals of the four iron centres, another unexpected strong peak was present in the anomalous difference Fourier map, with intensity similar to that of the iron centres. It is located at the interface between molecules A and C, sitting on the twofold NCS axis that relates the two homodimers and lies approximately 3.3 A˚ from Gln111A, Gln111C
carboxylic groups and four water molecules. Even though the distances between this strong electron density and potential ligands imply the absence of coordination, it possibly stabilizes the crystallographic dimer (Fig.2). When included in the model with an occupancy of 0.8, this putative iron atom refined to aBfactor of 22.4 A˚2. At this interface two magnesium ions are also present with an octahedral coordination to five water molecules, and to the carbonyl groups of Ala108A and Ala108C. Since Mg2+ is present in the crystallization conditions (0.2 M MgCl2) and is bound to the surface of the pro-tein, its presence does not have functional relevance. The two magnesium ions and the putative iron atom are aligned, forming an axis perpendicular to the NCS axis. Together, these two axes form a plane that divides the asymmetric unit into two identical parts.
Comparison with related structures
TpSOR is structurally very similar to the other SOR proteins. Primary structure alignments show high se-quence identity (more than 30%) among the three clas-ses, with amino acid sequence conservation mainly in the C-terminal domain (Fig.5). The superposition of the
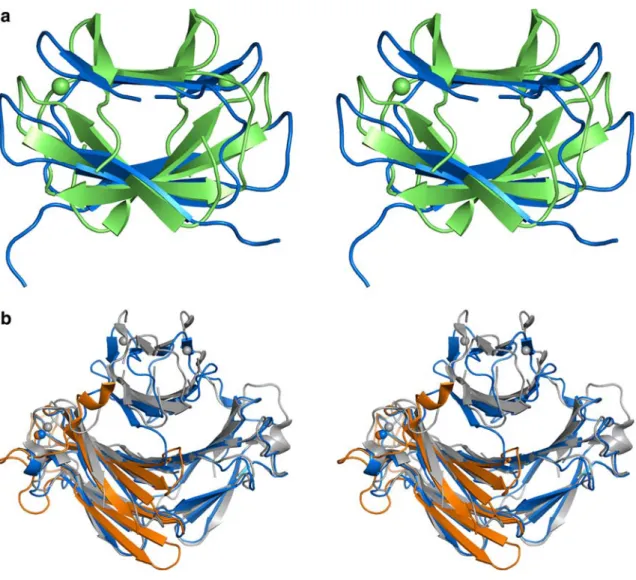
TpSOR structure with those of the related proteins, represented in Fig.6, reveals a similar overall architec-ture for the three classes, in particular for the active site domain. The CD homodimer was chosen for the
Fig. 4 Details of the active site of molecule C and
representation of the final 2mFo–DFcelectron density map
contoured at 0.8rlevel obtained from the high-energy remote data set. The four histidine residues and the cysteine residue are coordinated to the iron atom. Lys49 is connected to the iron atom through a net of hydrogen bonds mediated by solvent molecules W366 and W365. W365 is at 4.2 A˚ from the metal atom
Table 3 Distances between the iron atom and its ligands in the active site [Fe(NeHis)
3(NdHis)(Sc–Cys)]
Molecule A
Molecule B
Molecule C
Molecule D
Distance Fe–N(His) (A˚)
His50, Ne 2.2 2.3 2.1 2.2
His70, Ne 2.2 2.4 2.2 2.4
His76, Ne 2.4 2.1 2.3 2.2
His122, Nd 2.3 2.1 2.2 2.2
superpositions since the AB homodimer has several disordered regions.
The structural superposition of TpSOR and PfSOR was carried out using only the C-terminal domain. The low rmsd value found for 80% of the Caatoms (0.8 A˚) denotes the high similarity between the two proteins. The main difference is in the length of the loop regions, which are longer in PfSOR when compared with the other SOR structures. Structural comparison ofTpSOR and DbSOR reveals more differences in both domains. The high structural similarity observed in the C-terminal domains of the two proteins is not present in the N-terminal domains (Fig. 6b).
The low rmsd value found for the C-terminal domain (0.7 A˚ for the superposition of the monomers), doubles for the N-terminal domain, for approximately 90% of the Ca atoms (1.7 A˚ for the same superposition). The amino acid sequence homology between the TpSOR N-terminal domain and the same domain of class I SOR or DgDx is not significant, suggesting structural diver-gence. As mentioned before, the iron binding motifs of centre I Fe(Cys)4 are absent in TpSOR; therefore, the
characteristic NHfi S hydrogen bonding pattern de-scribed for the rubredoxin and Dx iron sites [9, 10, 50] does not exist and disorder is observed in the corre-sponding loops, especially for the AB dimer. In mole-cules C and D it is clear that the b-strands forming the domain are in different positions and with a different orientation than in DgDx. The two loops that enclose the Fe(Cys)4 centre in DgDx, are approximately 1.5 A˚
closer to each other inTpSOR, where the metal centre is absent. In fact, for DgDx as well as for rubredoxin [9,
10, 50] a structural role was assigned to the Fe(Cys)4
centre, which was therefore considered relevant for the general stability of the structure.
However, the lack of the iron centre and its ligands justifies the larger mobility of the N-terminal domain in
TpSOR, which is held together byb-sheet interactions. In addition, in TpSOR there are fewer intersubunit hydrogen bonds stabilizing the dimer (Fig. 3a) as well as the b structure of each monomer (Fig. 3b). From ten intersubunit NHfi O hydrogen bonds found inDgDx [9], only six are conserved inTpSOR (Fig.3a), while in each monomer only 11 hydrogen bonds between adja-cent strands are found, instead of the 14 in Dx.
Discussion and conclusions
TpSOR is the first member of class III of the SOR family to be structurally characterized. The high resolution structure now reported provides valuable information for the understanding of this class of enzymes. The effect of the absence of an iron centre Fe(Cys)4at the N-ter-minal domain on the protein fold could not be antici-pated in the absence of the crystal structure, when compared with class I SOR (DdSOR andDbSOR). Al-though the overall arrangement of the protein is very similar to that of the other classes of SOR, the stability of the N-terminal domain (a small b-barrel) is affected by the absence of the iron ion and its ligands. In the related Dx protein, a small homodimeric (2·4 kDa) protein comprising only this domain, a clear structural role was assigned to the Fe(Cys)4centre [9]. The stability
of theb-barrel was explained on the basis of a network of intersubunit and intrasubunit hydrogen bonds, as well Dx
Dx
Dx SOR
SOR SOR SOR
SOR SOR SOR SOR
SOR SOR SOR SOR
Fig. 5 Amino acid sequence alignment of Desulfovibrio gigas
desulforedoxin (DgDx) and SORs from Pyrococcus furiosus
(PfSOR), Desulfovibrio desulfuricans (DdSOR), Desulfoarculus baarsii(DbSOR) andTpSOR. Identity toTpSOR is indicated with
light grey boxes. Residue numbers refer to the sequence ofTpSOR.
as to a characteristic pattern of NHfiS interactions between the iron atom and its cysteine ligands. Similar noncovalent interactions are conserved within the N-terminal domain of class I SOR (DbSOR and DdSOR). In TpSOR, in spite of the conserved global fold, the quality of the model reveals some disorder in the cor-responding domain, particularly in the region that would harbour the iron centre. This can be explained by the lack of several of the mentioned hydrogen bonds. In addition, since three of the four coordinating cysteines are absent in TpSOR the pattern of NHfiS bonds is not present.
The interactions within the functional dimers ob-served for class I SOR structures are also obob-served in
TpSOR. The relevance of the calcium ion upon dimer-ization in TpSOR is, however, different from what has been proposed for class I SOR. The hydrophobic resi-dues that replace the calcium ligands present in classes I and II SOR are conserved in other proteins of class III;
hence, on the basis of theTpSOR structure, we suggest that calcium is probably not essential for the formation of the functional dimer in class III SOR.
The active site is highly conserved in the three classes of SOR and the iron atom is fivefold coordinated. In the oxidized form ofTpSOR, the participation of Glu48 as a sixth ligand of the iron centre was expected, as observed in PfSOR. However, Glu48 is placed 10–12 A˚ away from the metal and belongs to a disordered loop. This residue is highly conserved in SOR and has been impli-cated in the mechanism of release of hydrogen peroxide [15]. It is known that X-ray photoreduction affects the iron centre (PfSOR [12] andDbSOR [23]) and inTpSOR this could be a possible explanation for the presence of a pentacoordinated iron atom. However, a motion of approximately 10 A˚ seams unlikely to occur at 100 K and further experiments are needed to clarify this point. The interaction of Lys49 with the Fe atom is medi-ated by two water molecules, substantiating the
Fig. 6 Stereo view of the ribbon representation of the superposi-tions of the three SOR classes andDgDx.aThe N-terminal domain ofTpSOR (blue) andDgDx (green) (root mean square deviation,
rmsd, of 2.2 A˚ for 60 Caatoms out of 72).bThe CD homodimer
fromTpSOR (blue) withDbSOR (grey) (rmsd of 1.7 A˚ for 209 Ca
hypothesis that this residue may be involved in the enzymatic mechanism, attracting the superoxide ion into the active site [15]. At the Thr73–Tyr77 loop region, which includes one of the Fe ligands (His76), some disorder is observed for one of the SOR molecules (molecule D). Whether this is due to packing effects or is mechanistically relevant cannot be established at this stage. Furthermore, the existence of a well-ordered wa-ter molecule 2.7 A˚ from the iron atom, also in molecule D, could mean a stabilization of the centre at an inter-mediate state of the reaction cycle of SOR. These hypotheses need, however, to be investigated through additional structural studies, in particular with reduced and substrate analogues or inhibitor-bound forms of
TpSOR.
AcknowledgementsThis work was supported in part by Fundac¸a˜o para a Cieˆncia e Tecnologia, SFRH/BD/6358/2001 (T.S.-S.), BPD-9444/2002 (J.T.) and COST D21 – WG6 (I.M., J.J.G.M. and M.J.R.). The authors would like to thank Ma´rio Sadio for his help in the preparation of Fig.1, Hassan Berhali, from beamline BM14, for his help during synchrotron data collection at the ESRF, Grenoble, France, and the EMBL EU-HCMP programme for supporting travel and accommodation expenses. The authors would also like to thank the Analytical services of laboratory of REQUIMTE for the ICP-OES results.
References
1. Emerson JP, Coulter ED, Phillips RS, Kurtz DM Jr (2003) J Biol Chem 278:39662–39668
2. Lombard M, Touati D, Fontecave M, Niviere V (2000) J Biol Chem 275:27021–27026
3. Jovanovic T, Ascenso C, Hazlett KR, Sikkink R, Krebs C, Litwiller R, Benson LM, Moura I, Moura JJ, Radolf JD, Huynh BH, Naylor S, Rusnak F (2000) J Biol Chem 275:28439–28448
4. Jenney FE Jr, Verhagen MF, Cui X, Adams MW (1999) Sci-ence 286:306–309
5. Lombard M, Fontecave M, Touati D, Niviere V (2000) J Biol Chem 275:115–121
6. Emerson JP, Coulter ED, Cabelli DE, Phillips RS, Kurtz DM Jr (2002) Biochemistry 41:4348–4357
7. Auche`re F, Sikkink R, Cordas C, Raleiras P, Tavares P, Moura I, Moura JJ (2004) J Biol Inorg Chem 9:839–849
8. Moura I, Tavares P, Moura JJ, Ravi N, Huynh BH, Liu MY, LeGall J (1990) J Biol Chem 265:21596–21602
9. Archer M, Huber R, Tavares P, Moura I, Moura JJ, Carrondo MA, Sieker LC, LeGall J, Romao MJ (1995) J Mol Biol 251:690–702
10. Archer M, Carvalho AL, Teixeira S, Moura I, Moura JJ, Ru-snak F, Romao MJ (1999) Protein Sci 8:1536–1545
11. Coelho AV, Matias PM, Fulop V, Thompsoon AW, Gonzalez A, Carrondo MA (1997) J Biol Inorg Chem 2:680–689 12. Yeh AP, Hu Y, Jenney FE Jr, Adams MW, Rees DC (2000)
Biochemistry 39:2499–2508
13. Berthomieu C, Dupeyrat F, Fontecave M, Vermeglio A, Niviere V (2002) Biochemistry 41:10360–10368
14. Lombard M, Houee-Levin C, Touati D, Fontecave M, Niviere V (2001) Biochemistry 40:5032–5040
15. Nivie`re V, Asso M, Weill CO, Lombard M, Guigliarelli B, Favaudon V, Houee-Levin C (2004) Biochemistry 43:808–818 16. Chen L, Sharma P, Le Gall J, Mariano AM, Teixeira M,
Xa-vier AV (1994) Eur J Biochem 226:613–618
17. Abreu IA, Saraiva LM, Carita J, Huber H, Stetter KO, Cabelli D, Teixeira M (2000) Mol Microbiol 38:322–334
18. Clay MD, Jenney FE Jr, Hagedoorn PL, George GN, Adams MW, Johnson MK (2002) J Am Chem Soc 124:788–805 19. Ascenso C, Rusnak F, Cabrito I, Lima MJ, Naylor S, Moura I,
Moura JJ (2000) J Biol Inorg Chem 5:720–729
20. Tavares P, Ravi N, Moura JJ, LeGall J, Huang YH, Crouse BR, Johnson MK, Huynh BH, Moura I (1994) J Biol Chem 269:10504–10510
21. Rusnak F, Ascenso C, Moura I, Moura JJ (2002) Methods Enzymol 349:243–258
22. Emerson JP, Cabelli DE, Kurtz DM (2003) Proc Natl Acad Sci USA 100:3802–3807
23. Adam V, Royant A, Niviere V, Molina-Heredia FP, Bourgeois D (2004) Structure (Camb) 12:1729–1740
24. Santos-Silva T, Trincao J, Carvalho AL, Bonifacio C, Auchere F, Moura I, Moura JJG, Romao MJ (2005) Acta Crystallogr F 61:967–970
25. Matthews BW (1968) J Mol Biol 33:491–497
26. Dauter Z, Dauter M, de La Fortelle E, Bricogne G, Sheldrick GM (1999) J Mol Biol 289:83–92
27. Weiss MS, Sicker T, Hilgenfeld R (2001) Structure (Camb) 9:771–777
28. Berman HM, Westbrook J, Feng Z, Gilliland G, Bhat TN, Weissig H, Shindyalov IN, Bourne PE (2000) Nucleic Acids Res 28:235–242
29. Perrakis A, Morris R, Lamzin VS (1999) Nat Struct Biol 6:458– 463
30. Roussel A, Fontecilla-Camps JC, Cambillau C (1990) XV IUCr Congess Bordeaux, France
31. Leslie AGW (1992) Newslett Protein Crystallogr 26 32. Kabsch W (1988) J Appl Crystallogr 21:67–71
33. Collaborative Computational Project Number 4 (1994) Acta Crystallogr D 50:760–763
34. Otwinowski Z, Minor W (1997) Macromol Crystallogr 276(Pt A):307–326
35. Alexei Vagin AT (1997) J Appl Crystallogr 30:1022–1025 36. Navaza J (1994) Acta Crystallogr A 50:157–163
37. Read RJ (2001) Acta Crystallogr D 57:1373–1382 38. Jia-xing Y (1981) Acta Crystallogr A 37:642–644
39. delaFortelle E, Bricogne G (1997) Macromol Crystallogr 276(Pt A):472–494
40. Grosse-Kunstleve RW, Adams PD (2003) Acta Crystallogr D 59:1966–1973
41. Adams PD, Grosse-Kunstleve RW, Hung LW, Ioerger TR, McCoy AJ, Moriarty NW, Read RJ, Sacchettini JC, Sauter NK, Terwilliger TC (2002) Acta Crystallogr D 58:1948–1954 42. Murshudov GN, Vagin AA, Dodson EJ (1997) Acta
Crystal-logr D 53:240–255
43. Laskowski RA, MacArthur MW, Moss DS, Thornton JM (1993) J Appl Crystallogr 26:283–291
44. Pearson WR (1998) J Mol Biol 276:71–84
45. DeLano WL (2002) The PyMOL molecular graphics system. DeLano Scientific, San Carlos
46. Barton GJ (1993) Protein Eng 6:37–40
47. Nolling J, Breton G, Omelchenko MV, Makarova KS, Zeng QD, Gibson R, Lee HM, Dubois J, Qiu DY, Hitti J, Wolf YI, Tatusov RL, Sabathe F, Doucette-Stamm L, Soucaille P, Daly MJ, Bennett GN, Koonin EV, Smith DR, Finishing GSCP (2001) J Bacteriol 183:4823–4838
48. Seshadri G, Myers GSA, Tettelin H, Eisen JA, Heidelberg JF, Dodson RJ, Davidsen TM, DeBoy RT, Fouts DE, Haft DH, Selengut J, Ren QH, Brinkac LM, Madupu R, Kolonay J, Durkin SA, Daugherty SC, Shetty J, Shvartsbeyn A, Gebre-georgis E, Geer K, Tsegaye G, Malek J, Ayodeji B, Shatsman S, McLeod MP, Smajs D, Howell JK, Pal S, Amin A, Vashisth P, McNeill TZ, Xiang Q, Sodergren E, Baca E, Weinstock GM, Norris SJ, Fraser CM, Paulsen IT (2004) Proc Natl Acad Sci USA 101:5646–5651
49. Schwabe JW, Klug A (1994) Nat Struct Biol 1:345–349 50. Meyer J, Moulis J (2001) Handbook of Metalloproteins. Wiley,