External preference map to evaluate the acceptance of light and diet yogurt
preparedus-ingnatural sweeteners
Mapa de preferência externo para avaliar aceitação de iogurte light e diet elaborados com edulcorantes naturais
Daiana Aparecida de Carvalho1 Gerson de Freitas Silva Valente1* Giovana Maria Pereira Assumpção1
ISSNe 1678-4596
INTRODUCTION
In Brazil,diet and light food products are
classified and regulated into different categories;
therefore, they have different purposes. For products to be considered light,according to the provisions of Ordinance SVS/MS N 27/98, they must satisfy the low or light attributes for absolute nutrient content (energy value, sugars, etc.). Diet foods are those intended for patients wanting to consume diets with restricted nutrients. Light foods have a minimum reduction of 25% in terms of caloric value or the content of some
nutrients when compared to a similar one. For products to be considered dietary, they must also comply with the provisions of Ordinance SVS/MS N 29/98.Dietary
products can be classified as follows: nutrient-restricted
foods, carbohydrate-restricted foods, fat-restricted foods, protein-restricted foods, sodium-restricted
foods, and other foods intended for specific purposes.
Stevia and xylitol are natural sweeteners that areused as an alternative to sugar in diet and light food products
(MUSSATTO & ROBERTO, 2002; REIS, 2007).
Stevia leaf extract is approximately 300 times sweeter than sucrose (FREITAS, 2002). Besides
1Instituto Federal Sudeste de Minas Gerais (IF SUDESTE MG), Campus Barbacena, Barbacena, MG, Brasil. E-mail: gerson.valente@
ifsudestemg.edu.br. *Corresponding author.
ABSTRACT:Owing to the high demand for healthier foods, the food industry has been marketing diet and light yogurts. The present study aimed to sensorially evaluate yogurts prepared using natural sweeteners through a simple centroid mixture design with three repetitions at the central point using the preference map methodology. Different formulations were processed using stevia, xylitol, and sucrose in delimited proportions based on the sweetness of the sweetener. A team of tasters was recruited to survey the sensory attributes of the formulations using the check-all-that-apply (CATA) methodology. A product acceptance analysis was also conducted in which 50 consumers evaluated the formulations using a 9-point hedonic scale. After assessing the acceptance, consumers completed the CATA questionnaire. Internal and external preference maps were built using the obtained results. We found high acceptance means (xylitol:stevia:sugar)for F7 (1.0:0:0), F1
(0.5:0:0), and F2 (0:0.5:0.5), which were characterized by a sweet taste, creamy texture, strawberry flavor, fermented milk flavor, and light
pink appearance. Formulations with the lowest scores were F6 (0:1.0:0), F3 (0.33:0.33:0.33), and F4(0.5:0.5:0), which were characterized by a residual and bitter taste, astringent sensation, and inconsistent texture.
Key words: principal components analysis, sensory analysis, fermented milk.
RESUMO: Devido à grande procura por alimentos mais saudáveis, as indústrias alimentícias vêm introduzindo no mercado os iogurtes diet e
light. O presente estudo teve como finalidade avaliar sensorialmente iogurtes produzidos com edulcorantes naturais através de delineamento
de mistura centroide simples com três repetições no ponto central pela metodologia Mapa de preferência. Foram elaboradas diferentes
formulações utilizando estévia, xilitol e sacarose em proporções delimitadas considerando o poder adoçante do edulcorante. Uma equipe de
provadores foi selecionada para levantamento dos atributos sensoriais dos iogurtes por meio da metodologia Check-All-That-Apply (CATA). Foi ainda efetuada a análise de aceitação do produto em que cinquenta consumidores avaliaram as formulações usando escala hedônica de nove
pontos. Após avaliação da aceitação, os consumidores preencheram a ficha do questionário CATA. Com osresultados obtidos foram montados
mapas de preferência:interno e externo. Constatou-se maiores médias de aceitação das amostras F7 (1,0:0:0; xilitol:estévia:açúcar), F1
(0,5:0:0,5; xilitol:estévia:açúcar) e F2 (0:0,5:0,5; xilitol:estévia:açúcar) que apresentaram características como gosto adocicado, gosto doce,
textura cremosa, sabor polpa de morango, aroma bebida láctea, aparência rosa claro, e as amostras com menores cores foram as F6 (0:1,0:0;
xilitol:estévia:açúcar), F3 (0,33:0,33:0,33; xilitol:estévia:açúcar) e F4 (0,5:0,5:0; xilitol:estévia:açúcar)apresentaram características como
sabor residual, gosto amargo, sensação adstringente, texturas em consistência.
Palavras-chave: análise de componentes principais, análise sensorial, leite fermentado.
being highly soluble in water and alcohol, non-fermentable, and physically and chemically stable, stevia has several industrial applications, mainly in the food industry. Xylitol is extracted from fruits and vegetables, mainly cereals. Because it has a sweetening power and volume similar to that of sucrose, it is
preferentially used as a substitute for sucrose; thus,
xylitol can be substituted at the same proportion to reach the desired sweetness without affecting the food mass balance. Further, xylitol contains only 2.4Kcal/g and does not have an unpleasant residual taste (MUSSATTO & ROBERTO, 2002).
The addition of sweeteners to produce diet or light yogurt having sensory characteristics similar to those of traditional yogurt should be conducted with caution owing to the diverse chemical structures or conditions of consumption and storage and their interaction with different food properties. Most sweeteners not only have sweetening properties but also other sensory characteristics that are considered undesirable by consumer, such as a persistent sweet taste, bitter taste, and persistent or non-residual taste (REIS, 2007). Substitution of sucrose by other natural sweeteners requires the application of appropriate sensory techniques. For example, it is necessary to determine the concentration of the sweetener to obtain an equivalent
sweetness; it is also important to identify which
sweetener has sensory characteristics similar tot hose of the product being developed (ESMERINO et al., 2015).
Several advanced techniques in sensory analyses, such as time intensity analysis, parallel factor analysis, principal component analysis, comment analysis, and check-all-that-apply (CATA) methodology, are being implemented in the development of new products by the food industry. These techniques are being used to elaborate internal and external preference maps along with attributes generated by the consumer, which reduces the time and cost for the development of new products (ESMERINO et al., 2017).
Some recent studies have applied these techniques, for example, in evaluating the addition of prebiotics and sweeteners in the development of a chocolate dairy dessert (MORAIS et al., 2014). The formulation was developed using a 9-point hedonic
scale for appearance, aroma, flavor, texture, and global
acceptance attributes, and a parallel factor analysis and principal component analysis to build the internal preference map. Optimization of the milk dessert formulation simultaneously facilitated the evaluation of consumer acceptance of several sensory attributes.
Sensory analysis techniques that use
an elaborated product profile have quickly gained
acceptance in the food industry. Techniques that
use a direct analysis of the terms generated by the consumer itself are considered easy, do not require any training, and also include information of how a consumer perceives the product. As an example, researchers evaluated different brands of ice cream (FONSECA et al., 2016). Central pivot techniques and comment analysis were effective in characterizing the different chocolate ice cream samples using consumer perception, which had high correlation results. However, they observed that the comment analysis was intuitively performed by the consumers, whereas the central pivot technique presented high analytical and discriminative power, even using consumers, proving this to be a promising technique for routine applications.
The CATA method can be used by consumers to characterize products and to understand the hedonic and sensory characteristics of food
products. For each sample, a pre-defined list of
sensory descriptors is presented and participants are instructed to select all that apply, which is considered an easy and less time consuming method for the tasters (ARES et al.,2014). Three techniques were used for the characterization of sensory attributes of Greek yogurt:central pivot, CATA, and map of
projection (ESMERINO et al., 2017); the authors verified that the techniques used to characterize the product with consumers were efficient.
Application of CATA and intensity scale techniques allowed Minas Frescal cheese to be described in a study aiming to improve products based on consumer perception (OLIVEIRA et al., 2017). Samples of whole cheese (in terms of fat content), low fat cheese, and low lactose content cheese were used. The data obtained were used to reformulate the product based on the consumer’s perceptions.
The CATA questionnaire identified that only flavor
was important for the various cheeses evaluated. Results showed that these techniques used should be considered by cheese producers so that they can adjust the manufacturing based on consumer preference.
In an evaluation of six dairy products in the category of cream and processed cheese (traditional, with the addition of starch, and with the addition of starch and vegetable fat), the CATA technique was used to obtain descriptive attributes (TORRES et al., 2017). The authors concluded that the technique is an alternative method to elaborate on the sensory
profile of the product and that the technique was
or individual segments (RODRIGUES et al., 2013). As such, the importance of elaborating on preference maps is realized, which makes the evaluation of taster behavior in relation to each sample possible.
A preference map can be divided into two categories as follows: internal (when acceptance data are derived from results obtained by affective tests) and external (when a descriptive analysis is provided by a team of trained judges related to acceptance data
and the preference of evaluated products)(SILVA; DUARTE; CAVALCANTI-MATA, 2010). As the
external preference map enables a comprehensive and detailed explanation of consumer preferences, it becomes an important tool to visualize the behavior of each taster to the analyzed sample(RODRIGUES et al., 2013). The present study applies an external preference mapping methodology to evaluate the effect of the addition of natural sweeteners (stevia and xylitol at different proportions) in the acceptance of liquid yogurts using the CATA technique for evaluating the sensory descriptors of formulations.
MATERIALS AND METHODS
Preparation of yogurt formulations
Yogurts were processed with the addition of different sweeteners (sucrose, stevia, and xylitol) at different proportions according to a single centroid blend design with three replicates at the center
point, as shown in table 1 (NETO & SCARMINIO;
BRUNS, 2003).Yogurts were prepared following the method proposed by the yeast manufacturer. Sugar (at a proportion of 8%)was added to the milk (2L) in
the formulations before heat treating the raw material at 80°C for 30 min. After cooling to 40°C, yeast (RICA NATA) was added in a lyophilized form along with a lactic culture of Streptococcus thermophiles
and Lactobacillus delbruecki subsp. Bulgaricus.
The milk was fermented for approximately 12h in a thermal box until the acidity of the dough was between 72°D and 75°D. The mass was broken, the strawberry preparation (5%) of the PROREGI brand and the sweeteners were added (xylitol and stevia at different proportions based on the initial milk volume). The obtained product was then manually packed in polyethylene bottles and stored at 8°C.
Microbiological analysis
Microbiological analyses were performed following the method described by SILVA et al. (2017). Coliforms at 35°C and 45°C were evaluated using the most probable number (MPN) technique. Three series of three tubes were used for sample dilutions of 10−¹, 10−², and 10−³ and results were expressed as MPN.mL−1. For molds and yeasts, the surface plating method was used with a potato dextrose agar culture medium and
Drigalsky’shandle; one milliliter of the yogurt sample
was seeded, followed by incubation at 25°C for 5d. All experiments were performed in duplicate. Results were expressed as colony forming units (CFUs), mL−1.
Sensory analysis
Sensory analysis was performed with
regular consumers of yogurt; students and employees
of the Instituto Federal do Sudeste de Minas, Campus Barbacena, who showed an interest in participating were enrolled. Samples were
identified by random three digits and were served
in plastic containers that were free of any odor.
Acceptance testing
The formulations were evaluated with 50 tasters in complete blocks balanced following the method of BRASIL (2005) and the overall impression according to the hedonic 9-point scale according to BELSITO et al. (2017). Approximately 20g of each formulation was served at 12°C. Water was served to the consumers to wash their palate between testing of each sample. The analyses were conducted once the free and informed consent of the tasters was obtained.
Sensory attributes
A pre-selection was performed with 30 consumers following the method described by MINIM (2010). The triangular test was applied in three sessions in which three samples of yogurt
Table 1 - Design of simple centroid mixing with three replicates at the central point.
Assay Sucrose Xylitol Stevia
F1 0.500 0.500 0.000
F2 0.500 0.000 0.500
F3 0.333 0.333 0.333
F3 0.333 0.333 0.333
F3 0.333 0.333 0.333
F4 0.000 0.500 0.500
F5 1.000 0.000 0.000
F6 0.000 0.000 1.000
F7 0.000 1.000 0.000
were offered, two being equal and one being different. Consumers were asked to identify the different sample. Criterion used to select tasters was minimum 60% accuracy for all tests applied.
Descriptive thermology was developed by the Network method (MOSKOWITZ, 1983) with pre-selected tasters aged between 20 and 42 years (10 women and 2 men). In this section, samples of light and traditional yogurts were acquired from local commerce followed by a list of possible attributes. A list of descriptive sensory
terms (flavor, taste, aroma, texture, and color) that
characterized the sample was prepared. The team, tasters, and a mediator met and, throughan open discussion, chose by consensus the most appropriate and important sensory terms that actually described the yogurt samples. The terms were used to compile the CATA form. Approximately 20g of the formulations at 12°C, which wereunder study, were presented to 50 consumers. Water was served to consumers to wash their palate between each sample. All consumers were asked to record
all possible flavor, aroma, texture, taste, and color
attributes according to the CATA test sheet (Figure 1) to describe the evaluated product (ARES et al. al., 2014). The sample presentation order was balanced.
Statistical analysis
The acceptance test results were evaluated using analysis of variance (A NOVA) and a regression
analysis using the MINITAB 15 software. The attributes chosen by the trained team were used to elaborate the internal and external preference maps through the SENSOMAKER software. For the preparation of the internal preference map, the samples were used as the abscissa (X axis) and the consumers’ scores were used as the ordinate (Y axis) in SENSOMAKER. The software preprocesses the data using a correlation matrix. The plot was a vector type. For the preparation of the external preference map, the formulations were used as the X axis and the frequency of the descriptors obtained with the CATA method were used as the Y axis. Date were pre-processed by SENSOMAKER through a correlation matrix and plotting vector-type graphs
using α=0.20, in agreement with the consumers.
RESULTS AND DISCUSSION
Microbiological analysis
The nine samples evaluated presented satisfactory results when compared to the limits established by current legislation (BRASIL, 2007), which limits values for indicative samples: Total Coliform less than 100MPN. mL-1, Coliform at 45oC was lower than 10MPN.mL-1 and
Yeasts lower than 200CFU.mL-1 for indicative sample.
Sensory analysis
Twelve tasters matched >60% of the applied tests and were selected to participate in the
attribute survey. The terms that best characterized the yogurt samples were selected by the team after discussion and consensus (Figure 1). A new results for processed yogurts in which the regression model
was statistically significant (α =0.05) are presented in
table 2. Results of t-test of the coefficients at the 5%
probability level were also significant (Table 3). The mathematical model used was as follows: equation (1)
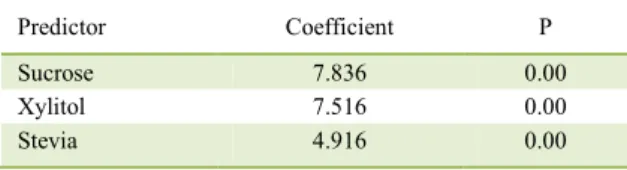
The coefficients of Eq. (1) indicated
that acceptance of the yogurt is better when high proportion of sugar and xylitol is used. As the stevia ratio increases, product acceptance decreases. Results of the evaluation of samples sensory acceptability are graphically represented in Figure 2. Use of xylitol did not promote rejection by the consumers and was within the range of acceptance, unlike the sample with stevia that had a higher index for a minor addition.
Figure 3 graphically represents the internal preference map, high light in the behavior of BRASIL (2007) tasters in relation to sample acceptance for the overall impression atribute. Consumers are Figure 3 graphically represents the internal preference map. Consumers are represented by the vectors and samples are the squares. The closer the vectors and squares, the greater the acceptability
of the samples; a greater distance between them
indicates a greater rejection by tasters. Samples with a lower proportion of stevia presented a greater acceptance, except for F2 (0.5:0:0.5), which was accepted but was further away from the vectors.
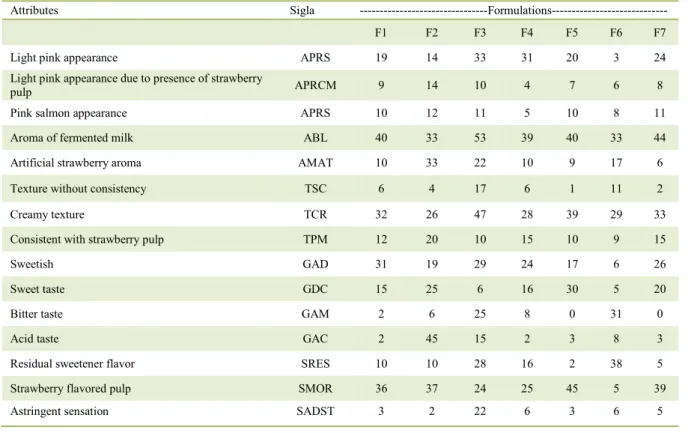
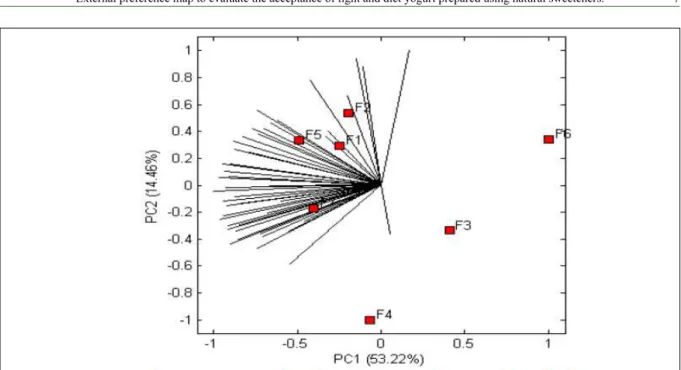
Table 4 shows the absolute frequency of each CATA term used by the tasters to describe the yogurt samples. Data obtained by the CATA method for each descriptor term together with acceptance data of the yogurts were evaluated by means of an external preference map. Forthe external preference map, we used a vector model
considering α=0.20 with 32 consumers out of a total of 50, which resulted in a correlation coefficient of R2=0.7975. This justifies the change that occurred in the acceptance of samples F2 and F4. The first two principal components
(PC1 and PC2) explained 64.29% of experimental data variance (37.81% and 26.48%, respectively).
The attributes of a light pink appearance
(APRC), sweetish (GAD), milk flavor aroma (ABL), strawberry flavor (SMOR), sweet taste (GDC),
consistency with strawberry pulp (TPM), and
creamy texture were identified in the formulations
F1, F5, and F7. Sample F4 stood out as having the creamiest texture (TCR). Sample F6 was separated
from the vectors;itpresented a residual flavor (SRES),
bitter taste (GAM), and texture without consistency
(TSC). Sample F3 was classified as astringent
(SADST)and F2 had an acid taste (GAC) and an
artificial strawberry aroma (AMAT), (Figure 4). CICCONE; DAMY-BENEDETTI (2017) verified acceptance in relation to sweetness, residual
taste, overall acceptance, and preference of cola-type soft drinks in the zero, light, and stevia versions. Stevia version comprised 50% sugar and 50% stevia and had an acceptance value of seven (moderately
liked) for all attributes analyzed. This finding is
similar to the acceptability of our F2 formulation. MAIA et al. (2008) elaborated on and evaluated consumer preference for ice cream formulations (cream, strawberry, and chocolate) sweetened with sucrose and xylitol. Ice cream sweetened with sucrose was preferred
over xylitol;however, the acceptability of xylitol was
considered high for the general appearance of the ice creams. YUYAMA et al. (2008) developed a “cubiu” (Solanum
sessiliflorum Dunal) jelly sweetened with xylitol and observed that its acceptability had similar results.
REIS (2007) studied the elaboration of strawberry light yogurts with different sweeteners, such as sucralose, aspartame, aspartame and acesulfame-k mixture, cyclamate and saccharin mixture, cyclamate, and saccharin and stevia mixture, using the internal preference mapping methodology. Similar product acceptance results were reported for processed yogurt with cyclamate, saccharin, and
stevia, which presented with an initial and final bitter
taste as the main characteristic and was the least accepted by consumers. BARBOSA (2009) reported similar results regarding the acceptance of light
Table 3 - Coefficient of regression of the global acceptance of yogurts.
Predictor Coefficient P
Sucrose 7.836 0.00
Xylitol 7.516 0.00
Stevia 4.916 0.00
R2 = 0.676.
Table 2 - Analysis of variance of the global acceptance of yogurts
Source Degrees Freedom
Mean
Square F p
Regression 2 3.2060 6.27 0.034 Linear 2 3.2060 6.27 0.034
Residue 6 0.5117
Lack of fit 4 0.7459 17.21 0.056 Pure error 2 0.0433
yogurt with stevia. UMBELINO (2005) reported the behavior of concentrated mango juice and frozen mango pulp, both reconstituted and sweetened with different sweeteners. A similar sensory characteristic
was observed when using stevia as the sweetener; it presented significantly higher attribute averages
for residual bitterness, bitterness, and acidity. BRITO (2009) evaluated the sensory behavior of
Figure 2 - Graphic representation of the global acceptance of yogurt formulations.
Table 4 - Frequency of citation of the descriptor terms used to characterize the yogurt evaluated by the CATA method.
Attributes Sigla ---Formulations---
F1 F2 F3 F4 F5 F6 F7
Light pink appearance APRS 19 14 33 31 20 3 24
Light pink appearance due to presence of strawberry
pulp APRCM 9 14 10 4 7 6 8
Pink salmon appearance APRS 10 12 11 5 10 8 11
Aroma of fermented milk ABL 40 33 53 39 40 33 44
Artificial strawberry aroma AMAT 10 33 22 10 9 17 6
Texture without consistency TSC 6 4 17 6 1 11 2
Creamy texture TCR 32 26 47 28 39 29 33
Consistent with strawberry pulp TPM 12 20 10 15 10 9 15
Sweetish GAD 31 19 29 24 17 6 26
Sweet taste GDC 15 25 6 16 30 5 20
Bitter taste GAM 2 6 25 8 0 31 0
Acid taste GAC 2 45 15 2 3 8 3
Residual sweetener flavor SRES 10 10 28 16 2 38 5
Strawberry flavored pulp SMOR 36 37 24 25 45 5 39
Astringent sensation SADST 3 2 22 6 3 6 5
different sweeteners in a guava pulp light drink (guava nectar) using different sweeteners. Stevia has a distinct behavior, presenting with a sweet taste, bitter taste, residual sweetness, residual bitterness and aroma, and a characteristic herb
flavor, thereby resulting in a lower acceptance rate.
The use of the simple centroid mixture design with three replicates at the central point
allowed us to define the sensory attributes of the formulations; together with the CATA technique,
Figure 3 - Internal preference map of yogurt formulations with different sweeteners. F1, xylitol/sucrose; F2, sucrose/stevia; F3, sucrose/ stevia/xylitol; F4, xylitol/stevia; F5, sucrose; F6, stevia; and F7, xylitol.
itelucidates how these attributes affect product acceptance. At the same time, the procedure allows
to define the proportions of the sweetener mixtures
for product acceptance. Results obtained reinforced the evaluation of the sweetening power of sweeteners conducted by ESMERINO et al. (2013), PAIXÃO et al. (2014), and ESMERINO et al. (2015).
Multivariate statistical techniques are very useful for analyzing complex data obtained from consumers or trained tasters. Advanced sensory techniques allow acquisition of relevant information about sensory attributes from the consumer. It is worth mentioning that the descriptors obtained from the consumer depend on several factors, because they are complex interactions between the product and the consumer, including consumer personality and previous familiarity and experience with the
product (GAZE et al., 2015; JANIASKI et al. 2016).
The CATA methodology is a technique that has been used to gather information about the perception of consumers regarding the sensory characteristics of a product. The CATA questionnaire format allows consumers to choose all possible attributes to describe the product from a list. The terms in the list can be generated by a panel of trained evaluators or by a group of consumers. As the method responses are directly linked to the consumer’s perception of product characteristics, these responses can be used to optimize
product acceptance. The CATA methodology is efficient
for describing and discriminating among products, and its main advantages are the simplicity and speed at which the
analyses are conducted. Studies comparing its efficiency
with the use of trained evaluators report high correlations among the evaluations, which evidenced that consumers are able to evaluate sensory attributes in a similar way. The main limitation is that the attribute intensityis not
quantified, i.e., it is not possible to select a lower power of
discrimination when the samples have small differences in
attribute intensity (ALCANTARA; FREITAS-SÁ, 2018).
CONCLUSION
Formulations F1 (0.5:0:0.5) and F7 (1.0:0:0) had high acceptance scores, which presented charac-teristics of sweet taste, creamy texture, strawberry pulp
flavor, dairy drink aroma, and light pink appearance.
Formulations F6 (0:1.0:0) and F3 (0.33:0.33:0.33) were less accepted because of their characteristics of
residual flavor, bitter taste, astringent mouth feel, and
inconsistent texture. Formulations containing xyli-tol are best suited for the manufacture of strawberry
diet and light yogurts, because the sensory profile
was the one that most approached traditional yogurt.
ETHICS COMMITTEE
This study was approved by the Human Research Ethics Committee of Instituto Federal do Sudeste de Minas Gerais (Opinion No. 2,104,000).
ACKNOWLEDGMENT
To Instituto Federal Sudeste de Minas Gerais.
DECLARATION OF CONFLICT OF INTEREST
The authors declared no potential conflicts of interest with respect to the research, authorship, and/or publication of this article.
REFERENCES
ALCANTARA, M. De; FREITAS-SÁ, D. D. G. C. Metodologias sensoriais descritivas mais rápidas e versáteis, uma atualidade na ciência sensorial. Brazilian Journal Food Technology, 2018. v. 21, p. 1–12. Available from: <http://dx.doi.org/10.1590/1981-6723.17916>. Accessed: Apr. 7, 2018. doi:10.1590/1981-6723.17916.
ARES, G. et al. Visual attention by consumers to check-all-that-apply questions: Insights to support methodological development.
Food Quality and Preference, 1 Mar. 2014. v. 32, p. 210–220. Available from: <http://www.sciencedirect.com/science/article/pii/ S0950329313001833>. Accessed: Dec. 21, 2017. doi:10.1016/j. foodqual. 2013.10.006.
BARBOSA, P. B. F. Efeito do edulcorante no perfil sensorial e na aceitação de iogurte natural desnatado batido (diet). 2009. Available from: <http://repositorio.unicamp.br/handle/REPOSIP/254226>. Accessed: Dec. 21, 2017.
BELSITO, P. C. et al. Manufacture of requeijão cremoso processed cheese with gal acto oligosaccharide. Carbohydrate Polymers, Oct. 15, 2017. v. 174, p. 869–875. Available from: <https://www.sciencedirect. com/science/article/pii/S0144861717307877?via%3Dihub>. Accessed: Mar. 21, 2018. doi: 10.1016/j.carbpol.2017.07.021.
BRASIL (Ed.). Métodos Físico-Químicos para Análise de Alimentos. 4. ed. Brasília: Ministério da Saúde, 2005.
BRITO, C. A. K. Perfil sensorial de bebida light de polpa de
goiaba adoçada com diferentes edulcorantes. Campinas, BRASIL: UNICAMP, 2009. Available from: <http://repositorio.unicamp.br/ handle/REPOSIP/254227>. Accessed: Dec. 21, 2017.
CICCONE, R. F.; DAMY-BENEDETTI, P. C. Aceitabilidade de refrigerantes tipo cola, nas versões light, zero e stévia. Revista Científica, 11 Oct. 2017. v. 1, n. 1. Available from: <http://revistas.unilago.edu.br/ index.php/revista-cientifica/article/view/23>. Accessed: Dec. 21, 2017.
ESMERINO, E. A. et al. The influence of sweeteners in probiotic petit puisse cheese in concentrations equivalent to that of sucrose. Journal of Dairy Science, 1 Sep. 2013. v. 96, n. 9, p. 5512–5521. Available from: <https:// www.sciencedirect.com/science/article/pii/S002203021300461X>. Accessed: Feb. 5, 2018. doi: 10.3168/jds.2013-6616.
A comparative case with Greek yogurt samples. Food Research International, 1 Sep. 2017. v. 99, p. 375–384. Available from: <https:// www.sciencedirect.com/science/article/pii/S0963996917302533>. Accessed: Feb. 5, 2018. doi: 10.1016/j.foodres.2017.06.001.
ESMERINO, E. A. et al. Survival analysis: A consumer-friendly method to estimate the optimum sucrose level in probiotic petit suisse.
Journal of Dairy Science, 1 Nov. 2015. v. 98, n. 11, p. 7544–7551. Available from: <https://www.sciencedirect.com/science/article/ pii/S0022030215006682>. Accessed: Feb. 5, 2018. doi: 10.3168/ jds.2015-9651.
FONSECA, F. G. A. et al.Novel and successfull free comments method for sensory characterization of chocolate ice cream: A comparative study between pivot profile and comment analysis.
Journal of Dairy Science, 1 May. 2016. v. 99, n. 5, p. 3408–3420. Available from: <https://www.sciencedirect.com/science/article/ pii/S0022030216001685>. Accessed: Feb. 5, 2018. doi: 10.3168/ jds.2015-9982.
FREITAS, M. Q. Características e aceitação sensorial de mortadelas produzidas com carne mecanicamente separada de frango. Viçosa, Brasil: Universidade Federal de Viçosa, 2002. Available from: <http:// www.locus.ufv.br/handle/123456789/8974?show=full>. Accessed: Dec. 21, 2017.
GAZE, L. et al. Preference mapping of dulce de leche commercialized in brazilian markets. Journal of Dairy Science, 2015. v. 98, n. 3, p. 1443–1454. Available from: <http://www.journalofdairyscience.org/ article/S0022-0302(14)00905-9/pdf>. Accessed: Mar. 26, 2018. doi: 10.3168/jds.2014-8470.
JANIASKI, D. R. et al. Strawberry-flavored yogurts and whey beverages: What is the sensory profile of the ideal product? Journal of Dairy Science, 1 Jul. 2016. v. 99, n. 7, p.
5273–5283. Available from: <http://www.ncbi.nlm.nih.gov/ pubmed/27157581>. Accessed: Mar. 26, 2018.
MAIA, M. C. A. et al.Avaliação do consumidor sobre sorvetes com xilitol consumer evaluation of ice cream with xylitol. Journal of Dairy Science, 2008. v. 28, n. 2, p. 341–347. Available from: <http://www.scielo.br/pdf/cta/v28n2/a11v28n2.pdf>. Accessed: Dec. 21, 2017. doi: 10.3168/jds.2015-10097.
MINIM, V. P. R. Análise sensorial: Estudos com consumidores. 2. ed. Viçosa: Editora UFV, 2010.
MORAIS, E. C. et al. Development of chocolate dairy dessert with addition of prebiotics and replacement of sucrose with different high-intensity sweeteners. Journal of Dairy Science, 1 May. 2014. v. 97, n. 5, p. 2600–2609. Available from: <http://www.ncbi. nlm.nih.gov/pubmed/24612793>. Accessed: Feb. 5, 2018. doi: 10.3168/jds.2013-7603.
MOSKOWITZ, H. R. Product testing and sensory evaluation of foods: Marketing and R&D approaches. Westport, Conn., USA: Food & Nutrition Press, 1983.
MUSSATTO, S. I.; ROBERTO, I. C. Xilitol: Edulcorante com efeitos benéficos para a saúde humana. Revista Brasileira de Ciências Farmacêuticas, Dec. 2002. v. 38, n. 4, p. 401–413. Available from: <http://www.scielo.br/scielo.php?script=sci_arttext&pid=S1516-93322002000400003&lng=pt&nrm=iso&tlng=pt>. Accessed: Oct. 7, 2016. doi:10.1590/S1516-93322002000400003.
NETO, B. B.; SCARMINIO, I. S.; BRUNS, R. E. Como fazer experimentos: Pesquisa e desenvolvimento na ciência e na indústria. 2. ed. Campinas: Editora Unicamp, 2003.
OLIVEIRA, E. W. et al. Reformulating Minas Frescal cheese using consumers’ perceptions: Insights from intensity scales and check-all-that-apply questionnaires. Journal of Dairy Science, 1 Aug. 2017. v. 100, n. 8, p. 6111–6124. Available from: <https:// www.sciencedirect.com/science/article/pii/S0022030217305234>. Accessed: Feb. 5, 2018. doi: 10.3168/jds.2016-12335.
PAIXÃO, J. A. et al. Influence of temperature and fat content on ideal sucrose concentration, sweetening power, and sweetness equivalence of different sweeteners in chocolate milk beverage. Journal of Dairy Science, 1 Dec. 2014. v. 97, n. 12, p. 7344–7353. Available from: <https:// www.sciencedirect.com/science/article/pii/S0022030214007553>. Accessed: Feb. 5, 2018. doi: 10.3168/jds.2014-7995.
REIS, R. C. Iogurte light sabor morango: Equivalência de doçura, caracterização sensorial e impacto da embalagem na intenção de compra do consumidor. Viçosa, Brasil: Universidade Federal de Viçosa, 2007. Available from: <http://www.locus.ufv.br/ handle/123456789/501>. Accessed: Dec. 21, 2017.
RODRIGUES, J. S. Q. et al. Qualidade sensorial de néctares de maracujás BRS Ouro Vermelho produzidos em diferentes sistemas de cultivo. Revista Ceres, Oct. 2013. v. 60, n. 5, p. 595–602. Available from: <http://www.scielo.br/scielo. php?script=sci_arttext&pid=S0034-737X2013000500001&lng =pt&tlng=pt>. Accessed: Dec. 21, 2017. doi: 10.1590/S0034-737X2013000500001.
SILVA, F. De A. S. E; DUARTE, M. E. M.; CAVALCANTI-MATA, M. E. R. M. Nova metodologia para interpretação de dados de análise sensorial de alimentos. Engenharia Agrícola, Oct. 2010. v. 30, n. 5, p. 967–973. Available from: <http:// www.scielo.br/scielo.php?script=sci_arttext&pid=S0100-69162010000500018&lng=pt&nrm=iso&tlng=pt>. Accessed: Oct. 7, 2016. doi:10.1590/S0100-69162010000500018.
SILVA, N. et al. Manual de métodos de análise microbiológica de alimentos e água. 5. ed. São Paulo: Blucher, 2017.
TORRES, F. R. et al. Rapid consumer-based sensory characterization of requeijão cremoso, a spreadable processed cheese: Performance of new statistical approaches to evaluate check-all-that-apply data. Journal of Dairy Science, 1 Aug. 2017. v. 100, n. 8, p. 6100–6110. Available from: <https://www. sciencedirect.com/science/article/pii/S0022030217305404>. Accessed: Feb. 5, 2018. doi: 10.3168/jds.2016-12516.
UMBELINO, D. C. Caracterização sensorial por analise descritiva quantitativa e analise tempo-intensidade de suco e de polpa de manga (Mangifera indica L.) adoçados com diferentes edulcorantes. [S.l.]: [s.n.], 2005. Available from: <http://repositorio.unicamp.br/handle/REPOSIP/254238>. Accessed: Dec. 21, 2017.