Introduction
Motivation in Physical Education (PE) classes has been a focus of study and concern on the part of several researchers. Given the characteristics of the class and students, physical educa-tion teachers need to better understand how to improve their intervention, helping students achieving the warranted effects
of PE. This can pose a dificult task when contextual motivation
of students changes across time1.
Self-Determination Theory (SDT2) has been one of the main frameworks used to study motivational processes throughout the
last 30 years. This theory includes several mini-theories. One of its mini-theories (Cognitive Evaluation) postulates that two
types of motivation inluence one’s behavior. When someone
is doing an activity for the inherent pleasure or interest, it is considered that the person is intrinsically motivated; on the opposite side, performing an activity for instrumental reasons, to avoid disapproval or obtain separable outcomes
character-izes an extrinsically motivated person. If an individual does not
perceive a worthwhile reason to participate in an activity, then
there is an absence of intrinsic or extrinsic motivation – deined
in SDT as amotivation3,4.
In Deci and Ryan2,5 seminal work, it has been proposed that the different types of motivation are expressed in a continuum that relects the individual’s level of self-determination. According to the Organismic Integration Theory, extrinsic motivation is
composed of four behavioral regulations increasing in their de-gree of self-determination or autonomy. The less self-determined
form of extrinsic motivation is external regulation, which relects the inluence of external pressures or rewards on the behavior. Next, introjected regulation relects self-imposed pressures like
guilt, shame or ego protection. These two behavioral regulations
express a form of external control in the individual behavior. Identiied regulation, which refers to the recognition and accep -tance of the impor-tance of a behavior, and integrated regulation, manifesting the pursuit of an activity because it is in line with
one’s core values and sense of self, represent a gradual transi
-tion to more autonomous forms of motiva-tion. In SDT, these regulatory mechanisms relect a degree of internalization of the behavior, facilitating the understanding of exercise behavior in several contexts. Previous studies have showed that more
autonomous forms of motivation are positively associated with
exercise behavior and continuous adherence6, higher levels of
concentration in PE7, better affective outcomes8,9 and preference to engage in challenging tasks7,8.
Throughout the years, SDT2,10 has sustained the develop-ment of several instrudevelop-ments to assess student’s perceptions
about their motivation11. However, these instruments are
created and validated in a particular language and culture and may not accurately measure what is intended after being translated and/or adapted to a new setting, culture or language. Despite cross-cultural validations and the universality of SDT principles, little attention has been given to the validity scores of some of the most popular SDT-based measure-ment instrumeasure-ments12.
One of these instruments is the Perceived Locus of Causality
Questionnaire (PLOCQ), which is used to assess contextual
motivation towards PE. This instrument was initially developed
by Goudas, Biddle and Fox13 through an adaptation of the Self-Regulation Questionnaire developed by Ryan and Connell14.
Their aim was to create a scale that encompassed the full range
of the SDT behavioral regulation spectrum (except for integrated Original Article (short paper)
Translation and validation of the perceived locus
of causality questionnaire (PLOCQ) in a sample
of portuguese physical education students
Diogo S. Teixeira1, Diogo Monteiro2,4, Eliana Carraça1,3, António L. Palmeira1,3
1Universidade Lusófona de Humanidades e Tecnologias, ULHT, Faculty of Physical Education and Sport, Lisboa, Portugal; 2 Es-cola Superior de Desporto de Rio Maior, ESDRM-IPSANTARÉM, Rio Maior, Portugal; 3Universidade de Lisboa, Interdisciplina-ry Center for the Study of Human Performance, CIPER, Faculty of Human Kinetics, Lisboa, Portugal; 4Universidade de Trás-os-Montes e Alto Douro, Centro de Investigação em Desporto, Saúde e Desenvolvimento Humano, CIDESD, Vila Real, Portugal
Abstract — Aim: This study main aim was to translate and validate one of the most used SDT-based instruments to
assess motivation in PE classes, the Perceived Locus of Causality Questionnaire (PLOCQ), to the Portuguese context. Method: Sample was composed of 652 boys (M=15.4 years; SD=1.90) and 702 girls (M=15.47 years; SD=1.95), enrolled in physical education classes in several Portuguese schools. Results: The analysis provided support for a ive factors and 18 items model, after excluding two items (χ² = 491.473, df = 125, p = <.001, SRMR = .062, NNFI = .908, CFI = .924, RMSEA = .067, 90% CI .061-.073). Sample and gender invariance procedures were made to ensure proper psychometric validation. Results presented support for the model in both gender and calibration/validation samples. Conclusion: This study suggests that PLOCQ with ive factors and 18 items has good psychometric properties and can be used to assess contextual motivation towards PE in the Portuguese context.
regulation). To measure amotivation, the Vallerand, Pelletier, Blais, Brière, Senécal, Vallières15 subscale of the academic
Motivation Scale was used.
Psychometric testing supported the reliability and validity of the PLOCQ subscales7,16,17. Yet, some issues with the internal consistency of introjected regulation scores and the discriminant validity of identiied regulation and intrinsic motivation scores were
reported7,16. Posteriorly, Lonsdale, Sabiston, Taylor, Ntoumanis12
provided further psychometric analysis and cross-cultural valida-tion of the instrument. Currently, the PLOCQ is considered as a valid and useful instrument to assess what it proposes.
In the Portuguese context, PLOCQ has been widely used in the PE context in the last years. However, to our knowledge, no
psychometric validation was made to ensure its feasibility in
this particular language and context, an overly due problem in this ield of study. Therefore, this study sought to translate and
validate one of the most used SDT-based instruments to assess motivation in PE classes, the Perceived Locus of Causality
Questionnaire (PLOCQ), to the Portuguese context. Psychometric
proprieties and invariance across gender were evaluated to ensure proper instrument feasibility.
Method
Participants
Two independent samples of PE students were used in this study to ensure the robustness of the measurement instrument in a sample of the same population.
The irst set of participants consisted of 699 students and
represented the calibration sample, with ages comprised between 12 and 23 years old (M=15.49; SD=1.93), and enrolled in two PE
classes/week (135 min total). The validation sample was composed
of 655 students, with ages between 12 and 23 years old (M=15.47;
SD=1.88), and had the same amount of PE/week than previous
sample. The global sample comprised 652 boys (M=15.4 years; SD=1.90) and 702 girls (M=15.47 years; SD=1.95).
Measures
The Perceived Locus of Causality questionnaire12 (PLOCP) was translated and adapted to the Portuguese context. The PLOCPp consists of 20 items with a seven-point Likert scale, ranging from 1 (“Strongly Disagree”) to 7 (“Strongly Agree”). The items are grouped into ive factors (with four items each), which relect the behavioral regulations encompassed in the
SDT motivational continuum.
Procedures Data collection
For the study data collection, authorizations were obtained
from the school direction board. All participants enrolled
voluntarily and provided an informed consent signed by
them and their legal guardian. Conidentiality was guaran
-teed and ensured. Before a PE class, a brief explanation of
the study purposes was made and confortable conditions were provided to the completion of the questionnaire. The
University Scientiic Board approved this study with the
number 1/2014-2015.
Procedures of translation of the PLOCQp
For the translation and adaptation of the PLOCQ12 from the
original language (English) to Portuguese, several methodologi-cal procedures were adopted18,19. Despite using the translation/ back translation technique, we employed the committee ap -proach methodology20. This process was developed according
to the following steps: 1) Preliminary Translation; 2) First Committee; 3) Second Committee (this stage was over only when all the specialists agreed with each other and their opinion was unanimous towards the item contents); 4) Pilot Study; 5)
Final Review (only syntax aspects).
Data analysis
Descriptive statistics including means and standard devia-tions, for the two samples were calculated for all variables. To
undertake the conirmatory factor analysis, the recommenda -tions of Byrne21,22,23 regarding the use of the estimated method of maximum likelihood (ML), chi-squared (χ²) testing of the respective degrees of freedom (df), and the level of signiicance (p) were used. Also, the following adjustment goodness-of-it indexes were used: Standardized Root Mean Square Residual (SRMR), Comparative Fit Index (CFI), Non-Normed Fit Index (NNFI), Root Mean Square Error of Approximation (RMSEA) and the respective conidence interval (90% CI). Traditionally, NNFI and CFI values ≥ .90 and RMSEA and SRMR ≤ .08 have been used as cut-off criteria. Additionally, the convergent validity was analyzed (to check if the items were related to the respec
-tive factor) via the calculation of the average variance extracted (AVE), considering values of AVE ≥ .5022 and the composite reliability (CR) was analyzed to assess the internal consistency of the factors, adopting CR ≥ .70 as the cut-off values, as sug
-gested by Hair, Black, Babin, Anderson22. To examine if there
was a distinction between factors (i.e. discriminant validity), the relation of the values of the square of the correlation between the
factors was used; variance extracted estimates should be greater than the squared correlation estimate. To check the assumptions
of the nomological validity of the PLOCQ, Pearson correlational analyses were used between the PLOCQ and the different types
Multi-group analysis
A multi-group analysis is one of the crucial aspects in
the development and use of psychometric instruments24,25,
because it demonstrates if the measurement model structure is equivalent (invariant) across different groups with different characteristics (in the present study, across samples and
gen-der). According to several authors21,24, invariance exists when two criteria are veriied: the measurement model is adjusted to
each group and to perform a multi-group analysis, considering
the following invariance types: conigural invariance (model
without constraints), metric invariance (equality of factorial weights), scalar invariance (factorial weights and covariance equals) and residual invariance (factorial weights, covariance and equal measure errors) were assessed. Differences in values between the models without constrains (free parameters) vs.
models with constrains (ixed parameters) should be veriied through the difference in the Δχ² test or by the differences in ∆CFI ≤ .0124.
Nomological validity
To analyze if constructs in a same theory framework make
sense, a correlational analysis was made between the PLOCQ
factors and another SDT based instrument – Engagement Scale
(translated and validated by others; in preparation). This scale has four factors and 14 items: the Behavioral Engagement factor
is composed by three items, and relects how students engage in tasks in organizational settings26; the Agentic engagement is as
-sessed by four items that tap into the students self-motivational supportive learning27; the Cognitive Engagement has three
items based in achievement goal theory28 that relect students orientations in exercise practice; the Emotional Engagement
has four items to assess emotional and affective dynamics in
social tasks26.
Results
Preliminary Analysis
A primary analysis of the data revealed that there were 10 multivariate outliers (i.e. six in the calibration sample; four in
the validation sample) (D2 = p1 < 0.01; p2 < 0.01). These par-ticipants were removed prior to conducting any further analysis, as postulated by several authors21,22. Additionally, Mardia’s coef -icient for multivariate kurtosis in all samples was higher than ive (calibration sample = 46.56; validation sample = 77.25), exceeding expected values for the assumption of multivariate
normality21. Therefore, Bollen-Stine bootstrap with 2000 samples
was employed for subsequent analysis29.
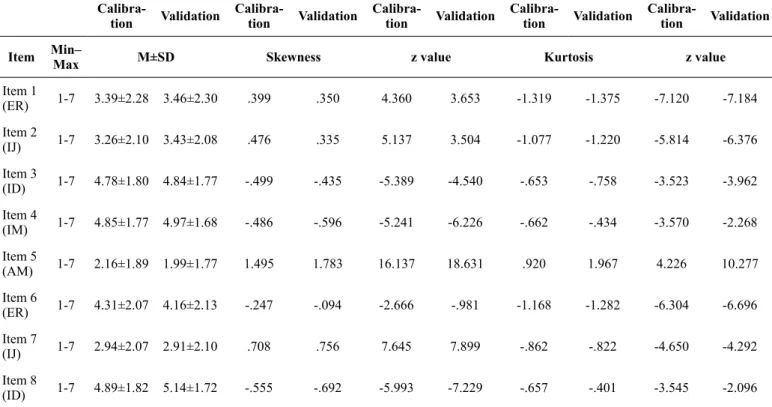
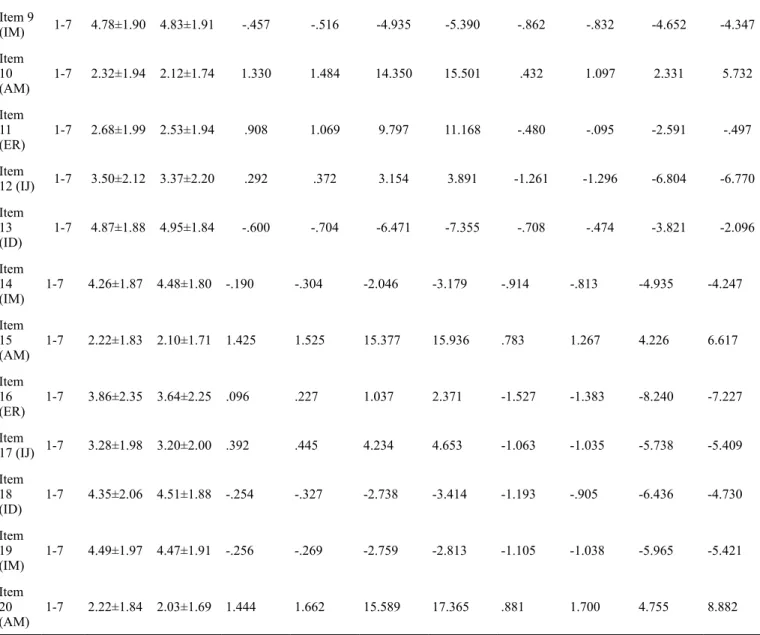
Descriptive analyses in Table 1 tend to show a normal univari-ate distribution of the data in both samples, with a slight bias to the right, and the tendency of answering near the center of the
bi-polar Likert scale (i.e., three and four in a seven point scale).
Table 1 Descriptive analysis of the answers to the items on the PLOCQ in the calibration and validation samples
Calibra-tion Validation
Calibra-tion Validation
Calibra-tion Validation
Calibra-tion Validation
Calibra-tion Validation
Item Min–
Max M±SD Skewness z value Kurtosis z value
Item 1
(ER) 1-7 3.39±2.28 3.46±2.30 .399 .350 4.360 3.653 -1.319 -1.375 -7.120 -7.184
Item 2
(IJ) 1-7 3.26±2.10 3.43±2.08 .476 .335 5.137 3.504 -1.077 -1.220 -5.814 -6.376
Item 3
(ID) 1-7 4.78±1.80 4.84±1.77 -.499 -.435 -5.389 -4.540 -.653 -.758 -3.523 -3.962
Item 4
(IM) 1-7 4.85±1.77 4.97±1.68 -.486 -.596 -5.241 -6.226 -.662 -.434 -3.570 -2.268
Item 5
(AM) 1-7 2.16±1.89 1.99±1.77 1.495 1.783 16.137 18.631 .920 1.967 4.226 10.277
Item 6
(ER) 1-7 4.31±2.07 4.16±2.13 -.247 -.094 -2.666 -.981 -1.168 -1.282 -6.304 -6.696
Item 7
(IJ) 1-7 2.94±2.07 2.91±2.10 .708 .756 7.645 7.899 -.862 -.822 -4.650 -4.292
Item 8
In Table 2, it is possible to see that the initial model (i.e., ive factor and 20 items) did not have a good adjust
-ment to the data. An analysis of the residual values between items and the modiication indexes, allowed the identiica
-tion of some fragilities. The model was readjusted with the
elimination of two items (see inal models in table 2; see igure 1), and relected an improvement in the adjustment indexes, being in line with the values adopted in the meth -odology for each of the analyzed samples (i.e. calibration, validation and gender).
Item 9
(IM) 1-7 4.78±1.90 4.83±1.91 -.457 -.516 -4.935 -5.390 -.862 -.832 -4.652 -4.347
Item
10
(AM) 1-7 2.32±1.94 2.12±1.74 1.330 1.484 14.350 15.501 .432 1.097 2.331 5.732
Item
11
(ER) 1-7 2.68±1.99 2.53±1.94 .908 1.069 9.797 11.168 -.480 -.095 -2.591 -.497
Item
12 (IJ) 1-7 3.50±2.12 3.37±2.20 .292 .372 3.154 3.891 -1.261 -1.296 -6.804 -6.770 Item
13
(ID) 1-7 4.87±1.88 4.95±1.84 -.600 -.704 -6.471 -7.355 -.708 -.474 -3.821 -2.096
Item
14
(IM) 1-7 4.26±1.87 4.48±1.80 -.190 -.304 -2.046 -3.179 -.914 -.813 -4.935 -4.247
Item
15
(AM) 1-7 2.22±1.83 2.10±1.71 1.425 1.525 15.377 15.936 .783 1.267 4.226 6.617
Item
16
(ER) 1-7 3.86±2.35 3.64±2.25 .096 .227 1.037 2.371 -1.527 -1.383 -8.240 -7.227
Item
17 (IJ) 1-7 3.28±1.98 3.20±2.00 .392 .445 4.234 4.653 -1.063 -1.035 -5.738 -5.409 Item
18
(ID) 1-7 4.35±2.06 4.51±1.88 -.254 -.327 -2.738 -3.414 -1.193 -.905 -6.436 -4.730
Item
19
(IM) 1-7 4.49±1.97 4.47±1.91 -.256 -.269 -2.759 -2.813 -1.105 -1.038 -5.965 -5.421
Item
20
(AM) 1-7 2.22±1.84 2.03±1.69 1.444 1.662 15.589 17.365 .881 1.700 4.755 8.882
Note. AM (Amotivation); EX (External Regulation); IJ (Introjected regulation); ID (Identiied regulation); IM (intrinsic motivation); M (Mean); SD (Standard deviation)
Table 2 Fit indices of the measurement models of PLOCQp (including existing versions)
Models χ² df p SRMR NNFI CFI RMSEA 90% CI
PLOCQ1 971.83* 320 - .090 .950 .960 .080 .070-.080
Initial Model Calibration 915.351 160 <.001 .067 .861 .883 .082 .951-1.224
Final Model Calibration 542.004 125 <.001 .061 .908 .925 .069 .063-.075
Final Model Validation 491.473 125 <.001 .062 .908 .924 .067 .061-.073
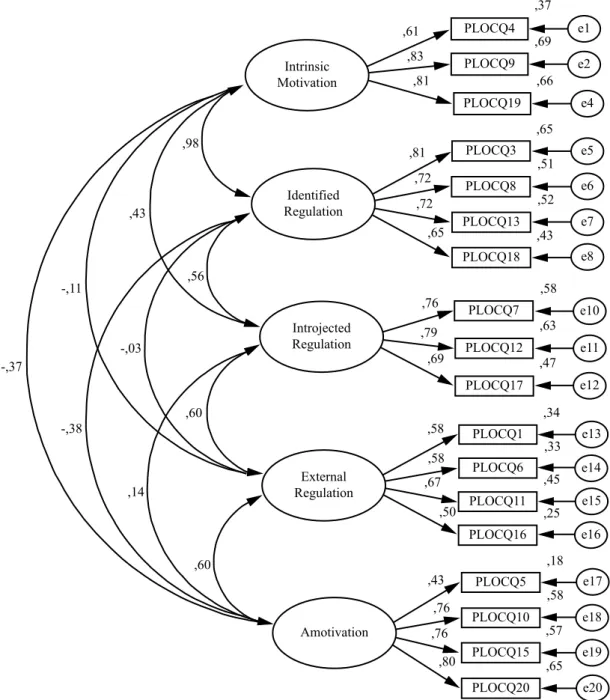
In the model depicted in igure 1, ordered relations between correlated variables appear, relecting the simplex structure which is characteristic of the SDT framework14, meaning that
behavioral regulations closer to each other are positively cor-related, and regulations further away in the continuum have
weaker or negative correlations.
Factorial weights in each factor presented statistical differences
after model adjustment (all p<.05), indicating factorial validity. In
the calibration sample, factorial weights varied between .66 and
.88 for Intrinsic Motivation, .68 and .82 for Identiied Regulation, .68 and .80 for Introjected Regulation, .59 and .65 for External Regulation and .51 and .77 for Amotivation. In the validation sample, values ranged between .61 and .83 for Intrinsic Motivation, .69 and .81 for Identiied Regulation, .69 and .79 for Introjected Regulation, .50 and .67 for External regulation and .43 and .80 for Amotivation. Except for item 16 (validation sample), all the other items explained more than 25% of the variance of the latent factor (λij² ≥ .25), as recommended by Hair, Black, Babin, Anderson22.
Figure 1 Standardized individual parameters (covariance factors, factorial weights and measurement errors), all of which were signiicant in the
measurement model (PLOCQp - Five factors/18 items) for the Portuguese calibration sample
Intrinsic Motivation Identified Regulation Introjected Regulation External Regulation Amotivation PLOCQ4 PLOCQ9 PLOCQ19 PLOCQ3 PLOCQ8 PLOCQ13 PLOCQ18 PLOCQ7 PLOCQ12 PLOCQ17 PLOCQ1 PLOCQ6 PLOCQ11 PLOCQ16 PLOCQ5 PLOCQ10 PLOCQ15 PLOCQ20 e1 e2 e4 e5 e6 e7 e8 e10 e11 e12 e13 e14 e15 e16 e17 e18 e19 e20 ,43 ,77 ,73 ,67 ,51 ,53 ,46 ,50 ,64 ,47 ,41 ,35 ,38 ,42 ,26 ,59 ,59 ,52 ,72 ,77 ,77 ,51 ,65 ,62 ,59 ,64 ,68 ,80 ,71 ,68 ,73 ,71 ,82 ,85 ,88 ,66 ,59 ,47 ,52 ,98 ,38 -,23 -,43 ,11 -,13 -,45
Female Model 560.320 125 <.001 .068 .904 .921 .070 .065-.076
Engagement2 7413.507 91 <.001 .043 .913 .932 .069
-Note. χ² = chi-squared; * values reported by the authors concerning the Satorra-Bentler correction of χ² (S-Bχ²); df = degrees of freedom; SRMR = Standardized
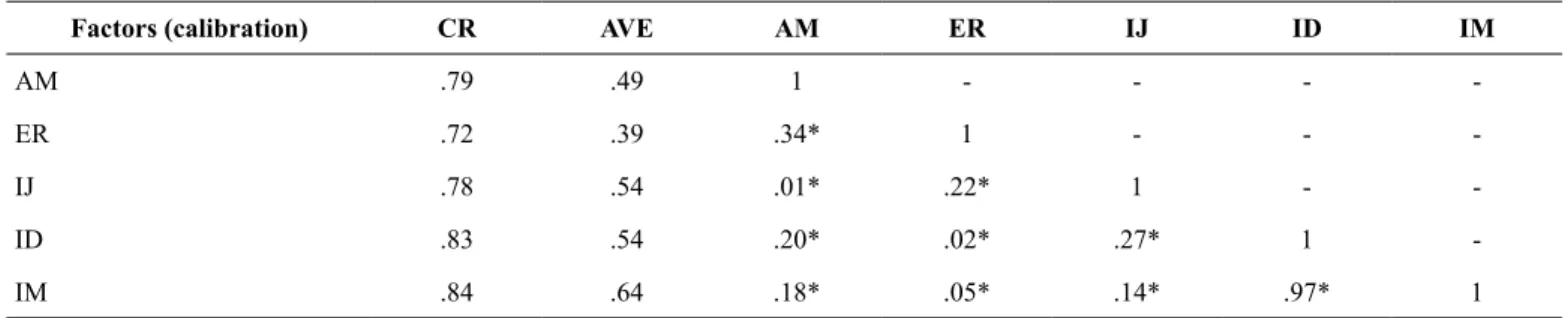
Results in table 3 show that most factors in the measurement model presented an adjusted composite reliability (≥ .70). The only exception was for external regulation in the validation sample, where CR= .67 is considered acceptable when other indicators of construct validity are good (Hair, Black, Babin, Anderson22). Concerning convergent validity, the AVE was calculated and
presented minor issues in both samples, as some values were
under the adopted in methodology (CS amotivation and external regulation < .50; VS external regulation < .50)22. In the dis
-criminant validity analysis, some issues were detected in intrinsic
motivation-identiied regulation for the calibration sample and external regulation-amotivation and intrinsic motivation-identiied
regulation in the validation sample, where the square of the
fac-tor’s correlations between factors were higher than the AVE22.
Figure 2 Standardized individual parameters (covariance factors, factorial weights and measurement errors), all of which were signiicant in the
measurement model (PLOCQp - Five factors/18 items) for the Portuguese validation sample
Intrinsic Motivation Identified Regulation Introjected Regulation External Regulation Amotivation ,37 ,69 ,66 ,65 ,51 ,52 ,43 ,58 ,63 ,47 ,34 ,33 ,45 ,25 ,18 ,58 ,57 ,65 e1 e2 e4 e5 e6 e7 e8 e10 e11 e12 e13 e14 e15 e16 e17 e18 e19 e20 ,61 ,83 ,81 ,81 ,72 ,72 ,65 ,76 ,79 ,69 ,58 ,58 ,67 ,50 ,43 ,76 ,76 ,80 PLOCQ4 PLOCQ9 PLOCQ19 PLOCQ3 PLOCQ8 PLOCQ13 PLOCQ18 PLOCQ7 PLOCQ12 PLOCQ17 PLOCQ1 PLOCQ6 PLOCQ11 PLOCQ16 PLOCQ5 PLOCQ10 PLOCQ15 PLOCQ20 ,60 ,60 ,56 ,98 ,43 -,03 ,14 -,38 -,11 -,37
Table 3 Internal reliability, convergent and discriminant validity and average variance extracted – Calibration and Validation samples
Factors (calibration) CR AVE AM ER IJ ID IM
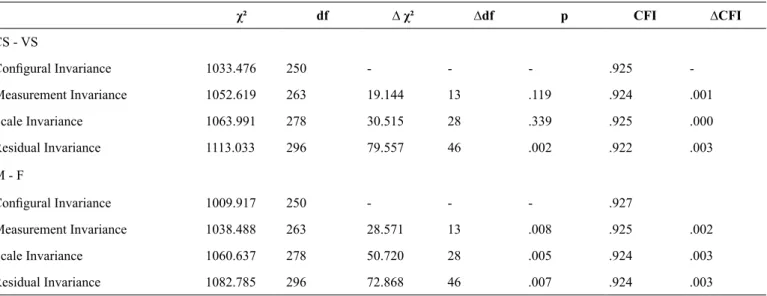
-According to the results in table 2, all samples presented a good adjustment (i.e., calibration, validation, male and female samples). The invariance analysis of these models is expressed in
table 5, where results point to invariant models between samples (i.e., cross validation across calibration and validation samples; invariance across genders). These results suggest the following:
in the conigural invariance, the same number of factors was
present in each group, remaining associated with the same group of items; in metric invariance, the factors of PLOCQp had the
same understanding for both groups; in scale invariance, the latent and observable means were compared and valid among groups; in residual invariance, comparison between observable items was supported.
Finally, nomological validity procedures showed a clear and SDT-coherent relation between PLOCQp and EEp. The autonomous types of motivation were positively related with
all forms of student’s engagement, and the controlled types presented weaker or negative associations with engagement.
ER .72 .39 .34* 1 - -
-IJ .78 .54 .01* .22* 1 -
-ID .83 .54 .20* .02* .27* 1
-IM .84 .64 .18* .05* .14* .97* 1
Factors (validation) CR AVE AM ER IJ ID IT
AM .79 .50 1 - - -
-ER .67 .34 .36* 1 - -
-IJ .73 .56 .02* .36* 1 -
-ID .82 .53 .15* <.001* .31 1
-IM .70 .57 .13* .13* .19* .97* 1
Note. Composite Reliability (CR); Average Variance Extracted (AVE); AM= amotivation; EX: external regulation; IJ: introjected regulation; ID= identiied regulation; IM= intrinsic motivation; * (r2).
Table 4 Fit indices for the invariance of the measurement model of the PLOCQ in the Portuguese sample across samples and gender
χ² df ∆ χ² ∆df p CFI ∆CFI
CS - VS
Conigural Invariance 1033.476 250 - - - .925
-Measurement Invariance 1052.619 263 19.144 13 .119 .924 .001
Scale Invariance 1063.991 278 30.515 28 .339 .925 .000
Residual Invariance 1113.033 296 79.557 46 .002 .922 .003
M - F
Conigural Invariance 1009.917 250 - - - .927
Measurement Invariance 1038.488 263 28.571 13 .008 .925 .002
Scale Invariance 1060.637 278 50.720 28 .005 .924 .003
Residual Invariance 1082.785 296 72.868 46 .007 .924 .003
Note. χ² = chi-squared; df = degrees of freedom; ∆χ² = differences in the value of chi-squared; ∆df = differences in the degrees of freedom; CFI = Comparative Fit
Index; ∆CFI = differences in the value of the Comparative Fit Index
Table 5 Nomological validity
Variables Intrinsic Identiied Introjected External Amotivation
Behavioral Engagement .688** .703** .356** -.133 -.372**
Discussion
The purpose of this study was to translate and validate the Perceived Locus of Causality Questionnaire (PLOCQ) to the
Portuguese context. Psychometric properties and invariance across samples (i.e., cross-validation) and gender were exam -ined to ensure proper instrument feasibility and to provide to PE professionals an instrument capable of assessing the moti-vational continuum in students, contributing also towards what
Deci and Ryan30 called the development of knowledge regarding
the universality of underlying variables of SDT which, in this
speciic case, is related with the behavioral regulation within a PE context.
Psychometric analysis of the Portuguese version of the
PLOCQ showed that the initial hypothesized model (ive fac
-tors / 20 items) did not it the pre-deined values adopted in
methodology21,22,23. For this matter, individual parameters were analyzed, and two items (intrinsic motivation– 14; introjected regulation – 2) were removed because they showed associations with other factors (e.g., the item 2, “Because I want the PE teacher to think I am a good student” presented an association with external regulation). This may suggest that proximity in motivational continuum relects some dificulty in interpreting
what was supposed in students with this particular question. Some authors have also suggested that, when analyzing the
mo-tivational continuum in exercise settings, a bivalent introjected regulation may, in some individuals, relect a more positive
or negative valence31.32 that may justify these interpretations. After these items removal, the inal model (i.e., ive factors / 18 questions) presented good adjustment values in all samples and was in line with the pre-deined methodology requirements.
Further analysis also revealed good psychometric properties.
According to Hair, Black, Babin, Anderson22, construct validity is deined as the extent to which the research is accurate. The
internal consistency (i.e., composite reliability) of the factors was adequate, according to the criteria adopted as part of the
methodology, although one factor (external regulation in the
validation sample) had a value of less than .70, but always greater than .60, which can be considered an acceptable limit22,
especially when dealing with factors with few items. Besides that, in the study of Lonsdale, Sabiston, Taylor, Ntoumanis12, speciically in the Hong Kong sample, the authors also found a
similar value of composite reliability.
Regarding convergent validity, some issues can be veriied within the factors amotivation and external regulation (calibration sample) and external regulation (validation sample), because the AVE values were lower than the ones adopted as part of the methodology (≥.50), that is, the items were not strongly as -sociated with these factors, although, the factorial weights were
greater than .50 and statistically signiicant within the respective factors. According to Hair, Black, Babin, Anderson22, this is an
indicator of suitable convergent validity. Also, neither of these
items showed cross-loadings nor very high residual values,
being an adjustment indicator of the items on those factors21.
On the other hand, some factors showed issues, namely
identiied regulation-intrinsic motivation and amotivation-external regulation (both samples), that is, the factors were not
distinguishable enough from each other22. Similar results were
reported in the original version of this questionnaire developed by Lonsdale, Sabiston, Taylor, Ntoumanis12 and other studies
in the physical education domain. Still, in the sports domain,
similar results were found, both in the Behavioral Regulation Sports Questionnaire version (BRSQ33) and in the two versions
of Sports Motivation Scale (SMS34,35). This seems to indicate
that there is not a universal support for the discriminant validity
involving these constructs. However, Ryan and Connell14 justify
the high correlation patterns because the behavioral regulations are presented in a continuum of motivation where contiguous regulations are theoretically close and positively associated,
which seems to be the justiication for the lack of discriminant validity involving amotivation and external regulation, as well as, identiied and intrinsic motivation. Deci and Ryan3,30 highlight
this issue, emphasizing that the SDT constructs underlying the autonomous and controlled motivation types correlate highly
among themselves. Several studies in different contexts have reported the same results: exercise36,37 and Sport33,34,35 .
For the invariance analysis (i.e., across samples and gender) the suggested recommendations from several authors were fol-lowed (e.g., Byrne21). The re-speciication of the model implies that when a model does not present adjustment to the data, the inal (re-speciied) model should be tested in another sample of
the same population, ensuring proper validity and robustness.
Therefore, the inal model, primarily deined and tested in the
calibration sample, was once again tested on the validation
sample, presenting an adjustment to the data and in line with the
values adopted previously21,23. In both cross-validation and gender
invariance, all criteria were met, showing that the theoretical constructs underlying the measurement model were perceived in the same way by both genders, allowing comparisons between male and female PE students25.
Thus, considering the assumptions from operationalized multi-group analysis in the methodology21,24, it is possible to afirm the following to both samples and gender: i) conigural invariance is veriied as the same items group that explains the
same factors group is maintained, independently of sample and gender; ii) the factorial weight of the items is equivalent for both samples and gender (measurement invariance), in other words, the items have the same importance regardless of the group; iii) the item intercepts are invariant (equivalents) in both samples and gender, consequently representing scale invariance (i.e., strong invariance). This type of invariance is
the most important, because when this assumption is veriied, it
Cognitive Engagement .780** .806** .406** -.134** -.294**
Emotional Engagement .901** .813** .331** -.232** -.509**
means it is legitimate to make results comparisons in different groups, in this case across samples and genders, based on the behavioral regulation, underlying SDT40; iv) residual
invari-ance was veriied, because the factorial weights, covariinvari-ance and error of measurement model operate the same way across samples and genders21,24. Thus, these results support PLOCQp
use in PE context, as the model presented cross-validation criteria and reveled to be gender invariant, supporting that the theoretical construct underlying the measurement model is in-terpreted in the same way between male and female students. Despite addressing a gap in the literature regarding moti-vational regulations measurement in the present context, some limitations are evident: i) the validated version do not encompass all of the SDT behavioral regulations (i.e., integrated regulation). Thus, we suggest that future endeavors should try to address this issue for the PE context; ii) in addition to cross-validation, future studies should focus in longitudinal invariance analysis (e.g., throughout the school year) in order to increase the robustness of the instrument; iii) analyze invariance across different age groups (e.g., middle school and high school), to understand if the instrument is interpreted in the same way despite age differences.
Therefore, and despite study limitations, the present work provides an instrument that allows behavioral regulation in Portuguese and PE settings, providing teachers a specialized tool to help them better understand student behavior in class. This may be important in order to prevent some unwanted be-haviors, low in-class task adherence, or feelings of boredom, simultaneous helping teacher to plan more engaging and joyful classes, acting as promoters of intrinsic motivation. This issue is particularly important as intrinsic motivation is among the most highlighted factors to the maintenance of behavior over time41.
In short, this study suggests that PLOCQp with ive factors and 18 items has good psychometric properties and can be used to assess contextual motivation towards PE in the Portuguese context. Invariance analysis shows support for the use of the instrument in both genders.
References
1. Hagger M, Chatzisarantis L. The Trans-Contextual Model of
Autonomous Motivation in Education: Conceptual and Empirical Issues and Meta-Analysis. Review of Educational Research. 2015; 20, 1-48. doi: 10.3102/0034654315585005
2. Deci E, Ryan R. Intrinsic Motivation and Self-Determination in Human Behavior. New York: Plenum Press, 1985.
3. Ryan R, Deci E. Self-determination theory and the facilita-tion of intrinsic motivafacilita-tion, social development, and well-being. The American Psychologist. 2000; 55(1), 68–78.
doi:10.1037/0003-066X.55.1.68
4. Sebire SJ, Standage M. Vansteenkiste M. Examining intrinsic
versus extrinsic exercise goals: Cognitive, affective, and behav -ioral outcomes. Journal of Sport & Exercise Psychology. 2009;
31(2), 189-210. doi:10.1123/jsep.31.2.189
5. Deci E, Ryan R. The “What” and “Why” of Goal Pursuits: Human Needs and the Self-Determination of Behavior.
Psychological Inquiry. 2000; 11(4), 227-268. doi: 10.1207/ S15327965PLI1104_01
6. Teixeira P, Carraça E, Markland D, Silva M, Ryan R. Exercise,
physical activity, and self-determination theory: A systematic re -view. International Journal of Behavioral Nutrition and Physical Activity. 2012; 9, 78. doi:10.1186/1479-5868-9-78
7. Standage M, Duda JL, Ntoumanis N. A test of self-determination theory in school physical education. British Journal of Educational Psychology. 2005; 75, 411-433. doi: 10.1348/000709904X22359
8. Standage M, Duda JL. Ntoumanis N. A model of contextual motivation in physical education: Using constructs from self-determination and achievement goal theories to predict physical activity intentions. Journal of Educational Psychology. 2003; 95,
97–110. doi:10.1037/0022-0663.95.1.97
9. Teixeira DS, Palmeira AL. Analysis of the indirect effects of the quality of motivation on the relation between need satisfaction
and emotional response to exercise. International Journal of Sport Psychology. 2015; 46, 295-310. doi: 10.7352/IJSP 2015.46.295 10. Ryan R, Deci E. Self-Determination Theory. Basic Psychological
Needs in Motivation, Development and Wellness. New York: The
Guilford Press, 2017.
11. Ntoumanis N, Standage M. Motivation in physical education classes: a self-determination theory perspective. Journal of Research and Theory in Education. 2009; 7, 194-202. doi: 10.1177/1477878509104324
12. Lonsdale C, Sabiston C, Taylor I, Ntoumanis N. Measuring student
motivation for physical education: Examining the psychometric
properties of the Perceived Locus of Causality Questionnaire and the Situational Motivation Scale. Psychology of Sport and Exercise.
2010; 12, 284-292. doi: 10.1016/j.psychsport.2010.11.003
13. Goudas M, Biddle S, Fox K. Perceived locus of causality, goal orientations, and perceived competence in school physical educa-tion classes. British Journal of Educational Psychology. 1994; 64,
453-463. doi: 10.1111/j.2044-8279.1994.tb01116.x
14. Ryan R, Connell J. Perceived Locus of Causality and
Internalization: Examining Reasons for Acting in Two Domains.
Journal of Personality and Social Psychology. 1989;57, 749-761. doi: 10.1037/0022-3514.57.5.749
15. Vallerand R, Pelletier L, Blais M, Brière N, Senécal C,
Vallières E. The academic motivation scale: A measure of intrinsic, extrinsic, and amotivation in education. Education and Psychological Measurement. 1992; 52, 1003–1017. doi:
10.1177/0013164492052004025
16. Ntoumanis N. A prospective study of participation in optional school psysical education using a self-determination theory
frame-work. Journal of Educational Psychology. 2005; 97, 444–453.
doi:10.1037/0022-0663.97.3.444
17. Taylor IM, Ntoumanis N. Teacher motivational strate-gies and student self-determination in physical education.
Journal of Educational Psychology. 2007; 99, 747-760.doi: 10.1037/0022-0663.99.4.747
18. Vallerand R. Vers une méthodologie de validation transculturelle de questionnaires psychologiques: Implications pour la recherche en langue française. Canadian Psychology. 1989, 30, 662-680. doi: 10.1037/h0079856
19. Banville D, Desrosiers P, Genet-Volet Y. Translating Questionnaires and Inventories Using a Cross-Cultural Translation Technique.
Journal of Teaching in Physical Education. 2000; 19, 374-387.
doi: 10.1123/jtpe.19.3.374
20. Brislin R. Translation and content analysis for oral and written material. In H. Triandis & J. Berry (Eds.), Handbook of Cross-Cultural Psychology (Vol. 2, pp. 389-444). Needham Heights,
21. Byrne B. Structural equation modelling with AMOS. Basic con-cepts, applications, and programming (2nd ed.) Madison, Avenue,
New York: Taylor & Francis Group, LLC, 2010.
22. Hair J, Black W, Babin B, Anderson, R. Multivariate Data Analysis (7th ed.). New Jersey: Pearson Educational, Inc., 2014. 23. Marsh H, Hau K, Wen Z. In search of golden rules: Comment
on hypothesis-testing approaches to setting cutoff values for it indexes and dangers in overgeneralizing Hu and Bentler’s (1999) indings. Structural Equation Modeling. 2004; 11(3), 320-341. doi: 10.1207/s15328007sem1103_2
24. Cheung G, Rensvold R. Evaluating goodness-of-it indexes for testing measurement invariance. Structural Equation Modelling: A Multidisciplinary Journal. 2002; 9, 233–255. doi:10.1207/
S15328007SEM0902_5
25. Sass D. Testing measurement invariance and comparing latent
factor means within a conirmatory factor analysis framework.
Journal of Psychoeducational Assessment. 2011; 29, 347-363. doi: 10.1177/0734282911406661
26. Skinner EA, Kindermann TA, Connell JP, Wellborn JG. Engagement and disaffection as organizational constructs in
the dynamics of motivational development. In K. Wentzel & A. Wigield (Eds.), Handbook of motivation in school (pp. 223–245).
Mahwah, NJ: Erlbaum, 2009.
27. Reeve J. How Students Create Motivationally Supportive
Learning Environments for Themselves: The Concept of Agentic
Engagement. Journal of Educational Psychology. 2013; 105,
579–595.doi:10.1037/a0032690
28. Nicholls J. Achievement Motivation: Conceptions of Ability,
Subjective Experience, Task Choice, and Performance.
Psychological Review. 1984; 91(3), 328-346. doi:
10.1037/0033-295x.91.3. 328
29. Nevitt J, Hancock GR. Performance of bootstrapping approaches to model test statistics and parameter standard error estimation in structural equation modeling. Structural Equation Modeling. 2001;
8, 353-377. http://dx.doi.org/10.1207/S15328007SEM0803 _2.
30. Deci E, Ryan R. Facilitating Optimal Motivation and Psychological
Well- Being Across Life’s Domains. The Canadian Psychological Association. 2008; 49, 14-23.
31. Assor A, Vansteenkiste M, Kaplan A. Identiied versus introjected
approach and introjected avoidance motivations in school and in sports: The limited beneits of self-worth strivings. Journal of
Educational Psychology. 2009; 101, 482-497.
32. Teixeira DS, Palmeira AL. Needs Satisfaction Effect on
Exercise Emotional Response: A Serial Mediation Analysis with Motivational Regulations and Exercise Intensity. Motriz. 2016; 22, 1-9. doi: http://dx.doi.org/10.1590/S1980-6574201600040002
33. Lonsdale C, Hodge K, Rose E. The Behavioral Regulation in Sport Questionnaire (BRSQ): Instrument Development and Initial
Validity Evidence. Journal of Sport y Exercise Psychology. 2008;
30, 323-355.doi: 10.1016/j.psychsport.2014.03.006
34. Pelletier L, Fortier M, Vallerand R, Tuson M, Briére M, Blais R.
Toward a new measure of intrinsic motivation, extrinsic motiva -tion, and amotivation in sports: The sport motivation scale (SMS).
Journal of Sport and Exercise Psychology. 1995; 17, 35–53. doi:10.1123/jsep.17.1.35
35. Pelletier L, Rocchi A, Vallerand R, Deci E, Ryan R. Validation of the revised sport motivation scale (SMS-II). Psychology
of Sport and Exercise. 2013; 14, 329-341. doi: 10.1016/j.
psychsport.2012.12.002
36. Cid L, Moutão J, Leitão J, Alves J. Behavioral regulation assess
-ment in exercise: exploring an autonomous and controlled moti
-vation index. Spanish Journal of Psychology. 2012; 15, 1520-8.
doi:10.5209/rev_SJOP.2012.v15.n3.39436
37. Markland D, Tobin V. A Modification to the Behavioural
Regulation in Exercise Questionnaire to Include an Assessment of Amotivation, Journal of Sport and Exercise Psychology. 2004; 26, 191–196.doi.org/10.1123/jsep.26.2.191
38. Monteiro D, Moutão J, Cid, L. Validation of the Behavioral
Regulation Sport Questionnaire in Portuguese Athletes. Revista
de Psicologia del Desporte, 2018; 27, 145-150
39. Clancy R, Herring M, Campbell M. Motivation Measures in
Sport: A Critical Review and Bibliometric Analysis. Frontiers
in Psychology, 2017; 8, 1-12. doi:10.3389/fpsyg.2017.00348 40. Chen F. What happens if we compare chopsticks with forks? The
impact of making inappropriate comparisons in cross-cultural
research. Journal of Personality and Social Psychology. 2008; 95, 1005-1018. doi: 10.1037/a0013193
41. Pannekoek L, Piek J, Hagger M. The Children’s Perceived Locus of Causality Scale for Physical Education. Journal of Teaching in Physical Education. 2014; 33, 162-185. https://doi.org/10.1123/
jtpe.2013-0095
Corresponding author
*Diogo S. Teixeira
Universidade Lusófona de Humanidades e Tecnologias, Faculdade de Educação
Física e Desporto. Lisboa, Portugal.
Email: [email protected]
Orcid: http://orcid.org/0000-0003-4587-5903
Manuscript received on December 7, 2017 Manuscript accepted on February 22, 2018
Motriz. The Journal of Physical Education. UNESP. Rio Claro, SP, Brazil
In the article “Translation and validation of the perceived locus of causality questionnaire (PLOCQ) in a sample of
portuguese physical education students”, published in volume 24, number 2, 2018: DOI: 10.1590/S1980-6574201800020007
and identiication: e1018162.
In the page 1:
Where it was written
This study suggests that PLOCQ with ive factors and 18 items has good psychometric proprieties and can be used to assess contextual motivation towards PE in the Portuguese context.
Should read:
This study suggests that PLOCQ with ive factors and 18 items has good psychometric properties and can be used to assess contextual motivation towards PE in the Portuguese context.
In the page 1:
Where it was written
This instrument was initially developed by Goudas, Biddle and Fox13 through an adaptation of the Self-Regulation
Questionnaire developed by Ryan and Connel14.
Should read:
This instrument was initially developed by Goudas, Biddle and Fox13 through an adaptation of the Self-Regulation
Questionnaire developed by Ryan and Connell14.
In the page 2, section Method, subsection Participants:
Where it was written
Two independent samples of PE students were used in this study to ensure the robustness of the measurement
ins-trument in a sample of the same population.
enrolled in the 3 cycle (7 , 8 and 9 grades) and secondary cycle (10 , 11 and 12 years) Study information and permissions were sent to the schools direction board and parents. After obtaining the study permissions, the students were debriefed about the study aims and their participation previous to the questionnaires delivery. The PE teachers were informed of the requirements necessary to apply the questionnaires. A calm and peaceful environment were provided in a class room to the students before the class starts, in order to read, ill and ask any doubts regarding the questionnaires. No dropouts were reported in this stage.
Two independent samples of PE students were used in this study to ensure the robustness of the measurement ins-trument in a sample of the same population.
The irst set of participants consisted of 699 students and represented the calibration sample, with ages comprised between 12 and 23 years old (M=15.49; SD=1.93), with 332 males and 367 females, enrolled in two PE classes/week (135 min total). The validation sample was composed of 655 students, with ages between 12 and 23 years old (M=15.47; SD=1.88), 312 males and 343 females, with the same amount of PE/week than previous sample. The global sample comprised 644 boys (M=15.4 years; SD=1.90) and 710 girls (M=15.47 years; SD=1.95), were 650 students were enrolled in the 3rd cycle (ages 12 to 17 years) and 704 in secondary cycle (ages 17 to 23 years).
In the page 3:
Where it was written
A primary analysis of the data revealed that there were10 multivariate outliers (i.e. six in the calibration sample; four in the validation sample) (D2 = p1 < 0.01; p2 < 0.01). These participants were removed prior to conducting any further
analysis, as postulated by several authors21,22.
Should read:
A primary analysis of the data revealed that there were10 multivariate outliers (i.e., six in the calibration sample; four in the validation sample) (D2 = p1 < 0.01; p2 < 0.01). These participants were removed prior to conducting any further
analysis, as postulated by several authors21,22.
In the page 4:
Where it was written
In Table 2, it is possible to see that the initial model (i.e., ive factor and 20 items) did not have a good adjustment to the data. An analysis of the residual values between items and the modiication indexes, allowed the identiication of some fragilities. The model was readjusted with the elimination of two items (see inal models in table 2; see Figure 1), and relected an improvement in the adjustment indexes, being in line with the values adopted in the methodology for each of the analyzed samples (i.e. calibration, validation and gender).
Should read:
In the page 4, Table 2:
Where it was written
Table 2 Fit indices of the measurement models of PLOCQp (including existing versions)
Models χ² df p SRMR NNFI CFI RMSEA 90% CI
PLOCQ1 971.83* 320 - .090 .950 .960 .080 .070-.080
Initial Model Calibration 915.351 160 <.001 .067 .861 .883 .082 .951-1.224 Final Model Calibration 542.004 125 <.001 .061 .908 .925 .069 .063-.075 Final Model Validation 491.473 125 <.001 .062 .908 .924 .067 .061-.073
Male Model 449.601 125 <.001 .051 .917 .933 .063 .405-.604
Female Model 560.320 125 <.001 .068 .904 .921 .070 .065-.076
Engagement2 7413.507 91 <.001 .043 .913 .932 .069
-Note. χ² = chi-squared; * values reported by the authors concerning the Satorra-Bentler correction of χ² (S-Bχ²); df = degrees of freedom; SRMR = Standardized
Root Mean Square Residual; NNFI = Non-Normed Fit Index; CFI = Comparative Fit Index; RMSEA = Root Mean Squared Error of Approximation; 90% CI = conidence interval of RMSEA; Final Model - ive factors and 18 items; 1Lonsdale, Sabiston, Taylor, Ntoumanis12; 2 in preparation by others
Should read:
Table 2 Fit indices of the measurement models of PLOCQp (including existing versions)
Models χ² df B-S p SRMR NNFI CFI RMSEA 90% CI
PLOCQ1 971.83* 320 - .090 .950 .960 .080 .070-.080
Initial Model Calibration 915.351 160 <.001 .067 .861 .883 .082 .951-1.224 Final Model Calibration 542.004 125 <.001 .061 .908 .925 .069 .063-.075 Final Model Validation 491.473 125 <.001 .062 .908 .924 .067 .061-.073
Male Model 449.601 125 <.001 .051 .917 .933 .063 .405-.604
Female Model 560.320 125 <.001 .068 .904 .921 .070 .065-.076
3rd cycle 409.633 125 <.001 .055 .925 .939 .060 .054-.067
Secondary cycle 625.733 125 <.001 .075 .900 .912 .075 .070-.081
Engagement2 7413.507 91 <.001 .043 .913 .932 .069
-Note. χ² = chi-squared; * values reported by the authors concerning the Satorra-Bentler correction of χ² (S-Bχ²); df = degrees of freedom; SRMR = Standardized
Root Mean Square Residual; NNFI = Non-Normed Fit Index; CFI = Comparative Fit Index; RMSEA = Root Mean Squared Error of Approximation; 90% CI = conidence interval of RMSEA; Final Model - ive factors and 18 items; 1Lonsdale, Sabiston, Taylor, Ntoumanis12; 2 in preparation by others
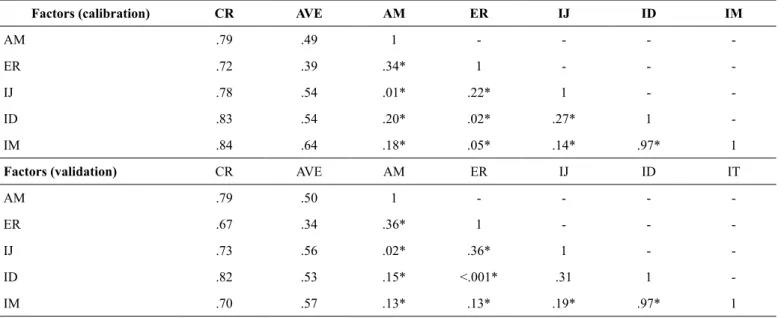
In the page 7, Table 3:
Where it was written
Table 3 Internal reliability, convergent and discriminant validity and average variance extracted – Calibration and Validation samples
Factors (calibration) CR AVE AM ER IJ ID IM
AM .79 .49 1 - - -
-ER .72 .39 .34* 1 - -
-IJ .78 .54 .01* .22* 1 -
-ID .83 .54 .20* .02* .27* 1
IJ .73 .56 .02* .36* 1 -
-ID .82 .53 .15* <.001* .31 1
-IM .70 .57 .13* .13* .19* .97* 1
Note. Composite Reliability (CR); Average Variance Extracted (AVE); AM= amotivation; EX: external regulation; IJ: introjected regulation; ID= identiied regulation; IM= intrinsic motivation; * (r2).
Should read:
Table 3 Internal reliability, convergent and discriminant validity and average variance extracted – Calibration and Validation samples
Factors (calibration) CR AVE AM ER IJ ID IM
AM .79 .49 1 - - -
-ER .72 .39 .34* 1 - -
-IJ .78 .54 .01* .22* 1 -
-ID .83 .54 .20* .02* .27* 1
-IM .84 .64 .18* .05* .14* .97* 1
Factors (validation) CR AVE AM ER IJ ID IT
AM .79 .50 1 - - -
-ER .67 .34 .36* 1 - -
-IJ .73 .56 .02* .36* 1 -
-ID .82 .53 .15* <.001* .31 1
-IM .70 .57 .13* .13* .19* .97* 1
Note. Composite Reliability (CR); Average Variance Extracted (AVE); AM= amotivation; EX= external regulation; IJ= introjected regulation; ID= identiied regulation; IM= intrinsic motivation; * (r2).
In the page 7, Table 4:
Where it was written
Table 4 Fit indices for the invariance of the measurement model of the PLOCQ in the Portuguese sample across
χ² df ∆ χ² ∆df p CFI ∆CFI
CS - VS
Conigural Invariance 1033.476 250 - - - .925
-Measurement Invariance 1052.619 263 19.144 13 .119 .924 .001
Scale Invariance 1063.991 278 30.515 28 .339 .925 .000
Residual Invariance 1113.033 296 79.557 46 .002 .922 .003
M - F
Conigural Invariance 1009.917 250 - - - .927
Index; ∆CFI = differences in the value of the Comparative Fit Index
Should read:
Table 4 Fit indices for the invariance of the measurement model of the PLOCQ in the Portuguese sample across samples, gender, 3rd cycle and secondary cycle
χ² df ∆ χ² ∆df p CFI ∆CFI
CS - VS
Conigural Invariance 1033.476 250 - - - .925
-Measurement Invariance 1052.619 263 19.144 13 .119 .924 .001
Scale Invariance 1063.991 278 30.515 28 .339 .925 .000
Residual Invariance 1113.033 296 79.557 46 .002 .922 .003
M - F
Conigural Invariance 1009.917 250 - - - .927
-Measurement Invariance 1038.488 263 28.571 13 .008 .925 .002
Scale Invariance 1060.637 278 50.720 28 .005 .924 .003
Residual Invariance 1082.785 296 72.868 46 .007 .924 .003
3rd cycle – secondary cycle
Conigural Invariance 1035.353 250 - - - .924
-Measurement Invariance 1063.099 263 27.746 13 .010 .923 .001
Scale Invariance 1107.665 278 72.312 28 <.001 .920 .004
Residual Invariance 1147.077 296 111.723 46 <.001 .918 .006
Note. χ² = chi-squared; df = degrees of freedom; ∆χ² = differences in the value of chi-squared; ∆df = differences in the degrees of freedom; CFI = Comparative Fit Index; ∆CFI = differences in the value of the Comparative Fit Index; CS = calibration sample; VS = validation sample; F = female sample; M = male sample
In the page 8:
Where it was written
Psychometric analysis of the Portuguese version of the PLOCQ showed that the initial hypothesized model (ive
factors / 20 items) did not it the pre-deined values adopted in methodology21,22,23. For this matter, individual parameters
were analyzed, and two items (intrinsic motivation– 14; introjected regulation – 2) were removed because they showed associations with other factors (e.g., the item 2, “Because I want the PE teacher to think I am a good student” presented an association with external regulation).
Should read:
Psychometric analysis of the Portuguese version of the PLOCQ showed that the initial hypothesized model (ive factors / 20 items) did not it the pre-deined values adopted in methodology21,22,23. For this matter, individual parameters (through the modiication indexes) were analyzed, and two items (intrinsic motivation - 14; introjected regulation - 2)
were removed because they showed associations with other factors (e.g., the item 2, “Because I want the PE teacher to
Deci and Ryan3,30 highlight this issue, emphasizing that the SDT constructs underlying the autonomous and control-led motivation types correlate highly among themselves. Several studies in different contexts have reported the same results: exercise36,37 and Sport33,34,35.
Should read:
Deci and Ryan3,30 highlight this issue, emphasizing that the SDT constructs underlying the autonomous and
control-led motivation types correlate highly among themselves. Several studies in different contexts have reported the same results: exercise36,37 and Sport33,34,35,38,39.
In the page 8:
Where it was written
Thus, considering the assumptions from operationalized multi-group analysis in the methodology21,24, it is possible
to airm the following to both samples and gender: i) conigural invariance is veriied as the same items group that ex
-plains the same factors group is maintained, independently of sample and gender; ii) the factorial weight of the items is equivalent for both samples and gender (measurement invariance), in other words, the items have the same importance regardless of the group; iii) the item intercepts are invariant (equivalents) in both samples and gender, consequently representing scale invariance (i.e., strong invariance). This type of invariance is the most important, because when this assumption is veriied, it means it is legitimate to make results comparisons in different groups, in this case across sam
-ples and genders, based on the behavioral regulation, underlying SDT38; iv) residual invariance was veriied, because the
factorial weights, covariance and error of measurement model operate the same way across samples and genders21,24.
Thus, these results support PLOCQp use in PE context, as the model presented cross-validation criteria and reveled to be gender invariant, supporting that the theoretical construct underlying the measurement model is interpreted in the same way between male and female students.
Should read:
Thus, considering the assumptions from operationalized multi-group analysis in the methodology21,24, it is possible
to afirm the following to both samples, gender, 3rd cycle and secondary cycle: i) conigural invariance is veriied as the
same items group that explains the same factors group is maintained, independently of sample and gender; ii) the fac
-torial weight of the items is equivalent for both samples and gender (measurement invariance), in other words, the items have the same importance regardless of the group; iii) the item intercepts are invariant (equivalents) in both samples and gender, consequently representing scale invariance (i.e., strong invariance). This type of invariance is the most impor-tant, because when this assumption is veriied, it means it is legitimate to make results comparisons in different groups,
in this case across samples and genders, based on the behavioral regulation, underlying SDT40; iv) residual invariance
was veriied, because the factorial weights, covariance and error of measurement model operate the same way across
samples and genders21,24. Thus, these results support PLOCQp use in PE context, as the model presented cross-validation
criteria and reveled to be gender invariant, supporting that the theoretical construct underlying the measurement model is interpreted in the same way between male and female students.
In the page 9:
Where it was written
Should read:
Thus, we suggest that future endeavors should try to address this issue for the PE context; ii) in addition to cross-validation, future studies should focus in longitudinal invariance analysis (e.g., throughout the school year) in order to increase the robustness of the instrument.
In the page 9:
Where it was written
This issue is particularly important as intrinsic motivation is among the most highlighted factors to the maintenance
of behavior over time39.
Should read:
This issue is particularly important as intrinsic motivation is among the most highlighted factors to the maintenance
of behavior over time41.
In the page 9:
Where it was written
38. Chen F. What happens if we compare chopsticks with forks? The impact of making inappropriate comparisons in cross-cultural research. J Pers Soc Psychol. 2008; 95: 1005-1018. doi: 10.1037/a0013193
39. Pannekoek L, Piek J, Hagger M. The Children’s Perceived Locus of Causality Scale for Physical Education. J Teach Phys Educ. 2014; 33: 162-185. https://doi.org/10.1123/jtpe.2013-0095
Should read:
38. Monteiro D, Moutão J, Cid, L. Validation of the Behavioral Regulation Sport Questionnaire in Portuguese Athle
-tes. Revista de Psicologia del Desporte, 2018; 27, 145-150
39. Clancy R, Herring M, Campbell M. Motivation Measures in Sport: A Critical Review and Bibliometric Analysis. Frontiers in Psychology, 2017; 8, 1-12. doi: 10.3389/fpsyg.2017.00348
40. Chen F. What happens if we compare chopsticks with forks? The impact of making inappropriate comparisons in cross-cultural research. Journal of Personality and Social Psychology. 2008; 95, 1005-1018. doi: 10.1037/a0013193
41. Pannekoek L, Piek J, Hagger M. The Children’s Perceived Locus of Causality Scale for Physical Education. Jour