1
Motriz, Rio Claro, v.24, n.2, 2018, e1018e05 DOI: http://dx.doi.org/10.1590/S1980-657420180002e005
ERRATUM
In the article “Translation and validation of the perceived locus of causality questionnaire (PLOCQ) in a sample of portuguese physical education students”, published in volume 24, number 2, 2018: DOI: 10.1590/S1980-6574201800020007
and identification: e1018162.
In the page 1:
Where it was written
This study suggests that PLOCQ with five factors and 18 items has good psychometric proprieties and can be used
to assess contextual motivation towards PE in the Portuguese context.
Should read:
This study suggests that PLOCQ with five factors and 18 items has good psychometric properties and can be used
to assess contextual motivation towards PE in the Portuguese context.
In the page 1:
Where it was written
This instrument was initially developed by Goudas, Biddle and Fox13 through an adaptation of the Self-Regulation
Questionnaire developed by Ryan and Connel14.
Should read:
This instrument was initially developed by Goudas, Biddle and Fox13 through an adaptation of the Self-Regulation
Questionnaire developed by Ryan and Connell14.
In the page 2, section Method, subsection Participants:
Where it was written
Two independent samples of PE students were used in this study to ensure the robustness of the measurement ins
-trument in a sample of the same population.
The first set of participants consisted of 699 students and represented the calibration sample, with ages comprised
between 12 and 23 years old (M=15.49; SD=1.93), and enrolled in two PE classes/week (135 min total). The validation
sample was composed of 655 students, with ages between 12 and 23 years old (M=15.47; SD=1.88), and had the same amount of PE/week than previous sample. The global sample comprised 652 boys (M=15.4 years; SD=1.90) and 702
girls (M=15.47 years; SD=1.95).
Should read:
Physical education students of four Lisbon public schools were invited to participate in this study. The students were
enrolled in the 3rd cycle (7th, 8th and 9th grades) and secondary cycle (10th, 11th and 12th years) Study information and
a class room to the students before the class starts, in order to read, fill and ask any doubts regarding the questionnaires.
No dropouts were reported in this stage.
Two independent samples of PE students were used in this study to ensure the robustness of the measurement ins
-trument in a sample of the same population.
The first set of participants consisted of 699 students and represented the calibration sample, with ages comprised between 12 and 23 years old (M=15.49; SD=1.93), with 332 males and 367 females, enrolled in two PE classes/week (135 min total). The validation sample was composed of 655 students, with ages between 12 and 23 years old (M=15.47; SD=1.88), 312 males and 343 females, with the same amount of PE/week than previous sample. The global sample
comprised 644 boys (M=15.4 years; SD=1.90) and 710 girls (M=15.47 years; SD=1.95), were 650 students were enrolled in the 3rd cycle (ages 12 to 17 years) and 704 in secondary cycle (ages 17 to 23 years).
In the page 3:
Where it was written
A primary analysis of the data revealed that there were10 multivariate outliers (i.e. six in the calibration sample; four
in the validation sample) (D2 = p1 < 0.01; p2 < 0.01). These participants were removed prior to conducting any further
analysis, as postulated by several authors21,22.
Should read:
A primary analysis of the data revealed that there were10 multivariate outliers (i.e., six in the calibration sample; four
in the validation sample) (D2 = p1 < 0.01; p2 < 0.01). These participants were removed prior to conducting any further
analysis, as postulated by several authors21,22.
In the page 4:
Where it was written
In Table 2, it is possible to see that the initial model (i.e., five factor and 20 items) did not have a good adjustment to the data. An analysis of the residual values between items and the modiication indexes, allowed the identiication of some fragilities. The model was readjusted with the elimination of two items (see final models in table 2; see Figure 1), and relected an improvement in the adjustment indexes, being in line with the values adopted in the methodology for each of the analyzed samples (i.e. calibration, validation and gender).
Should read:
In Table 2, it is possible to see that the initial model (i.e., five factor and 20 items) did not have a good adjustment to the data. An analysis of the individual parameters based on the modification indices revealed that two items (item 14 - intrinsic motivation, and item 2 - introjected regulation), are cross-loadings. These items were therefore removed from
the model, as suggested by several authors21,22. Following these modifications, the final model (re-specified) provided
a good fit to the data for all samples under analysis.
In the page 4, Table 2:
Where it was written
Table 2 Fit indices of the measurement models of PLOCQp (including existing versions)
Models χ² df p SRMR NNFI CFI RMSEA 90% CI
Should read:
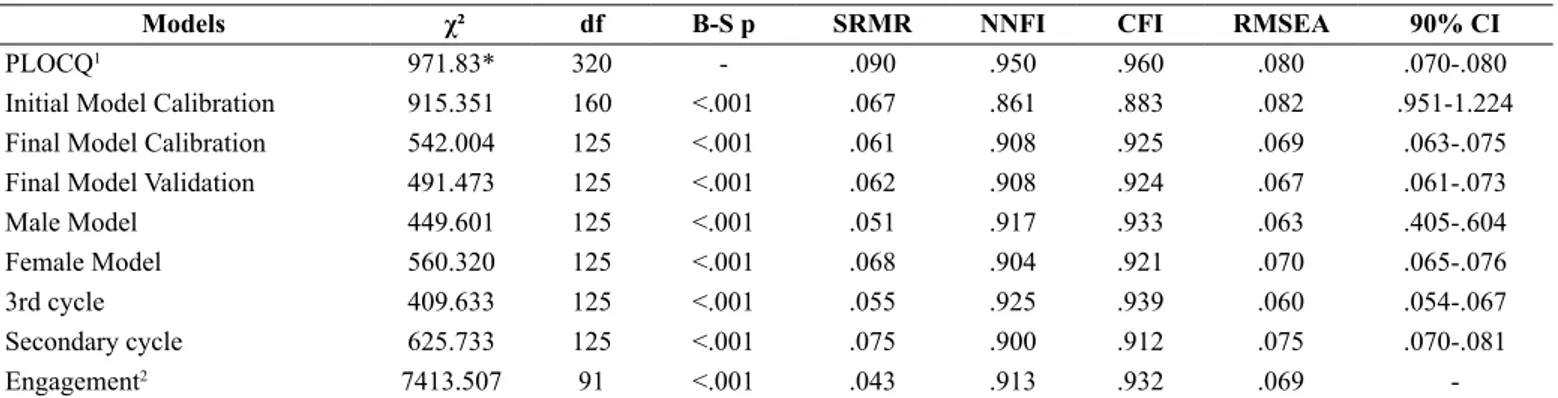
In the page 7, Table 3:
Where it was written Table 2 Fit indices of the measurement models of PLOCQp (including existing versions)
Models χ² df B-S p SRMR NNFI CFI RMSEA 90% CI
PLOCQ1 971.83* 320 - .090 .950 .960 .080 .070-.080
Initial Model Calibration 915.351 160 <.001 .067 .861 .883 .082 .951-1.224
Final Model Calibration 542.004 125 <.001 .061 .908 .925 .069 .063-.075
Final Model Validation 491.473 125 <.001 .062 .908 .924 .067 .061-.073
Male Model 449.601 125 <.001 .051 .917 .933 .063 .405-.604
Female Model 560.320 125 <.001 .068 .904 .921 .070 .065-.076
3rd cycle 409.633 125 <.001 .055 .925 .939 .060 .054-.067
Secondary cycle 625.733 125 <.001 .075 .900 .912 .075 .070-.081
Engagement2 7413.507 91 <.001 .043 .913 .932 .069
-Note. χ² = chi-squared; * values reported by the authors concerning the Satorra-Bentler correction of χ² (S-Bχ²); df = degrees of freedom; SRMR = Standardized Root Mean Square Residual; NNFI = Non-Normed Fit Index; CFI = Comparative Fit Index; RMSEA = Root Mean Squared Error of Approximation; 90% CI = confidence interval of RMSEA; Final Model - five factors and 18 items; 1Lonsdale, Sabiston, Taylor, Ntoumanis12; 2 in preparation by others
Table 3 Internal reliability, convergent and discriminant validity and average variance extracted – Calibration and Validation samples
Factors (calibration) CR AVE AM ER IJ ID IM
AM .79 .49 1 - - -
-ER .72 .39 .34* 1 - -
-IJ .78 .54 .01* .22* 1 -
-ID .83 .54 .20* .02* .27* 1
-IM .84 .64 .18* .05* .14* .97* 1
Factors (validation) CR AVE AM ER IJ ID IT
AM .79 .50 1 - - -
-ER .67 .34 .36* 1 - -
-IJ .73 .56 .02* .36* 1 -
-ID .82 .53 .15* <.001* .31 1
-IM .70 .57 .13* .13* .19* .97* 1
Note. Composite Reliability (CR); Average Variance Extracted (AVE); AM= amotivation; EX: external regulation; IJ: introjected regulation; ID= identified
regulation; IM= intrinsic motivation; * (r2).
Initial Model Calibration 915.351 160 <.001 .067 .861 .883 .082 .951-1.224
Final Model Calibration 542.004 125 <.001 .061 .908 .925 .069 .063-.075
Final Model Validation 491.473 125 <.001 .062 .908 .924 .067 .061-.073
Male Model 449.601 125 <.001 .051 .917 .933 .063 .405-.604
Female Model 560.320 125 <.001 .068 .904 .921 .070 .065-.076
Engagement2 7413.507 91 <.001 .043 .913 .932 .069
Table 3 Internal reliability, convergent and discriminant validity and average variance extracted – Calibration and Validation samples
Factors (calibration) CR AVE AM ER IJ ID IM
AM .79 .49 1 - - -
-ER .72 .39 .34* 1 - -
-IJ .78 .54 .01* .22* 1 -
-ID .83 .54 .20* .02* .27* 1
-IM .84 .64 .18* .05* .14* .97* 1
Factors (validation) CR AVE AM ER IJ ID IT
AM .79 .50 1 - - -
-ER .67 .34 .36* 1 - -
-IJ .73 .56 .02* .36* 1 -
-ID .82 .53 .15* <.001* .31 1
-IM .70 .57 .13* .13* .19* .97* 1
Note. Composite Reliability (CR); Average Variance Extracted (AVE); AM= amotivation; EX= external regulation; IJ= introjected regulation; ID= identified
regulation; IM= intrinsic motivation; * (r2).
In the page 7, Table 4:
Where it was written
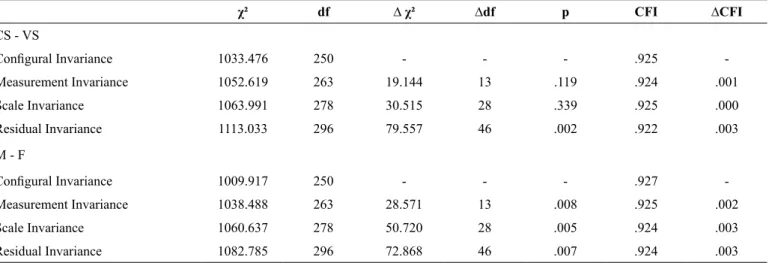
Table 4 Fit indices for the invariance of the measurement model of the PLOCQ in the Portuguese sample across
χ² df ∆ χ² ∆df p CFI ∆CFI
CS - VS
Configural Invariance 1033.476 250 - - - .925
-Measurement Invariance 1052.619 263 19.144 13 .119 .924 .001
Scale Invariance 1063.991 278 30.515 28 .339 .925 .000
Residual Invariance 1113.033 296 79.557 46 .002 .922 .003
M - F
Configural Invariance 1009.917 250 - - - .927
-Measurement Invariance 1038.488 263 28.571 13 .008 .925 .002
Scale Invariance 1060.637 278 50.720 28 .005 .924 .003
Residual Invariance 1082.785 296 72.868 46 .007 .924 .003
Note. χ² = chi-squared; df = degrees of freedom; ∆χ² = differences in the value of chi-squared; ∆df = differences in the degrees of freedom; CFI = Comparative Fit Index; ∆CFI = differences in the value of the Comparative Fit Index
Should read:
Table 4 Fit indices for the invariance of the measurement model of the PLOCQ in the Portuguese sample across samples, gender, 3rd cycle and
secondary cycle
χ² df ∆ χ² ∆df p CFI ∆CFI
CS - VS
In the page 8:
Where it was written
Psychometric analysis of the Portuguese version of the PLOCQ showed that the initial hypothesized model (ive factors / 20 items) did not it the pre-deined values adopted in methodology21,22,23. For this matter, individual parameters
were analyzed, and two items (intrinsic motivation– 14; introjected regulation – 2) were removed because they showed associations with other factors (e.g., the item 2, “Because I want the PE teacher to think I am a good student” presented
an association with external regulation).
Should read:
Psychometric analysis of the Portuguese version of the PLOCQ showed that the initial hypothesized model (five factors / 20 items) did not fit the pre-defined values adopted in methodology21,22,23. For this matter, individual parameters
(through the modification indexes) were analyzed, and two items (intrinsic motivation - 14; introjected regulation - 2)
were removed because they showed associations with other factors (e.g., the item 2, “Because I want the PE teacher to
think I am a good student” presented an association with external regulation).
In the page 8:
Where it was written
Deci and Ryan3,30 highlight this issue, emphasizing that the SDT constructs underlying the autonomous and control
-led motivation types correlate highly among themselves. Several studies in different contexts have reported the same
results: exercise36,37 and Sport33,34,35.
Should read:
Deci and Ryan3,30 highlight this issue, emphasizing that the SDT constructs underlying the autonomous and control
-led motivation types correlate highly among themselves. Several studies in different contexts have reported the same
results: exercise36,37 and Sport33,34,35,38,39.
Configural Invariance 1033.476 250 - - - .925
-Measurement Invariance 1052.619 263 19.144 13 .119 .924 .001
Scale Invariance 1063.991 278 30.515 28 .339 .925 .000
Residual Invariance 1113.033 296 79.557 46 .002 .922 .003
M - F
Configural Invariance 1009.917 250 - - - .927
-Measurement Invariance 1038.488 263 28.571 13 .008 .925 .002
Scale Invariance 1060.637 278 50.720 28 .005 .924 .003
Residual Invariance 1082.785 296 72.868 46 .007 .924 .003
3rd cycle – secondary cycle
Configural Invariance 1035.353 250 - - - .924
-Measurement Invariance 1063.099 263 27.746 13 .010 .923 .001
Scale Invariance 1107.665 278 72.312 28 <.001 .920 .004
Residual Invariance 1147.077 296 111.723 46 <.001 .918 .006
In the page 8:
Where it was written
Thus, considering the assumptions from operationalized multi-group analysis in the methodology21,24, it is possible to
afirm the following to both samples and gender: i) configural invariance is veriied as the same items group that explains the same factors group is maintained, independently of sample and gender; ii) the factorial weight of the items is equivalent for both samples and gender (measurement invariance), in other words, the items have the same importance regardless of the group; iii) the item intercepts are invariant (equivalents) in both samples and gender, consequently representing scale invariance (i.e., strong invariance). This type of invariance is the most important, because when this assumption is veriied, it means it is legitimate to make results comparisons in different groups, in this case across samples and genders, based on
the behavioral regulation, underlying SDT38; iv) residual invariance was veriied, because the factorial weights, covariance
and error of measurement model operate the same way across samples and genders21,24. Thus, these results support PLOCQp
use in PE context, as the model presented cross-validation criteria and reveled to be gender invariant, supporting that the
theoretical construct underlying the measurement model is interpreted in the same way between male and female students.
Should read:
Thus, considering the assumptions from operationalized multi-group analysis in the methodology21,24, it is possible
to affirm the following to both samples, gender, 3rd cycle and secondary cycle: i) configural invariance is verified as the
same items group that explains the same factors group is maintained, independently of sample and gender; ii) the fac
-torial weight of the items is equivalent for both samples and gender (measurement invariance), in other words, the items have the same importance regardless of the group; iii) the item intercepts are invariant (equivalents) in both samples and gender, consequently representing scale invariance (i.e., strong invariance). This type of invariance is the most impor
-tant, because when this assumption is verified, it means it is legitimate to make results comparisons in different groups,
in this case across samples and genders, based on the behavioral regulation, underlying SDT40; iv) residual invariance
was verified, because the factorial weights, covariance and error of measurement model operate the same way across
samples and genders21,24. Thus, these results support PLOCQp use in PE context, as the model presented cross-validation
criteria and reveled to be gender invariant, supporting that the theoretical construct underlying the measurement model
is interpreted in the same way between male and female students.
In the page 9:
Where it was written
Thus, we suggest that future endeavors should try to address this issue for the PE context; ii) in addition to cross-validation, future studies should focus in longitudinal invariance analysis (e.g., throughout the school year) in order to increase the robustness of the instrument; iii) analyze invariance across different age groups (e.g., middle school and high school), to understand if the instrument is interpreted in the same way despite age differences.
Should read:
Thus, we suggest that future endeavors should try to address this issue for the PE context; ii) in addition to cross-validation, future studies should focus in longitudinal invariance analysis (e.g., throughout the school year) in order to increase the robustness of the instrument.
In the page 9:
Where it was written
Should read:
This issue is particularly important as intrinsic motivation is among the most highlighted factors to the maintenance of behavior over time41.
In the page 9:
Where it was written
38. Chen F. What happens if we compare chopsticks with forks? The impact of making inappropriate comparisons in
cross-cultural research. J Pers Soc Psychol. 2008; 95: 1005-1018. doi: 10.1037/a0013193
39. Pannekoek L, Piek J, Hagger M. The Children’s Perceived Locus of Causality Scale for Physical Education. J Teach Phys Educ. 2014; 33: 162-185. https://doi.org/10.1123/jtpe.2013-0095
Should read:
38. Monteiro D, Moutão J, Cid, L. Validation of the Behavioral Regulation Sport Questionnaire in Portuguese Athle
-tes. Revista de Psicologia del Desporte, 2018; 27, 145-150
39. Clancy R, Herring M, Campbell M. Motivation Measures in Sport: A Critical Review and Bibliometric Analysis. Frontiers in Psychology, 2017; 8, 1-12. doi: 10.3389/fpsyg.2017.00348
40. Chen F. What happens if we compare chopsticks with forks? The impact of making inappropriate comparisons in cross-cultural research. Journal of Personality and Social Psychology. 2008; 95, 1005-1018. doi: 10.1037/a0013193
41. Pannekoek L, Piek J, Hagger M. The Children’s Perceived Locus of Causality Scale for Physical Education. Jour
-nal of Teaching in Physical Education. 2014; 33, 162-185. https://doi.org/10.1123/jtpe.2013-0095