1
Empirical evidence of the effect of sanitation policies on
health indicators for Brazilian municipalities
Lucas Teixeira Enlinson Mattos e Cristine Pinto EESP/FGV
ABSTRACT
This paper investigates the effects of sanitation policies on health indicators in a panel of Brazilian municipalities. Specifically, we use DataSUS, the IBGE, and the SNIS to assess whether the indicators of sanitation affect the health indicators of mortality and morbidity by age group and by different diseases in the municipalities from 2001 to 2008. We work with different samples due to an unbalanced panel because there are missing data on sanitation in smaller municipalities and for lower income people. The results show that we cannot ignore the importance of sanitation. Our results indicate that for the entire sample, a 1% reduction in the incidence of total coliform implies a decline of 0.12 deaths for children under one year of age, including the neonatal period, for every thousand live births. Regarding hospitalization due to illness, only improvement in access to water and a reduction in total coliforms seem to reduce hospitalization for dysentery (for access to water) and hepatitis and tuberculosis (for total coliforms). Access to sewage services seems to reduce the mortality of children up to four years of age and hospitalizations of children aged five to nine years in poor municipalities. Finally, access to water and sewers appears to reduce hospitalizations due to dysentery and hepatitis in municipalities with an income above the median in Brazil.
2
1. Introduction
The issue of basic sanitation is increasingly on the public policy agenda in Brazil. The country is a signatory of the Millennium Development Goals of the United Nations, which includes a commitment to sanitation goals. The topic is under scrutiny in the printed media,1 which demand rapid and efficient investments and criticize the current situation in the sector. There is a tendency in Brazil to universalize access to piped and drinking water, but the nationwide access network for the collection and treatment of sewage remains relatively underdeveloped. This situation calls for studies on the subject.
Using panel data from Brazilian municipalities, the present article proposes to analyze the effect of variables related to basic sanitation on health indicators. We argue that advances in the sanitation sector can have a positive impact on the wellbeing of citizens and can generate externalities. Investments in sanitation in Brazil have not reached 0.5% of GDP in the last 15 years (Neri, 2007). Furthermore, concern about the quality of sanitation services has grown. Improvement in water quality, reduction of waste, the condition of sewerage, and other factors beyond the issue of access to water can therefore provide better living conditions. According to Seroa da Motta (2004), basic sanitation is clearly important to the health and welfare of citizens and has a positive effect on the environment; that is, public investment in sanitation produces positive impacts for other sectors of the economy, particularly agriculture, education, labor, and tourism, which in turn can increase the efficiency of public policies.
A new database linking annual sanitation and health information in Brazilian municipalities allows us to perform an econometric evaluation that is not merely quantitative, such as measuring access to drinking water, but also allows qualitative evaluations, such as identifying the channels that impact citizens’ health. Therefore, the present study uses panel data from Brazilian cities with a sample based on the decade of the 2000s. We sought to identify the effect of improved quality and access to water on health indicators, such as diarrhea, dysentery, cholera, and polio. Thus, the present study is the first to distinguish variables that measure the effect of both the quantity (coverage or access) and the quality (the fecal coliforms rate or sewage treatment, for example) of the sanitation service on health indicators, including deaths and hospitalizations.
The present article aims to contribute to the literature in different ways. The
1
3 study’s first contribution is to use a newly available sanitation database containing municipalities' annual information. The second and perhaps main contribution is to distinguish the importance of items related to the quantity and quality of water from the reduction of diseases and deaths related to a lack of sanitation. As infant mortality continues to decline, the present study also emphasizes the issue of morbidity, including hospitalization due to disease. The final contribution is to help implement effective public policies in the sector from two standpoints: first, to identify the channels related to basic sanitation that impact health indicators, and second, to assess the results of investment in sanitation, producing a cost-benefit analysis of this and other policies.
The article is organized as follows: the following section summarizes the literature regarding topics covered in the subsequent sections. Section 3 aims to introduce the data used, form the descriptive analysis, and begin the discussion about the unbalanced nature of the panel database. Section 4 contains the empirical implementation, the presentation of results, and the cost-benefit analysis. Finally, section 5 offers our conclusions.
2. Literature Review
2.1. Sanitation
Growing concern about the universalization of basic sanitation services in recent decades has led to the emergence of studies on the impact of changes in access to water and sewerage services on the population’s health. These studies are driven by the existence of diseases due to sanitation imperfections. Galdo and Briceño (2005) note that diseases borne directly or indirectly by water comprise four different types. First, many diseases are caused by poor water quality, such as diarrhea, dysentery, cholera, and polio. Other diseases are related to lack of sanitation when the volume of water is insufficient for personal hygiene. There are also diseases caused by organisms that live in water, such as schistosomiasis and roundworm, and diseases transmitted by insects from polluted aquatic environments, such as malaria, dengue fever, and yellow fever. Thus, factors beyond the supply of water itself cause the emergence of these diseases, which can result in worsening health indicators.
A pioneer of econometric studies, Merrick (1983) sought to measure the effects of sanitation on the health of the Brazilian population, using data from the 1970 Census
4 and the National Survey of Sample Households (Pesquisa Nacional de Amostra dos Domicílios - PNAD) of 1976. Increased access to piped water in these six years was assessed to verify whether it helped in any significant way to reduce infant mortality in the urban population. For this assessment, a simultaneous equations model was used in which infant mortality rate, binary variables of access to water, and income of the parents were considered to be endogenous components, as the study was interested both in what led to the consumption of water and the implications of this consumption. This analysis showed that despite maternal education having a greater effect because it affected family income, access to piped water was also significant for the improvement of health indicators.
The influence of education on the health of citizens raises the possibility of the significance of the interaction between education and sanitation. With data from the Philippines, Barrera (1990) showed that maternal education and access to a water connection are substitutes for the health of children up to 15 years; that is, the interaction between these variables has a negative correlation, as mothers with more schooling are better able to care for their children even without access to water and sewerage. Thus, sanitary infrastructure and maternal education are complementary benefits with positive interaction between the variables possibly because families with more education better appreciate the value of heath care. Even in Brazil, Kassouf (1995) found negative correlations in the interactions between maternal education and sanitation for all age groups, using height in relation to children's ages as the dependent variable.
Using a municipal database and the economic value of reducing mortality as a dependent variable through an intertemporal model, Soares (2007) added illiteracy as a control variable to assess the influence on life expectancy of Brazilians between 1970 and 2000. The author estimated that access to water and education have economic value that is three times greater than sewage treatment, although all of these variables were significant. Using Census data from 1970 to 2000, Alves and Beluzzo (2004) concluded that education, basic sanitation, income per capita, and economic growth help to reduce the country's mortality rate. These studies use both panel estimations for fixed effects and dynamic panels as proposed by Arellano and Bond (1991) to address the alleged endogeneity problem because the progress of sanitation predominates in areas with poor quality of life and health, which generates reverse causality.
5 sanitation also differs from area to area. Given this condition, Gamber-Rabindran, Khan, and Timmins (2007) analyzed the impact of piped water on the infant mortality rate in Brazil through quantile regressions and evaluated the interaction with access to other basic infrastructures. The result was that access to piped water had little effect in areas with worse development, and the effect increased according to the region's development to reach an optimal level before beginning to decline. Nevertheless, the effect was significant. However, Sastry and Burgard (2005) suggest that the mere expansion of sanitation and water supply is not sufficient to reduce cases of diarrhea in the northeast region.
Other studies have assessed the effect of sanitation on health indicators in other developing countries in recent decades. Using data from India, Java and Vallaion (2003) concluded that increased access to water supply only impacted the reduction of diseases such as diarrhea in children if it was accompanied by other public policies. In Latin America, Galdo and Briceño (2005) found evidence of the impact of sanitation on the health of Ecuadorian children, and Checkley et al. (2004) noted that the height of children in Peru was impacted by sanitation. Lee, Rosenzweig, and Pitt (1997) observed the impact of sanitation on child mortality in Bangladesh and the Philippines, using a semiparametric estimation and maximum likelihood because the proposed model, which included nutritional aspects, caused biased estimates using the method of least squares and because of the assumption that mortality does not have a known distribution. Lee, Rosenzweig, and Pitt (1997) found that neither variation in the type of water supply nor sanitation improvements had a significant effect and that only wealth and parental education contributed significantly to children's survival rates. Regarding diseases, Esrey et al. (1991) compiled several studies evaluating the impact of access to water and sewerage systems on diseases. The authors concluded that improvements in sanitation promote effective reduction of morbidity from ascariasis, diarrhea, guinea worm, schistosomiasis, and trachoma. Additionally, sanitation reduced the severity and fatality of these diseases, highlighting the positive externalities generated.
Watson (2006) assessed the impact of the expansion of sanitation in indigenous U.S. communities during the second half of the twentieth century. This expansion resulted from investments generated by the Sanitation Facilities Construction Act (SFC), which authorized sanitation improvements on indigenous reservations with a budget approved annually by Congress. In the study, the calculation was performed using panel data for a sample of 38 U.S. counties with the highest indigenous populations between 1960 and
6 1998. The results showed that indigenous infant mortality would have been 51% higher if there were no such sanitation program, and this result explains 40% of the decrease in the difference in infant mortality between indigenous Americans and whites since 1970. This impact occurred primarily at the post-neonatal age (between one and 12 months) of indigenous children; the effect on neonatal mortality (within one month of life) was not found to be significant. The study also showed reductions in gastrointestinal and respiratory diseases in indigenous Americans due to the SFC. Moreover, there is evidence of health externalities in areas with a predominantly white population that is close to indigenous American reservations, both directly (through access to water) and indirectly (by reducing respiratory diseases).
There are also studies on public policy experiments in the sanitation sector. Devoto et al. (2011) assessed the impact of sanitation in the urban area of Tangier, one of the largest cities in Morocco, where water was only supplied to public places close to homes, creating time costs with the collection of drinking water. The experiment, conducted in 2008, aimed to inform and make available interest-free credit loans of between three and seven years to a random group of families with the goal of establishing direct access to sanitation in their homes, whereas the control group could have access to credit but had little or no information about it and faced greater bureaucracy to obtain it. These conditions caused the treatment group to have greater access (69%) than the control group (10%) to the direct connection of piped water. The experiment led to an increased amount of water consumed by households but did not alter its quality (measured by the incidence of bacteria in the water, which, according to the abovementioned article, is correlated with the rate of fecal coliform), although the water's chlorine content was increased. The impact of this increase on water-related diseases was then evaluated. Randomization allowed that estimation by ordinary least squares was non-biased. The impact of treatment on the occurrence of diarrhea in children aged zero to five years and on infection of the skin and eyes in children and adults was negligible. However, the intervention of sanitation was noted to increase the families’ quality of life. With the convenience of running water at home and without cost to obtain it, there was an increase in leisure activities, such as television, bath time, and visits of family and friends.
Another study involving experiments and the impact of sanitation on disease is that of Kremer et al. (2010), who studied the effect of sanitation in Kenya, where water is considered to be a common resource without the establishment of property rights; thus,
7 there are individual searches for sources of drinking water, which can lead to the tragedy of the commons. In Kenya, 43% of people drink water from sources that are mostly in private areas. The experiment involved randomly selecting 200 sources of water to receive protection in different phases. This protection inhibited the emergence of new sources, reducing the risk of water contamination. The protected water sources in the first two stages of the process were the treatment group, and the other sources were the control group. Through linear regression, evidence of the impact of the protection indicator of water sources on the decrease of the bactericidal index of the source water could be observed. Kremer et al. (2010) found that water quality improved in individuals' homes, beyond the impact of the protection indicator on the cases of diarrhea in children under three years of age.
2.2. History of Sanitation in Brazil
Compared with other developed countries, Brazil's sanitation services have expanded relatively recently. For example, as noted by Cutler and Miller (2005), access to piped water services in the U.S. increased between the last decade of the nineteenth century and the first two decades of the twentieth century. In less developed countries, progress in basic sanitation has increased over the past century, whereas in Brazil, progress in this sector only emerged in the second half of the twentieth century. Nevertheless, the provision of sanitation to the Brazilian population has experienced significant growth in recent decades. Oliveira (2008) and Turolla (2002) note that this change occurred with the seizure of power by the military governments in the 1960s, through the creation of the National Housing Bank (Banco Nacional de Habitação - BNH). The BNH, by means of the Financial System of Sanitation (Sistema Financeiro do Saneamento- SFS), provided the Employee’s Severance Guarantee Fund (Fundo de Garantia do Tempo de Serviço – FGTS) collection, which financed expansion of the sector. In the 1970s, the National Sanitation Plan (Plano Nacional de Saneamento - Planasa) was created, which focused on investments in sanitation. Planasa gave the newly created State Basic Sanitation Companies (Compania Estaduais de Saneamento Básico - CESBs) exploration rights in water and sewerage services, creating economies of scale and funding them through the BNH. Thus, there was a large-scale expansion of the piped water network during the 1970s. In the following decade, the economic crisis, hyperinflation, and the extinction of the BNH caused a marked decrease in Planasa's
8 investments in the sector’s companies, curbing the expansion of sanitation.
The basic sanitation policy of the 1990s was notable for a series of specific federal programs to reduce inequality in access to sanitation, to modernize the system, and to ensure economic viability for water and sewerage services throughout the country. There was a change in the regulatory framework through decentralization provided in the 1988 Constitution and a series of measures,2 such as the Program for the Modernization of the Sanitation Sector (Programa de Modernização do Setor de Saneamento - PMSS), which began in 1995 to provide technical assistance in the provision of sanitation to the union, the states, and the municipalities. The Concessions Law 8,987 (Lei de Concessões 8.987) (1996) allowed the private sector to participate in the sanitation field, and the Law project n 4,147/2001 created the National Water Agency (Agência Nacional de Água - ANA). In 2007, the General Law of Basic Sanitation (Lei Geral do Saneamento Básico) was approved and set new national guidelines for the sector and for federal policy on basic sanitation (BRAZIL, 2007). With regard to the future, Brazil is a signatory of the Millennium Development Goals of the United Nations, which committed to eight goals, including a two-thirds reduction in infant mortality from 1990 to 2015 and a 50% decrease in lack of access to drinking water by 2015. However, these goals can be met only if the speed of improvement in the level of sewerage is doubled.3
The result of these actions was the improvement of access to water and sewerage. According to Censuses data between 1970 to 2000, the coverage of piped water services increased from 32.8% to 76.6% of households, and the percentage of households connected to the general sewerage network increased from 13.1% to 46.5%. Mendonça and Motta (2005) and Saiani (2007) showed that coverage levels of treated water and sewerage for the population also increased in the last four decades. Increased access to sanitation has also occurred in the pediatric population: Neri (2007) showed that according to National Survey of Household Sampling (Pesquisa Nacional por Amostra de Domicílios - PNAD) data, the access of children aged zero to four years to sewerage increased from 29.14% in 1992 to 40.37% in 2006. Such access increases with the age of the individual.
With regard to the improvement in services, it is worth noting the heterogeneity
2 Saiani and Toledo (2005) and Neri (2009) detailed the other laws on sanitation implemented in the period.
3
9 of the sanitation expansion in Brazil. Figures 1A and 1B show the regional distribution of access to water supply and sewerage systems, respectively, according to 2000 Census data. The figures below show the proportion of inhabitants of each microregion with access to the general water supply (piped into the property or at least into one room) and access to general sewerage. Note that regional dispersion is similar: the microregions of the center-south of the country have more advanced levels of sanitation than the Amazon and northeast microregions. In most of the country, access to water is higher than to the sewerage system.
2.3. Sanitation and Health
The reduction in the infant mortality rate is significant over time. In the 1970 Census, the ratio was 123.2 people who did not complete one year of life per thousand live births. This ratio declined to 83.2, 44.7, and 30.6 deaths per live births in the 1980, 1991, and 2000 Censuses, respectively. In the last decade, there was also a clear improvement in infant mortality rates, although the decline is decreasing compared with previous decades. Figures 2A and 2B show the distribution of infant mortality rates calculated from the ratio of infant deaths (up to one year) to the number of live births for the Brazilian microregions in 1999 and 2008, respectively. In 1999, there were few microregions with an infant mortality rate below 15 deaths per thousand live births, but in 2008, the number of such regions increased in the center-south of the country.4
With respect to world data, there was also improvement in health indices. The number of deaths in children under five years of age declined from 12.5 million in 1990 to less than 9 million in 2008 (UNICEF, 2009), reducing mortality in the zero-to-one-year age group from 90 to 65 deaths per thousand live births. Approximately 15% of child deaths worldwide are still related to diarrhea (UNICEF, 2001). In addition, polio
in children is approaching worldwide eradication.
4
10 Figures 1A and 1B - Access to general piped water and sewerage networks, respectively, in Brazilian microregions in 2000
11 Among other causes of reduction in infant mortality in recent decades, the impact of the Family Health Program (Programa de Saúde da Família - PSF) on infant health was assessed by Serra (2003). The PSF, launched in 1994, provided medical teams and health care agents to bridge the gap between neglected families and health services, working towards primary care and disease prevention. Serra found that the adoption of the PSF helped to reduce the infant mortality rate in São Paulo municipalities with more than 50,000 inhabitants between 1998 and 2001. Rocha (2009) found a reduction in mortality in children, adults, and the elderly in the municipalities that participated in the PSF, and the author demonstrated positive externalities for such policies, which affect school attendance and the labor market.
There are two issues in the econometric use of information on health indicators such as morbidity and mortality: underreporting and reliability of the underlying cause of death or hospitalization. Underreporting may occur, especially in infant mortality, but this rate is expected to have declined in recent years. The proportion of ill-defined causes can be used as a proxy to assess reliability levels. According to the methodology5 of Berenstein and Lacerda (2002), it can be observed that poor definition of causes has decreased each year both for infant mortality and for general mortality and morbidity. National data are shown in Table 1, representing a decrease of more than 50% in ill-defined causes of death in a decade and the maintenance of morbidity levels. This decrease implies that cases of death due to sanitation-related diseases are slightly underestimated in the early years of the sample. In the case of hospitalizations, ill-defined causes do not exceed 2% of the sample and can therefore be considered negligible.
With regard to the cost-benefit analyses involving the improvement of sanitation in Brazil, there is evidence that money spent on sanitation is more effective than that spent on healthcare when the goal is to save a life. Considering the period between 1981 and 2001, Mendonça and Seroa da Motta (2005) indicated that investment in sewage treatment coverage and access to water were, respectively, 17% and 67% more effective than investment in healthcare, whereas investment in reducing illiteracy was even more effective in reducing mortality in children between zero and four years old.
5 The total amount of data found in Section XVIII (symptoms, signs, and abnormal findings of clinical and laboratory exams) of the ICD-10 (International Classification of Diseases, which can be found on the DataSUS site) is considered to be the proportion of ill-defined causes of the total figures provided by the ICD-10.
12 Figures 2 A and 2B - Rate of deaths in children under one year of age per thousand live births in Brazilian microregions in 1999 and 2008
13 Table 1- Proportion of ill-defined causes of mortality and morbidity
Year % ill-defined infant deaths % ill-defined general deaths % ill-defined general hospitalizations 1999 11.54% 15.09% 1.16% 2000 12.30% 14.34% 1.23 2001 10.00% 14.12% 1.30% 2002 8.82% 13.65% 1.21% 2003 8.35% 13.31% 1.20% 2004 6.88% 12.39% 1.30% 2005 5.32% 10.37% 1.30% 2006 4.56% 8.29% 1.34% 2007 4.03% 7.66% 1.43% 2008 3.92% 7.35% 1.30% Source: DATASUS
According to Neri (2007), investment in sanitation can be up to four times more effective than mere investment in healthcare. Such analyses may be underestimated because investment in sanitation can also reduce morbidity, i.e., the expansion of sector indicators can reduce hospitalizations and thus contribute effectively to saving lives.
3. Data and Analysis
3.1. Data
In Brazil, access to running water has always comprised the sanitation sector’s main data, which are provided by the decennial IBGE Census and cover the entire country. The data are also provided by the annual PNAD, which covers the self-representing metropolitan municipalities and whose calculation of access to water is based on the proportion of inhabitants and households in the country that have access to piped water and sewage treatment. The issue of water quality provided to the population has never been the main focus of literature studies on this sector mainly because of the absence of such information in the country.
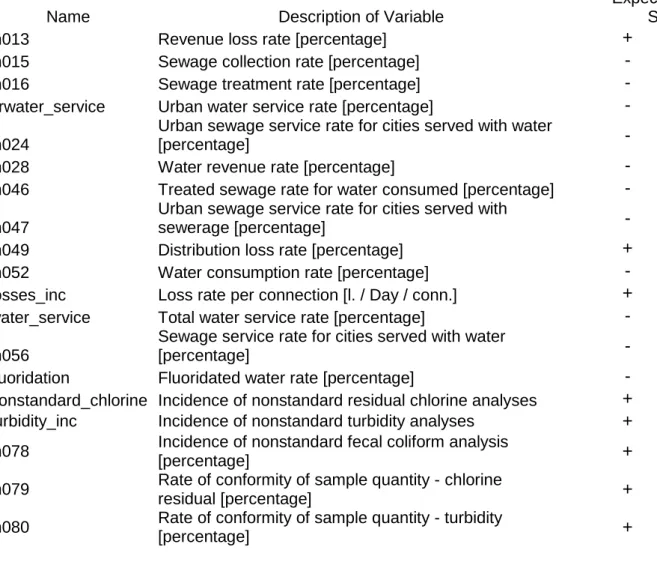
14 access to and quality of the water service. The SNIS is a database linked to the Federal Government’s Ministry of Cities (Ministério das Cidades do Governo Federal), which gathers information about state, regional, and municipal service providers of access to water and sewage treatment. The SNIS was founded in 1995 through the development of the Sanitation Sector’s Modernization Program (Programa de Modernização do Setor de Saneamento) and contains data for 2008 from 4,610 Brazilian municipalities (of a total of 5,564) with 77 indices, 27 sets of data on access to water, 15 sets of data on sewerage systems, 35 sets of financial data about sanitation contractors in the city, 14 sets of general data, such as how sanitation contracts were awarded to particular companies and the municipality's urban population, and 25 sets of data involving water quality. Of these variables, we selected the samples whose rates are more related to health variables and those with numerous observations. These variables are summarized with their expected impact on mortality and morbidity in Table 2.
Table 2 - Description of sanitation variables
Name Description of Variable
Expected Sign
in013 Revenue loss rate [percentage] +
in015 Sewage collection rate [percentage] -
in016 Sewage treatment rate [percentage] -
urwater_service Urban water service rate [percentage] -
in024
Urban sewage service rate for cities served with water
[percentage] -
in028 Water revenue rate [percentage] -
in046 Treated sewage rate for water consumed [percentage] - in047
Urban sewage service rate for cities served with
sewerage [percentage] -
in049 Distribution loss rate [percentage] +
in052 Water consumption rate [percentage] -
losses_inc Loss rate per connection [l. / Day / conn.] +
water_service Total water service rate [percentage] -
in056
Sewage service rate for cities served with water
[percentage] -
fluoridation Fluoridated water rate [percentage] -
nonstandard_chlorine Incidence of nonstandard residual chlorine analyses + turbidity_inc Incidence of nonstandard turbidity analyses +
in078 Incidence of nonstandard fecal coliform analysis
[percentage] +
in079 Rate of conformity of sample quantity - chlorine
residual [percentage] +
in080 Rate of conformity of sample quantity - turbidity
15
total_coliform_inc Incidence of total nonstandard fecal coliform analysis
[percentage] +
in085 Rate of conformity of sample quantity - total coliforms
[percentage] +
in101 Cash sufficiency rate [percentage] -
Source: SNIS
For health indicators, the DataSUS will be used, which contains health information from Brazilian municipalities. Hospitalization data (morbidity) and deaths (mortality) are used as indicators, which will be divided in different ways, generating the information shown in Table 3. Indicators in the data are first separated according to age: in the case of death, this separation provides a rate of infant mortality (up to one year of age), deaths of children between one and 12 months (excluding the neonatal period), from one to four years, and five to nine years. With the same approach, the general rate of hospitalization is divided into up to one year of age, from one to four years of age, and from five to nine years of age. To achieve a measurable rate among municipalities, the relationship between each of these variables and the number of live births in that year was calculated.
Table 3 - Description of Dependent Variables
Name Type Description of Variable
dea_1 to12_n mortality deaths of one to 12 months per thousand live births dea5_9_n mortality deaths of five to nine years per thousand live births dea1_4_n mortality deaths of one to four years per thousand live births hop1_4_n morbidity
hospitalizations of one to four years per thousand live births
hop5_9_n morbidity
hospitalizations of five to nine years per thousand live births
hop_diar_n morbidity
hospitalizations due to diarrhea per thousand live births
hop_dys_inh morbidity
Dysentery hospitalizations per hundred thousand inhabitants
hop_pol_inh morbidity
Polio hospitalizations per hundred thousand inhabitants
hop_trac_inh morbidity
Trachoma hospitalizations per hundred thousand inhabitants
hop_hep_inh morbidity
Hepatitis hospitalizations per one hundred thousand inhabitants
hop_chol_inh morbidity
Cholera hospitalizations per hundred thousand inhabitants
hop_tb_inh morbidity TB hospitalizations per hundred thousand inhabitants hop_tet_inh morbidity
tetanus hospitalizations per hundred thousand inhabitants
16
hop_diph_inh morbidity
diphtheria hospitalizations per hundred thousand inhabitants
hop_diar_inh morbidity
Diarrhea hospitalizations per hundred thousand inhabitants
Source: DATASUS
Additionally, the data can be separated according to morbidity by type of disease. As mentioned, there are numerous sanitation-related diseases. According to the methodology of Guido and Briceño (2005), diarrhea, dysentery, cholera, polio, and hepatitis A and E are diseases caused by pollution and water contamination and are therefore related to sanitation quality. Similarly, trachoma, tuberculosis, tetanus, and diphtheria are diseases related to water scarcity when an individual has difficulties accessing sanitation. Thus, morbidity rates for each disease mentioned have been isolated, and the data were retrieved from the ICD-10 morbidity list in DataSUS. The relationship between each of these variables and the number of inhabitants in each city was calculated to compare across different locations.
The following categories were used as control variables: population data, which are estimates made by IBGE on July 1 of each year from 1999 to 2006 and 2008, with the count conducted in 2007 for each municipality; the municipalities’ Gross Domestic Product (GDP) also provided by IBGE, measured based on 2000 figures, deflated by the National GDP implicit deflator, and calculated by the distribution of added value to main economic activities (IBGE, 2008). The ratio of enrollment in day care and preschool to the population of children between zero and four years of age as measured by the Schools’ Censuses, the vaccination coverage (immunization coverage) in the cities, the percentage of people enrolled in the Family Health Program by municipality, and year dummies were also used. These data with their expected impact on the model are shown in Table 4.
Table 4 - Description of control variables
Name Description of Variable Expected Sign
Gdppc GDP per capita -
ln_pop log municipal population ?
school
enrollment in day care and pre-school/child
17
Psfpcap attendance in the Family Health Program -
vacc_cov vaccination coverage -
Source: IBGE, DATASUS
3.2. Descriptive Analysis
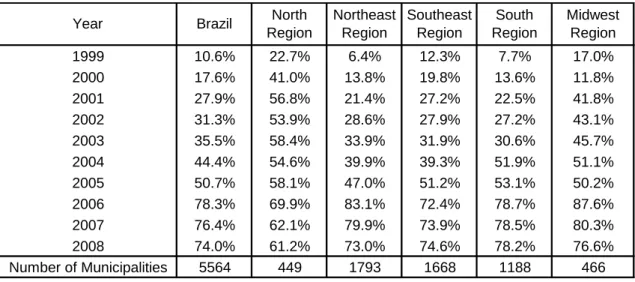
The database refers to the years between 1999 and 2008 and comprises 24,858 observations. However, information is not available for every municipality. As noted by Neri (2009), SNIS data are furnished by sanitation service providers in each municipality. Despite regulation of the information provided, data on water supply and sanitation were provided voluntarily until 2008.6 Thus, sanitation companies that served poorer cities or had worse sanitation rates had little incentive to submit complete information to the Ministry of Cities (Ministério das Cidades) as such submission might lead to selection bias. The initial objective of the SNIS was to cover municipalities with more than 500,000 inhabitants, so few cities were included in the early years of the sample. This fact can be observed in Table 5, which shows the proportion of municipalities in the SNIS database between 1999 and 2008 by region. The number of municipalities covered by SNIS reached only 70% in 2006. Except for the northern region, Brazilian regions have a similar percentage of municipalities in the database in recent years.
Table 5 - Proportion of Brazilian municipalities in the database by year and region
Source: Authors’ elaboration
6 The latest figure available in the SNIS is for the year 2008 and was released in April 2010. In subsequent years, the transmission of sanitation information will become an indispensable requirement for local government access to resources of the Ministry of Cities.
1999 10.6% 22.7% 6.4% 12.3% 7.7% 17.0% 2000 17.6% 41.0% 13.8% 19.8% 13.6% 11.8% 2001 27.9% 56.8% 21.4% 27.2% 22.5% 41.8% 2002 31.3% 53.9% 28.6% 27.9% 27.2% 43.1% 2003 35.5% 58.4% 33.9% 31.9% 30.6% 45.7% 2004 44.4% 54.6% 39.9% 39.3% 51.9% 51.1% 2005 50.7% 58.1% 47.0% 51.2% 53.1% 50.2% 2006 78.3% 69.9% 83.1% 72.4% 78.7% 87.6% 2007 76.4% 62.1% 79.9% 73.9% 78.5% 80.3% 2008 74.0% 61.2% 73.0% 74.6% 78.2% 76.6% Number of Municipalities 5564 449 1793 1668 1188 466 Midwest Region
Year Brazil North
Region Northeast Region Southeast Region South Region
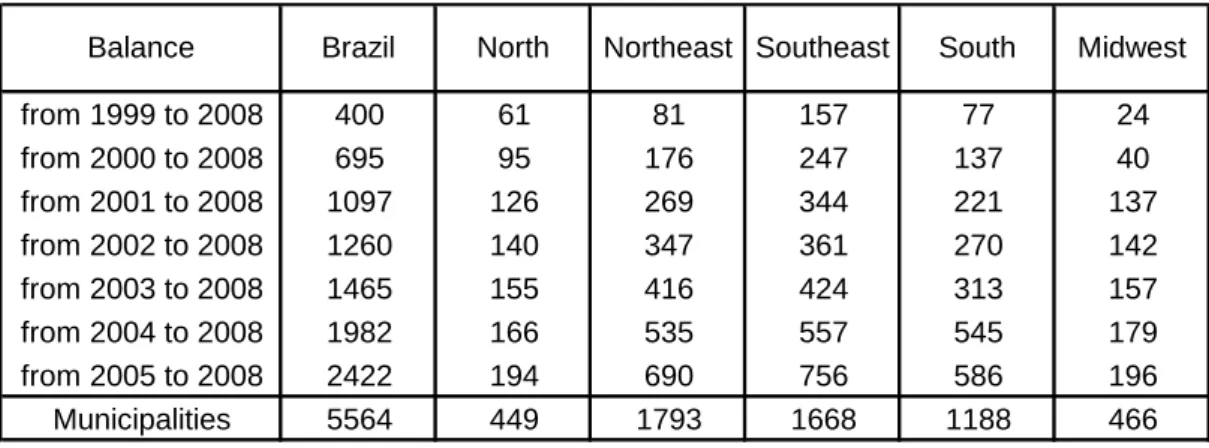
18 In this case in which the panel is unbalanced, municipalities have both joined and left the sample over the years. As a result, few cities are ever present in the sample. Thus, Table 6 shows the number of municipalities that are present in all years in the sample for the stipulated interval and from which balanced panel data can be formed. From 1999 to 2008, for example, there are 400 municipalities with observations in all these years, which may be called a semi-balanced sample, whereas if we consider the shorter sample between 2005 and 2008, there are 2422 cities with information throughout the period, a total of 9688 observations. We noted that proportionally, the south and southeast regions had higher rates of cities with complete information over time, whereas the northeast region had the fewest municipalities reporting sanitation data on a consistent basis. As there were no representative data for Brazil in 1999 and 2000 because less than 20% of Brazilian municipalities were covered, these years have not been included in the following estimates.
Table 6 - Number of municipalities with sanitation data reported every year by region and time period
Source: Authors’ elaboration
In addition to the unbalanced data, another complication should be noted: there are several variables missing within the municipal observations. As stated by Saiani (2007), the SNIS is a self-declaring database that is created by basic sanitation service providers filling out questionnaires and forms. Given that there are more than a hundred pieces of information and sanitation indicators for each observation, there may be imperfections in such data, such as erroneous and missing data, caused by unfamiliarity with the requested information, misunderstanding of the questionnaire, or by the
from 1999 to 2008 400 61 81 157 77 24 from 2000 to 2008 695 95 176 247 137 40 from 2001 to 2008 1097 126 269 344 221 137 from 2002 to 2008 1260 140 347 361 270 142 from 2003 to 2008 1465 155 416 424 313 157 from 2004 to 2008 1982 166 535 557 545 179 from 2005 to 2008 2422 194 690 756 586 196 Municipalities 5564 449 1793 1668 1188 466 South Midwest Balance Brazil North Northeast Southeast
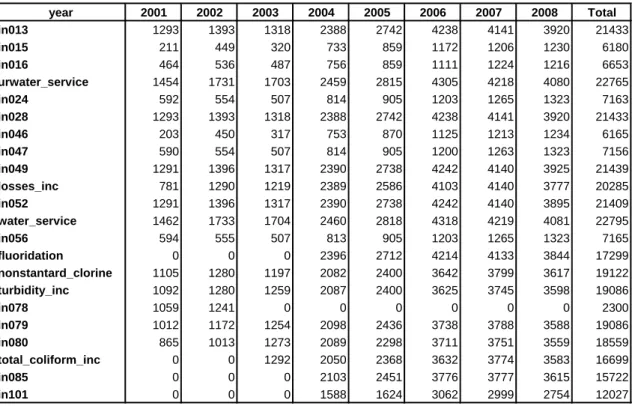
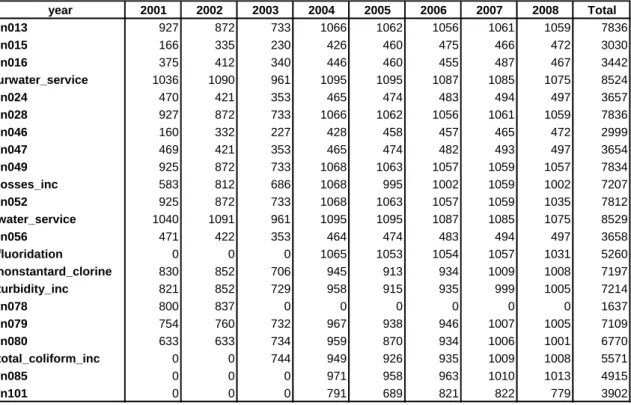
19 omission of data. Table 7 displays the number of complete observations for each sanitation variable mentioned in Table 2 in the sample for all available municipalities between 2001 and 2008.
Sanitation rates for sewerage, such as sewage collection (in015), sewage treatment (in016), and urban sewerage services (in024), reflect fewer observations because the sewerage system is still incipient in Brazil. In some municipalities, the service provider supplies only water and does not include a sewerage service. Variables with more complete information include water service provision and the rate of water loss. Most indices were incorporated into the SNIS database in 2001, and data on water quality, such as fluoridation and fecal coliform rates, only appear in later years.
Table 7 - Number of complete observations for each sanitation variable, reflecting the complete and unbalanced database
Source: Authors’ elaboration
Table 8 contains the same data as shown in the previous table but displays only those municipalities that have submitted data for all years of the sample, i.e., the semi-balanced sample. Even with the semi-semi-balanced panel, the sanitation variables still show differences, albeit smaller ones, in the number of observations throughout the period. The number of full sets of annual information for each sanitation variable never exceeds
year 2001 2002 2003 2004 2005 2006 2007 2008 Total in013 1293 1393 1318 2388 2742 4238 4141 3920 21433 in015 211 449 320 733 859 1172 1206 1230 6180 in016 464 536 487 756 859 1111 1224 1216 6653 urwater_service 1454 1731 1703 2459 2815 4305 4218 4080 22765 in024 592 554 507 814 905 1203 1265 1323 7163 in028 1293 1393 1318 2388 2742 4238 4141 3920 21433 in046 203 450 317 753 870 1125 1213 1234 6165 in047 590 554 507 814 905 1200 1263 1323 7156 in049 1291 1396 1317 2390 2738 4242 4140 3925 21439 losses_inc 781 1290 1219 2389 2586 4103 4140 3777 20285 in052 1291 1396 1317 2390 2738 4242 4140 3895 21409 water_service 1462 1733 1704 2460 2818 4318 4219 4081 22795 in056 594 555 507 813 905 1203 1265 1323 7165 fluoridation 0 0 0 2396 2712 4214 4133 3844 17299 nonstantard_clorine 1105 1280 1197 2082 2400 3642 3799 3617 19122 turbidity_inc 1092 1280 1259 2087 2400 3625 3745 3598 19086 in078 1059 1241 0 0 0 0 0 0 2300 in079 1012 1172 1254 2098 2436 3738 3788 3588 19086 in080 865 1013 1273 2089 2298 3711 3751 3559 18559 total_coliform_inc 0 0 1292 2050 2368 3632 3774 3583 16699 in085 0 0 0 2103 2451 3776 3777 3615 15722 in101 0 0 0 1588 1624 3062 2999 2754 12027
20 the total annual observations for this unbalanced sample because for all the sanitation variables, there are some municipalities that lack complete information.
We can also consider a third sample, which has the full balance for each sanitation variable. Table 9 shows the number of municipalities that have full and balanced information for each indicator. The municipalities belonging to each balanced sanitation set are independent because there might be complete data for some sanitation variables and incomplete ones for others in the same municipality. As in the other samples, the variables related to water service have more observations, and sewage indicators have few balanced municipalities. Therefore, three possible samples can be noted: the unbalanced sample, which includes all observations, the semi-balanced sample, which comprises only the municipalities present in all years, and the balanced sample, which includes only cities with complete data for each sanitation indicator.
Table 8 - Number of complete observations for each sanitation variable based on the
semi-balanced database7
Source: Authors’ elaboration
7 For loss rates per connection, fluoridation, total coliforms (in085), and cash sufficiency (in101), the sample was considered to be balanced between 2004 and 2008. For nonstandard fecal coliform rates, the period between 2003 and 2008 was used to generate the selection criteria. The same range is considered in Table 9 as follows. year 2001 2002 2003 2004 2005 2006 2007 2008 Total in013 927 872 733 1066 1062 1056 1061 1059 7836 in015 166 335 230 426 460 475 466 472 3030 in016 375 412 340 446 460 455 487 467 3442 urwater_service 1036 1090 961 1095 1095 1087 1085 1075 8524 in024 470 421 353 465 474 483 494 497 3657 in028 927 872 733 1066 1062 1056 1061 1059 7836 in046 160 332 227 428 458 457 465 472 2999 in047 469 421 353 465 474 482 493 497 3654 in049 925 872 733 1068 1063 1057 1059 1057 7834 losses_inc 583 812 686 1068 995 1002 1059 1002 7207 in052 925 872 733 1068 1063 1057 1059 1035 7812 water_service 1040 1091 961 1095 1095 1087 1085 1075 8529 in056 471 422 353 464 474 483 494 497 3658 fluoridation 0 0 0 1065 1053 1054 1057 1031 5260 nonstantard_clorine 830 852 706 945 913 934 1009 1008 7197 turbidity_inc 821 852 729 958 915 935 999 1005 7214 in078 800 837 0 0 0 0 0 0 1637 in079 754 760 732 967 938 946 1007 1005 7109 in080 633 633 734 959 870 934 1006 1001 6770 total_coliform_inc 0 0 744 949 926 935 1009 1008 5571 in085 0 0 0 971 958 963 1010 1013 4915 in101 0 0 0 791 689 821 822 779 3902
21 Table 9 - Number of complete observations for each indicator of sanitation based on the balancing of each variable (balanced base) between 2001 and 2008
Source: Authors’ elaboration
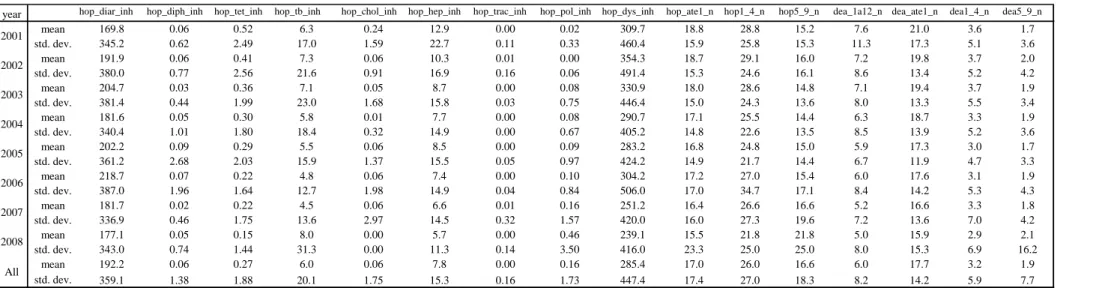
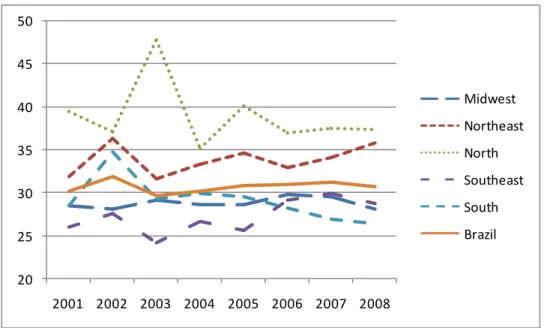
Tables 10 and 11 show the descriptive statistics of dependent variables for the unbalanced and semi-balanced samples. In the two samples, a marked decrease in both children’s mortality and morbidity can be observed. The average mortality of children aged one to 12 months, excluding the neonatal period, was 7.4 per thousand live births in the semi-balanced sample in 2001 and declined to 4.8 in 2008. If we include the neonatal period, the decline reached 30% in both samples, indicating the same trend found in the literature. The average decrease in mortality of children aged one to four years is also evident in the period. However, there was no decrease in deaths of children aged five to nine years. From a regional perspective, the infant mortality rate might be converging in Brazil. As noted in Chart 1 in which the sample is considered to be semi-balanced, in 2001, the average infant mortality of 27 deaths per thousand live births in the worst region (the north) was more than 40% above the average of the best rate (16.6 deaths per thousand live births in the southern region). In 2008, the difference between the worst (northeast) and the best (south) regions was less than 30%. This convergence is also found in the rate of infant morbidity. The variations are similar for hospitalizations by age. year 2001 2002 2003 2004 2005 2006 2007 2008 Total in013 538 538 538 538 538 538 538 538 4304 in015 76 76 76 76 76 76 76 76 608 in016 246 246 246 246 246 246 246 246 1968 urwater_service 871 871 871 871 871 871 871 871 6968 in024 280 280 280 280 280 280 280 280 2240 in028 538 538 538 538 538 538 538 538 4304 in046 71 71 71 71 71 71 71 71 568 in047 209 209 209 209 209 209 209 209 1672 in049 537 537 537 537 537 537 537 537 4296 losses_inc 0 0 0 0 0 0 0 0 0 in052 537 537 537 537 537 537 537 537 4296 water_service 872 872 872 872 872 872 872 872 6976 in056 281 281 281 281 281 281 281 281 2248 fluoridation 0 0 0 0 0 0 0 0 0 nonstantard_clorine 0 0 777 777 777 777 777 777 4662 turbidity_inc 519 519 519 519 519 519 519 519 4152 in078 0 0 0 0 0 0 0 0 0 in079 424 424 424 424 424 424 424 424 3392 in080 318 318 318 318 318 318 318 318 2544 total_coliform_inc 511 511 511 511 511 511 511 511 4088 in085 0 0 0 513 513 513 513 513 2565 in101 0 0 0 958 958 958 958 958 4790
22 Table 10 - Descriptive statistics of dependent variables based on the unbalanced sample
Source: Authors’ elaboration with data from DataSUS
Table 11 - Descriptive statistics of dependent variables based on the semi-balanced sample
Source: Authors’ elaboration with data from DataSUS
year hop_diar_inh hop_diph_inh hop_tet_inh hop_tb_inh hop_chol_inh hop_hep_inh hop_trac_inh hop_pol_inh hop_dys_inh hop_ate1_n hop1_4_n hop5_9_n dea_1a12_n dea_ate1_n dea1_4_n dea5_9_n mean 169.8 0.06 0.52 6.3 0.24 12.9 0.00 0.02 309.7 18.8 28.8 15.2 7.6 21.0 3.6 1.7 std. dev. 345.2 0.62 2.49 17.0 1.59 22.7 0.11 0.33 460.4 15.9 25.8 15.3 11.3 17.3 5.1 3.6 mean 191.9 0.06 0.41 7.3 0.06 10.3 0.01 0.00 354.3 18.7 29.1 16.0 7.2 19.8 3.7 2.0 std. dev. 380.0 0.77 2.56 21.6 0.91 16.9 0.16 0.06 491.4 15.3 24.6 16.1 8.6 13.4 5.2 4.2 mean 204.7 0.03 0.36 7.1 0.05 8.7 0.00 0.08 330.9 18.0 28.6 14.8 7.1 19.4 3.7 1.9 std. dev. 381.4 0.44 1.99 23.0 1.68 15.8 0.03 0.75 446.4 15.0 24.3 13.6 8.0 13.3 5.5 3.4 mean 181.6 0.05 0.30 5.8 0.01 7.7 0.00 0.08 290.7 17.1 25.5 14.4 6.3 18.7 3.3 1.9 std. dev. 340.4 1.01 1.80 18.4 0.32 14.9 0.00 0.67 405.2 14.8 22.6 13.5 8.5 13.9 5.2 3.6 mean 202.2 0.09 0.29 5.5 0.06 8.5 0.00 0.09 283.2 16.8 24.8 15.0 5.9 17.3 3.0 1.7 std. dev. 361.2 2.68 2.03 15.9 1.37 15.5 0.05 0.97 424.2 14.9 21.7 14.4 6.7 11.9 4.7 3.3 mean 218.7 0.07 0.22 4.8 0.06 7.4 0.00 0.10 304.2 17.2 27.0 15.4 6.0 17.6 3.1 1.9 std. dev. 387.0 1.96 1.64 12.7 1.98 14.9 0.04 0.84 506.0 17.0 34.7 17.1 8.4 14.2 5.3 4.3 mean 181.7 0.02 0.22 4.5 0.06 6.6 0.01 0.16 251.2 16.4 26.6 16.6 5.2 16.6 3.3 1.8 std. dev. 336.9 0.46 1.75 13.6 2.97 14.5 0.32 1.57 420.0 16.0 27.3 19.6 7.2 13.6 7.0 4.2 mean 177.1 0.05 0.15 8.0 0.00 5.7 0.00 0.46 239.1 15.5 21.8 21.8 5.0 15.9 2.9 2.1 std. dev. 343.0 0.74 1.44 31.3 0.00 11.3 0.14 3.50 416.0 23.3 25.0 25.0 8.0 15.3 6.9 16.2 mean 192.2 0.06 0.27 6.0 0.06 7.8 0.00 0.16 285.4 17.0 26.0 16.6 6.0 17.7 3.2 1.9 std. dev. 359.1 1.38 1.88 20.1 1.75 15.3 0.16 1.73 447.4 17.4 27.0 18.3 8.2 14.2 5.9 7.7 2001 2002 2003 2004 2005 2006 2007 2008 All
year hop_diar_inh hop_diph_inh hop_tet_inh hop_tb_inh hop_chol_inh hop_hep_inh hop_trac_inh hop_pol_inh hop_dys_inh hop_ate1_n hop1_4_n hop5_9_n dea_1a12_n dea_ate1_n dea1_4_n dea5_9_n
mean 170.0 0.06 0.44 6.3 0.22 12.6 0.00 0.02 310.1 19.4 30.0 16.0 7.4 21.0 3.5 1.7 std. dev. 344.0 0.62 1.94 16.8 1.30 20.6 0.01 0.39 441.3 15.2 26.0 15.6 12.1 18.1 4.8 3.7 mean 175.0 0.07 0.35 7.8 0.05 9.8 0.00 0.00 321.6 18.5 29.0 16.9 6.8 19.4 3.4 1.9 std. dev. 354.4 0.88 2.63 25.2 0.49 15.2 0.13 0.06 459.2 13.6 23.5 16.6 8.7 13.1 4.3 3.2 mean 178.7 0.04 0.31 8.1 0.02 8.4 0.00 0.11 301.3 18.2 28.5 15.2 6.8 19.2 3.8 2.0 std. dev. 326.0 0.50 1.61 28.0 0.31 13.4 0.04 0.79 414.0 14.2 23.1 13.4 8.2 13.5 5.7 3.6 mean 161.5 0.04 0.28 7.9 0.03 8.1 0.00 0.10 255.0 17.5 24.5 14.6 6.0 18.3 3.2 1.8 std. dev. 304.8 0.50 1.48 25.4 0.48 16.4 0.00 0.72 371.3 14.1 20.6 12.3 9.4 14.7 4.7 2.9 mean 172.6 0.05 0.33 6.9 0.07 8.4 0.00 0.09 250.1 17.5 24.1 14.7 5.7 17.0 2.8 1.7 std. dev. 316.9 0.84 2.03 18.5 1.80 13.2 0.05 0.65 377.4 13.9 19.5 11.6 5.9 10.6 3.8 2.7 mean 184.5 0.02 0.20 6.6 0.04 8.2 0.00 0.14 251.7 17.8 25.5 14.9 5.3 16.8 3.0 1.8 std. dev. 337.7 0.19 1.05 17.2 0.48 13.9 0.07 1.06 406.1 15.1 21.0 12.3 6.1 10.6 3.8 3.0 mean 153.2 0.02 0.24 6.0 0.02 7.8 0.02 0.20 209.4 17.1 24.5 15.1 5.3 15.9 3.3 1.8 std. dev. 309.3 0.32 1.72 19.5 0.31 14.4 0.61 1.52 349.1 13.3 19.2 13.6 5.7 9.6 6.2 3.4 mean 139.9 0.12 0.17 8.8 0.00 6.2 0.02 0.53 200.8 14.9 20.1 20.1 4.8 14.8 2.7 1.7 std. dev. 271.2 1.17 1.39 32.0 0.00 10.4 0.27 2.56 333.1 11.9 18.4 18.4 5.1 8.5 3.8 2.9 mean 166.9 0.05 0.29 7.3 0.06 8.7 0.01 0.15 262.5 17.6 25.8 15.9 6.0 17.8 3.2 1.8 std. dev. 321.7 0.70 1.79 23.4 0.86 15.1 0.24 1.22 398.1 14.0 21.7 14.5 8.0 12.8 4.7 3.2 2004 2005 2006 2007 2008 All 2003 2001 2002
23 There was a marked decrease in hospitalizations for children up to one year of age (approximately 20%) and between one and four years of age (decrease of approximately 30%) compared with the number of live births. However, the rate of hospitalizations for children aged five to nine years remained stable in the semi-balanced sample, whereas the variable showed growth in the unbalanced sample.
Chart 1- Variation of the average infant mortality rate in deaths per live births in Brazilian regions between 2001 and 2008
Source: Authors’ elaboration, DataSUS
In terms of hospitalizations by disease, distinct changes can be observed. Although there was a clear decrease in hospitalization rates for tetanus, cholera, hepatitis, and dysentery for every hundred thousand inhabitants, there was an effective increase in the rate of hospitalizations for polio. For other diseases, there are specific variations in a few years of the samples, indicating bursts of morbidity, and there are significant differences in each sample so that it is not possible to ascertain a tendency for the variations. The reduction in the variance of health data should also be noted when studying a more balanced sample as the number of observations is reduced.
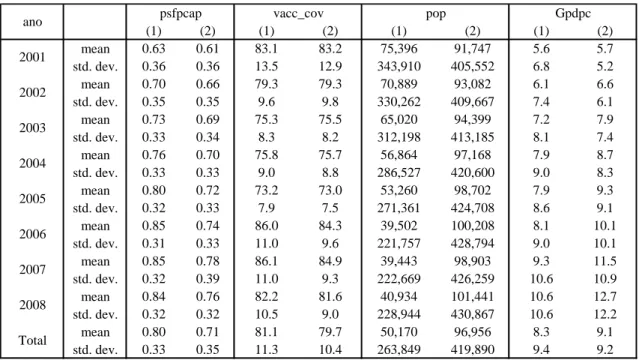
Table 12 details according to each type of sample the descriptive statistics for the control variables described in Table 4. An increase may be observed over time in the proportion of beneficiaries of municipal family health programs and municipal per capita GDP. The population variable shows the difference between the unbalanced and semi-balanced samples. Initially, the average population of municipalities begins to
10 12 14 16 18 20 22 24 26 28 2001 2002 2003 2004 2005 2006 2007 2008 Midwest Northeast North Southeast South Brazil
24 decrease in some years due to the inclusion of smaller municipalities in the sample. In the second sample, the population follows its expected positive change with the exception of 2007 as the population was counted by the IBGE in that year, resulting in a reduction of the estimates made in previous years. With regard to the proportion of people enrolled in the Family Health Program, sharp growth can be observed over the years, with more intensity in the north and northeast regions. Immunization coverage of inhabitants in the municipalities shows a decrease in both samples.
Table 12 - Descriptive statistics for control variables based on the unbalanced (1) and semi-balanced (2) samples
Source: Authors’ elaboration
We will now examine statistics for sanitation indicators. Due to the range of variables involved, it was decided to evaluate them in different blocks. The first block is related to indicators of access to water: urwater_service (urban water service), in052 (water consumption rate), and water_service (total water service). Table 13 shows each variable with statistics for the three samples: the unbalanced sample (column 1), the semi-balanced sample (column 2), and the fully balanced sample (column 3). Note that access to water in urban areas tends to be universal in Brazilian municipalities. The rate of water consumption is the ratio between the volume of water consumed and the amount of water produced; thus, this value’s slight decrease is expressed in the expansion of the denominator for that rate. For total water service, note the deceleration
(1) (2) (1) (2) (1) (2) (1) (2) mean 0.63 0.61 83.1 83.2 75,396 91,747 5.6 5.7 std. dev. 0.36 0.36 13.5 12.9 343,910 405,552 6.8 5.2 mean 0.70 0.66 79.3 79.3 70,889 93,082 6.1 6.6 std. dev. 0.35 0.35 9.6 9.8 330,262 409,667 7.4 6.1 mean 0.73 0.69 75.3 75.5 65,020 94,399 7.2 7.9 std. dev. 0.33 0.34 8.3 8.2 312,198 413,185 8.1 7.4 mean 0.76 0.70 75.8 75.7 56,864 97,168 7.9 8.7 std. dev. 0.33 0.33 9.0 8.8 286,527 420,600 9.0 8.3 mean 0.80 0.72 73.2 73.0 53,260 98,702 7.9 9.3 std. dev. 0.32 0.33 7.9 7.5 271,361 424,708 8.6 9.1 mean 0.85 0.74 86.0 84.3 39,502 100,208 8.1 10.1 std. dev. 0.31 0.33 11.0 9.6 221,757 428,794 9.0 10.1 mean 0.85 0.78 86.1 84.9 39,443 98,903 9.3 11.5 std. dev. 0.32 0.39 11.0 9.3 222,669 426,259 10.6 10.9 mean 0.84 0.76 82.2 81.6 40,934 101,441 10.6 12.7 std. dev. 0.32 0.32 10.5 9.0 228,944 430,867 10.6 12.2 mean 0.80 0.71 81.1 79.7 50,170 96,956 8.3 9.1 std. dev. 0.33 0.35 11.3 10.4 263,849 419,890 9.4 9.2 Gpdpc 2008 Total 2002 2003 2004 2005 2006 2007 2001
25 in the growth of this rate for the decades prior to the universalization of access.
Rates of access to water vary by region. Surprisingly, the midwest has the highest levels of water provision in cities, reaching an average of 79.2% of the population (unbalanced sample). The southeast has municipalities with an average water provision of 76.6%, whereas the south has 65.7%. The north and northeast regions have an average access of 54.2% and 53.8%, respectively. The states with the highest municipal average of this indicator are Mato Grosso do Sul (86.9%) and São Paulo (83%), whereas those with the lowest averages are Amapá (36.9%) and Pará (36.2%). A similar situation appears for urban water services. In the midwest, southeast, and south, the average of this variable is approximately 95%; in the northeast, the average is 86.2%, and in the north, it is 80.3%. The variations in the average of this index for Brazilian regions can be observed in Chart 2.
The second block covers sanitation indicators related to production inefficiency variables. Included in this block are variables in013 (revenue loss rate), which considers the total water available for distribution and not billed, in028 (water revenue rate), which is the ratio between the volume of water billed and produced, in049 (distribution loss rate), which is the difference between the volume of water produced and consumed in relation to the total produced, losses_inc, which reports the volume of losses by the Table 13 - Descriptive statistics of access to water indicators based on the unbalanced (1), semi-balanced (2), and balanced (3) samples
Source: Authors’ elaboration
(1) (2) (3) (1) (2) (3) (1) (2) (3) mean 86.4 88.6 87.9 65.7 64.5 62.7 65.3 68.6 65.6 std. dev. 20.5 17.9 17.9 39.2 27.6 19.5 26.5 25.4 25.3 mean 87.6 89.1 88.8 63.1 61.9 60.4 65.6 69.6 67.8 std. dev. 18.4 16.7 16.3 31.1 18.4 18.1 25.6 25.0 24.6 mean 89.3 90.0 90.6 61.9 62.8 60.2 63.3 67.9 68.8 std. dev. 19.0 18.1 17.3 23.9 23.8 17.7 25.5 25.3 24.9 mean 91.7 91.0 90.7 65.1 62.1 60.6 66.5 71.4 69.6 std. dev. 16.7 17.0 17.1 22.7 18.5 17.8 24.8 24.7 24.5 mean 92.9 92.1 91.8 65.4 62.2 60.0 67.0 72.6 70.8 std. dev. 15.0 15.3 15.3 19.5 18.2 18.0 24.4 24.0 23.8 mean 92.6 91.9 91.1 66.8 62.9 60.4 64.3 73.2 71.1 std. dev. 15.9 16.0 16.7 20.0 19.5 20.1 25.1 24.1 24.1 mean 91.8 91.1 90.1 66.0 62.4 59.8 65.3 73.8 71.5 std. dev. 16.1 17.2 18.1 20.1 17.6 18.1 25.0 24.5 24.4 mean 91.5 90.7 89.8 66.7 62.2 59.3 65.6 73.5 71.8 std. dev. 16.3 16.9 17.4 20.8 17.7 18.2 24.7 24.3 24.4 mean 91.2 90.6 90.1 65.7 62.6 60.4 65.4 71.4 69.6 std. dev. 16.9 16.9 17.1 23.1 20.2 18.5 25.1 24.7 24.6 2008 Total 2002 2003 2004 2005 2006 2007
year urwater_service in052 water_service
26 Chart 2 - Variation in the average rate of access to water in Brazilian regions
between 2001 and 2008 according to the semi-balanced sample
Source: Authors’ elaboration
quantity of active water connections, and in101 (cash sufficiency rate), which is a financial variable that measures the relationship between revenues and expenditures of sanitation companies in the municipalities.
Descriptive statistics of the indicators for this block are shown in Table 14. Brazilian inefficient production data show a high rate of water supply loss in relation to the rest of the world. It is clear that reduction in inefficiency has not been the focus of public action as these indices have shown little or no improvement in the last decade. This finding is most noticeable in Chart 3, which is based on the semi-balanced sample and reports the variation in the average loss rate among regions of the country. According to the unbalanced sample, the rate of revenue loss over the years differs among regions of the country; in 2008, the average for this rate reached 21.4% in the south and 23.2% in the southeast. In the northeast region, the average was 34.2%. In some sanitation companies of the north and northeast regions, the revenue loss rate of water exceeds 70%.8 Conversely, the average cash sufficiency rate for sanitation companies in the cities remained relatively constant since 2004, during a period of national economic growth. 8 See Simão (2011). 40 50 60 70 80 90 2001 2002 2003 2004 2005 2006 2007 2008 Midwest Northeast North Southeast South Brazil
27 Table 14 - Descriptive statistics of production inefficiency indicators based on the unbalanced (1), semi-balanced (2), and balanced (3) samples9
Source: Authors’ elaboration
9The losses_inc variable did not show observations in which there would be complete balancing of this indicator in each year in the sample; therefore, there are no values in that column (3). Cash sufficiency rate data (in101) only exist since 2004.
(1) (2) (3) (1) (2) (3) (1) (2) (3) (1) (2) (3) (1) (2) (3) mean 29.8 30.2 32.0 70.2 69.8 68.0 34.3 35.5 37.3 300.3 315.5 . . . std. dev. 40.5 31.4 22.3 40.5 31.4 22.3 39.2 27.6 19.5 258.4 247.4 . . . mean 30.7 31.9 33.3 69.2 68.1 66.7 36.9 38.1 39.6 295.9 312.3 . . . std. dev. 36.1 21.4 21.1 36.2 21.4 21.1 31.0 18.4 18.1 224.4 221.0 . . . mean 30.4 29.7 34.0 69.6 70.3 66.0 38.1 37.2 39.8 280.7 288.1 . . . std. dev. 27.8 28.2 21.3 27.8 28.2 21.3 23.9 23.8 17.7 214.1 207.5 . . . mean 26.1 30.2 33.4 73.9 69.8 66.6 34.9 37.9 39.4 327.2 390.0 102.4 108.2 107.5 std. dev. 28.2 22.9 21.2 28.2 22.9 21.2 22.7 18.5 17.8 479.3 536.8 55.2 52.6 48.5 mean 26.8 30.8 34.2 73.2 69.2 65.8 34.6 37.8 40.0 247.9 296.9 95.7 98.3 98.4 std. dev. 24.7 21.9 22.3 24.7 21.9 22.3 19.5 18.2 18.0 207.7 215.5 47.9 52.5 48.6 mean 26.1 31.0 35.5 73.9 69.0 64.5 33.2 37.1 39.6 235.0 295.0 98.9 104.5 101.6 std. dev. 26.7 23.8 24.6 26.7 23.8 24.6 20.0 19.5 20.1 203.4 224.4 62.7 65.4 50.9 mean 26.3 31.2 36.3 73.7 68.8 63.7 34.0 37.6 40.2 301.3 385.9 111.3 137.9 105.4 std. dev. 23.0 20.3 19.0 23.0 20.3 19.0 20.1 17.6 18.1 571.7 844.7 419.2 793.1 58.3 mean 25.9 30.8 36.9 74.1 69.2 63.1 33.4 37.8 40.7 230.8 293.7 102.5 103.3 102.3 std. dev. 25.3 21.6 20.2 25.3 21.6 20.2 20.8 17.5 18.2 198.4 213.7 56.6 46.3 43.1 mean 27.0 30.7 34.5 73.0 69.3 65.5 34.3 37.4 39.6 269.4 325.5 102.9 111.0 103.0 std. dev. 27.6 23.9 21.6 27.6 23.9 21.6 23.1 20.2 18.5 353.2 428.3 215.1 367.3 50.2 2005 2006 2007 2008 Total losses_inc in101 2001 2002 2003 2004
28 Chart 3 - Variation in the average for the revenue loss rate in Brazilian regions between 2001 and 2008 based on the semi-balanced sample
Source: Authors’ elaboration
The third block refers to sanitation indicators. This block contains the following variables: in015 (sewage collection rate), in016 (sewage treatment rate), in024 (urban sewage service rate for municipalities served with water), in046 (treated sewage rate for water consumed), in047 (urban sewage service rate for municipalities served by sewage), and in056 (total sewage service rate for municipalities with water service). Table 15 shows the descriptive statistics of variables in this block according to each sample type.
The expansion of sewage services in the country was minimal, occurring at a slower rate than the rates of access to water even though access to water began from lower levels. According to the unbalanced sample, the regional distribution of the sewage collection rate in 2008 shows that the southeast region had the best indicators with an average of 67.3% coverage of sewage collection. The south, midwest, northeast, and north had a municipal average coverage of 44.3%, 33.6%, 30.8%, and 25.7% in the unbalanced sample, respectively. Water treatment had a higher average coverage in the northeast, south, and midwest regions, and surprisingly, the southeast had the worst rates in the three samples. It should be noted that sanitation block variables are more likely to suffer from selection bias because of their small number of observations. There is great variance in the observations of the sewage treatment rate (in016) because in all
20 25 30 35 40 45 50 2001 2002 2003 2004 2005 2006 2007 2008 Midwest Northeast North Southeast South Brazil
29 the years of the sample, more than 10% of the observations of this indicator were zero, whereas more than half of the observations reached 100% of the population in the municipality. The improvement of the other indicators of sewage over time was somewhat better.
Based on the semi-balanced sample, chart 4 shows the annual variation of sewage collection in Brazilian regions during the 2000s. It would appear that none of these regions had an average rate exceeding 70%; however, the improvement over the sample is slight with the exception of the south region. The problem of erroneous data may be observed in variables in this block. Approximately 1% of the variables for the collection and treatment of sewage report a degree of coverage of more than 100%, suggesting erroneous information provided by the sanitation companies that has not been corrected in the database. These erroneous data may explain the unexpected decline of this rate in 2003, particularly in the midwest region.
The next block contains variables that measure water quality: fluoridation (the rate of water fluoridation), nonstandard_chlorine (the incidence of the analyses of nonstandard residual chlorine), turbidity_inc (the incidence of non-standard residual chlorine analysis), in078 (the incidence of nonstandard fecal coliform analysis),
Chart 4 - Variation in average rate of sewage collection in Brazilian regions between 2001 and 2008 based on the semi-balanced sample
Source: Authors’ elaboration
10 20 30 40 50 60 70 80 2001 2002 2003 2004 2005 2006 2007 2008 Midwest Northeast North Southeast South Brazil
30 Table 15 - Descriptive statistics of sewage based on the unbalanced (1), semi-balanced (2), and balanced (3) samples
Source: Author’s elaboration
(1) (2) (3) (1) (2) (3) (1) (2) (3) (1) (2) (3) (1) (2) (3) (1) (2) (3) mean 47.3 47.7 33.9 66.4 67.0 74.1 44.7 45.1 47.2 24.7 25.9 27.8 44.8 45.3 47.4 39.7 40.1 40.8 std. dev. 39.1 39.8 30.5 51.1 43.4 40.0 37.6 37.4 34.3 32.7 34.1 26.5 38.0 37.8 34.3 34.6 34.6 30.7 mean 50.1 50.8 34.5 64.4 66.3 78.9 52.4 52.7 48.5 26.1 26.8 31.5 53.0 52.9 48.9 46.2 47.1 42.1 std. dev. 31.2 31.4 30.7 45.8 45.7 40.7 35.7 35.4 34.6 29.7 29.8 28.9 36.3 35.7 34.9 33.0 33.1 31.0 mean 32.4 34.2 34.4 69.7 70.5 72.8 47.0 46.1 50.3 22.5 23.7 28.4 47.0 46.1 50.5 39.1 39.2 42.6 std. dev. 27.7 28.1 29.0 56.4 61.2 38.0 35.9 35.2 35.3 24.4 24.6 26.2 35.9 35.2 35.3 31.3 31.1 31.3 mean 46.6 47.2 34.3 69.0 69.1 80.9 52.3 52.3 51.0 28.2 29.2 30.4 52.3 52.3 51.2 43.1 45.2 43.0 std. dev. 30.9 31.2 29.5 45.6 46.7 44.5 35.7 36.2 34.3 28.5 29.0 28.4 35.7 36.2 34.3 32.1 32.9 30.2 mean 47.4 46.6 35.1 70.3 70.5 81.9 55.2 53.2 52.2 30.0 29.7 33.1 55.2 53.3 52.4 45.5 45.9 44.1 std. dev. 30.0 30.4 29.7 45.4 45.4 41.1 36.1 36.1 34.3 29.8 28.9 30.3 36.1 36.1 34.3 32.7 32.8 30.2 mean 50.7 47.0 35.8 75.3 75.7 83.5 60.0 53.7 53.1 35.3 32.5 34.8 59.9 53.6 53.2 48.0 46.3 44.9 std. dev. 29.4 30.1 28.1 40.7 39.1 35.0 36.0 36.1 34.5 30.5 28.7 27.5 36.0 36.1 34.5 32.4 32.9 30.5 mean 52.7 48.2 34.0 72.8 75.1 85.8 61.7 54.1 54.2 35.5 33.1 33.8 61.7 54.4 54.4 51.1 47.8 47.1 std. dev. 30.7 30.3 26.1 41.9 38.9 30.5 35.8 35.9 34.6 31.7 28.9 25.6 35.8 35.8 34.6 33.0 33.3 31.3 mean 54.3 50.3 35.6 71.9 75.9 87.0 61.7 53.9 54.6 36.7 35.2 34.6 61.7 53.9 54.8 50.1 47.3 47.4 std. dev. 39.1 50.2 29.9 42.4 39.1 30.1 35.8 35.9 34.2 36.0 39.2 25.5 35.8 35.9 34.2 32.6 33.3 30.9 mean 49.8 47.2 34.7 70.9 71.5 80.6 56.3 51.6 51.4 32.3 30.5 31.8 56.4 51.7 51.6 46.6 45.1 44.0 std. dev. 32.8 35.0 29.1 45.0 44.9 38.0 36.4 36.2 34.6 31.7 31.0 27.3 36.5 36.3 34.6 32.9 33.2 30.8 2007 2008 Total 2001 2002 2003 2004 2005 2006
in015 in016 in024 in046 in047 in056
31 in079 (the conformity rate of the number of samples - residual chlorine), in080 (the conformity rate of the number of samples - turbidity), total_colif_inc (the incidence of nonstandard total coliform analyses), and in085 (the conformity rate of the number of samples - total coliforms). The variables on the incidence of residual chlorine analysis, turbidity, fecal coliform, and the non-standard total were calculated as the ratio between the quantity of samples for analysis with nonstandard results and the number of samples analyzed for the measurement of these variables. The water fluoridation rate is the ratio between the volume of water and the total produced and processed, and the conformity rates of the quantities of residual chlorine and turbidity samples are calculated as the percentage ratio of the quantity of samples analyzed for measurement, which appears in the denominator of the incidence of these variables, and the minimum quantity of sample required for these analyses. Descriptive statistics of these indicators are shown in Table 16.
For most indicators, there is a reduction in values over time, suggesting an improvement in water quality with the exception of turbidity, which remained almost constant during the last decade, and the incidence of nonstandard total coliform, which only has results for the first two years of the sample. Figure 5 shows the variation of the average incidence of fecal nonstandard coliform (colif_total_inc) among Brazilian regions based on the semi-balanced sample. Some convergence between the indicator values in recent years can be observed. However, the south, southeast, and midwest regions in that order continue to show the best indicators of basic sanitation in the country.
It is worth noting that the statistics cited are reported at municipal levels. Data for the national level do not necessarily coincide with those presented here because some municipalities lack information, which can cause bias in relation to national statistics, and the statistics cited in the present study are not weighted by total municipal population. Thus, small municipalities, with perhaps the worst sanitation and health data, are over-represented in these samples, whereas large centers are underrepresented. For the national level, therefore, the changes observed in the data shown in the present study probably under-represent the variation for the country as a whole over the last decade. Nonetheless, this analysis is useful to observe the heterogeneity of basic sanitation in the country and its variations and to convey the focus of the present study to the municipalities.