Revista Brasileira de
Engenharia Agrícola e Ambiental
Campina Grande, PB, UAEA/UFCG – http://www.agriambi.com.br
v.21, n.2, p.134-140, 2017
Thermal and ammonia concentration gradients
in a rabbit barn with two ventilation system designs
DOI: http://dx.doi.org/10.1590/1807-1929/agriambi.v21n2p134-140
Jorge Flores-Velázquez
1, Federico Villarreal-Guerrero
2, Waldo Ojeda
1& Agustín Ruíz-García
3A B S T R A C T
Rabbit barns are of economic importance in central Mexico, where rabbit breeders use rustic buildings for production. In such barns, climate conditioning is mostly based on natural ventilation (NV) where the lack of a well-designed NV system may be a limiting factor. In this study, computational fluid dynamics was used to analyse the performance of the NV system in a 24 x 4 x 4.8 m typical Central Mexico rabbit barn with a density of 20 rabbits m-2 of cage. The barn included both side vents at 1.2 m in height from the ground. Results indicated exchange rates of 0.052 and 2.9 x 10⁻⁴ m3 m-2 s-1 when the wind direction was simulated as orthogonal and parallel to the side vents, respectively, suggesting the orthogonal direction favoured the exchange rate. However, such conditions produced an accumulation of ammonia underneath the rabbit cages. Thus, a design modification including a lower inlet vent was analysed. Such modification substantially decreased the concentration gradients of temperature and ammonia.
Gradientes de temperatura e concentração de amônia
em fazenda cunícula com dois sistemas de ventilação
R E S U M O
A produção de coelhos em sistemas intensivos é importante para a economia da região central do México, onde os criadores usam instalações rústicas para produção. O acondicionamento climático nesse tipo de instalação ocorre, basicamente, por ventilação natural; no entanto, a arquitetura desses galpões é fator limitante para uma ventilação eficiente. Neste trabalho foi usada Dinâmica Computacional de Fluido para analisar o desempenho da ventilação natural em um típico galpão de 24 x 4 x 4,8 m construído na parte central do México. Foi usada uma densidade de 20 coelhos m-2 para as simulações. O galpão tinha dois lados de ventilação de 1.2 m de altura desde o solo. Os resultados indicaram taxas de câmbio de 0,052 e 2,9 x 10⁻⁴ m3 m-2 s-1 quando se simulou a direção do vento em ortogonal e paralelo às saídas de ar resultando em zero de concentração sobre as gaiolas; porém uma acumulação de gás ocorreu abaixo das gaiolas devido a uma distribuição não uniforme do ar. Com base nos resultados foram realizadas modificações na arquitetura das instalações, incluindo a abertura de entrada de vento na parte inferior do galpão. Tais modificações permitiram diminuir, notoriamente, os gradientes de concentração térmica e amoníaco.
Key words: turbbulence model pressure
convective effect CFD simulation animal confort
Palavras-chave: modelo de turbulência pressão
efeito convectivo simulações de FDC conforto animal
1 Instituto Mexicano de la Tecnología del Agua (IMTA). Juitepec, Morelos, Mexico. E-mail: [email protected]
2 Universidad Autónoma de Chihuahua/Facultad de Zootecnia y Ecología. Chihuahua, Chihuahua, Mexico. E-mail: [email protected] (Corresponding author) 3 Universidad Autónoma Chapingo. Chapingo, Estado de Mexico, Mexico. E-mail: [email protected]
Introduction
For optimal productivity, an animal production system should be capable of providing an appropriate climate. The inside air mixed with the gases generated during the production process should be replaced by clean air at appropriate rates. This would maintain the climate and the air quality within the comfort zone.
In a rabbit barn, ammonia (NH3) is produced from the degradation of the rabbit´s urine and excrement. Under high ammonia concentrations in the air, rabbits can present with anorexia, breathing issues, cyanosis and fever (Makarenko et al., 1992). The degradation process is accelerated under high temperatures (Praag et al., 2010). Exposures to high doses of ammonia (i.e. > 400 ppm), would produce high mortality rates in dogs, rabbits, guinea pigs and squirrel monkeys (Smith et al., 2004). However, a barn should ensure significantly lower ammonia levels to safeguard the rabbit’s welfare.
In Central Mexico, rabbit barns have increased for meat and semen production. Most of these barns have been installed in pre-existing naturally vented buildings, where high concentrations of ammonia and high air temperatures seriously limit production, especially during the hottest part of the year. An alternative to control the climate of these barns is through mechanical ventilation; however, the costs of such systems lead to natural ventilation (NV) being the preferred method. Thus, it may be appropriate to analyse the efficacy of the existing NV system of these barns and propose alternatives for improving their climate.
Computational fluid dynamics (CFD) has been extensively used in studies of air fluxes in animal buildings (Sven & Davis, 2002). With this tool, the inside climate is analysed based on the boundary conditions of the system. This procedure, without being substitutive, helps to save time and investment of experimentation (Norton et al., 2007).
In this study, the effect of the NV system design on the thermal and ammonia concentration gradients of a typical Mexican rabbit barn was evaluated using CFD. Two wind directions were studied. Furthermore, a new design of the ventilation system was proposed and the improvements on the climate produced are discussed.
Material and Methods
The experiments took place in a rabbit barn located at the animal production unit of the Universidad Autónoma Chapingo, Chapingo, Mexico, located at 19º 29´ N and 98º 53´ W, at an altitude of 2,250 m. The facility had a representative design commonly used by rabbit breeders in the central region of Mexico. The climate of the region is classified as humid temperate one, C(wo)(w)b(i’)g (García, 1981), with an annual mean air temperature and relative humidity of 15.9 ºC and 67.7%, respectively.
In the region, the hottest months are April, May and June, with mean air temperatures and relative humidities of 18.4, 19.4, 18.9 and 50.6, 60.0, 73.9, respectively. Outside hot conditions increase the inside air temperatures and concentrations of ammonia. Therefore, climate measurements were performed during this period in the year 2012.
For the outside climate, a weather station monitoring temperature and relative humidity (S-TBH-M002, Onset Computer Co., Bourne, MA, USA; ±0.2 ºC, ±2.5%), solar radiation (S-LIB-M003, Onset Computer Co., Bourne, MA, USA; 300-1100 nm, ±10 W m-2), and wind speed (S-WSA-M003, Onset Computer Co., Bourne, MA, USA, ±1.1 m s-1) was installed nearby the rabbit barn at eight metres above the ground level.
Inside the barn, measuring devices included eight fine-wire thermocouples (FW3, Type E, Campbell Scientific Inc., Logan, UT, USA; ±0.3 ºC) distributed 0.2 m above and at 4, 8, 12 and 18 m along the cages (four on each side). At the centre of the barn, one pyranometer (CMP 3, Kipp & Zonen, The Netherlands; 310- 2800 nm, ±5%), one temperature and relative humidity probe (S-TBH-M002, Onset Computer Co., Bourne, MA, USA; ±0.2 ºC, ±2.5%), and one wind velocity sensor (WINDSONIC4, Campbell Scientific Inc., Logan, UT, USA; ±2% @ 12 m s-1, ±3º), were installed. All the scanned measurements were averaged every 5 min and then logged to an Onset datalogger.
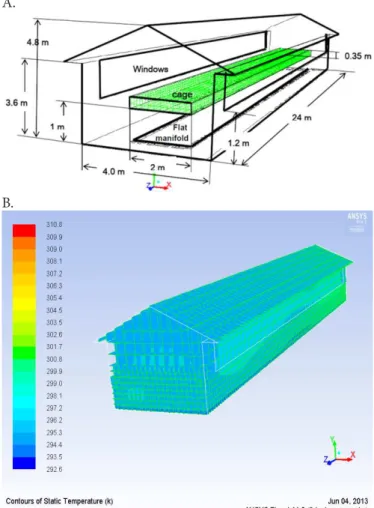
To analyse the ventilation rates and the climate behaviour of the barn, a computational model was built based on the dimensions and characteristics of the experimental rabbit barn (Figure 1A). The model (geometry) built (Figure 1B) was inserted in a computational domain using the software WORKBENCH (ver. 14.5, ANSYS inc. PA, USA). The geometry was made up of a mesh of 1,432,130 elements with a refinement
Figure 1. Schematic of the experimental rabbit barn (A), and the computational mesh generated (B)
in the rabbit cages and the collector floor. The facility had a total of 10 cages (2 x 2.4 x 0.35 m) with 96 rabbits inside each cage (20 rabbits m-2 of cage).
The simulations describing the climate inside the barn were executed in FLUENT (ver. 14.5, ANSYS Inc., PA, USA). The boundary conditions used as input to the software are listed in Table 1. For the model validation, outside air temperature measurements were used as inputs and the values of air temperature measured during the experiments at eight points within the rabbit barn were compared to the values simulated.
With the aim of analysing the effect of the barn direction on the climate behaviour, scenarios simulated included a (1) wind direction parallel to the side vents of the barn and a (2) wind direction normal to the ridge. Besides the original vent configuration (Figure 1A), an alternative design with the inlet vent at 0.2 m of height and the outlet vent at 1.2 m was also simulated. With the new design, improvements on ventilation rates, profiles of air temperatures and ammonia concentrations were discussed.
u - wind speed, m s-1;
Γ - diffusion coefficient, m2 s-1; and, S - source term.
The simulation was performed assuming steady-state conditions. In addition, the barn airflow patterns were assumed to be turbulent and the k-ε model was applied to solve for the kinetic energy (k) and the viscous dissipation rate of turbulent energy (ε). This model makes a good representation of the turbulent nature of fluid flow within controlled environments (Mistriotis et al., 1997; Norton et al., 2009), and it is one of the most commonly used (Bjerg et al., 2013).
Because low wind speeds prevailed in the experimental site through the year, with an average wind speed and gust speed of 1.89 and 4.34 m s-1, respectively, only free and mixed convection may drive air exchange, instead of forced convection. Similar convection regimes were simulated in this study as in previous research performed at the same location (Romero-Gómez et al., 2010).
Air movement was assumed to be a function of the temperature gradient (Eq. 2) and the Boussinesq model was used (Boulard et al., 1996). The density was treated as a constant value to get faster convergence in all the equations to be solved, except for the buoyancy term in the momentum equation, as in the study by Ferziger & Peric (2002).
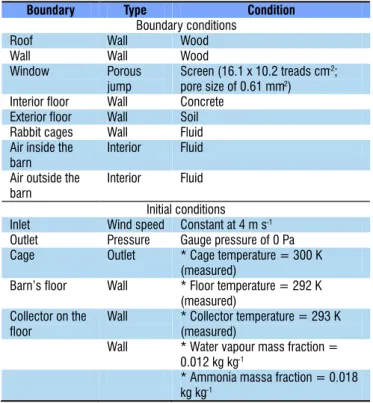
*Simulated as constant sources
Boundary Type Condition Boundary conditions
Roof Wall Wood
Wall Wall Wood
Window Porous
jump
Screen (16.1 x 10.2 treads cm-2;
pore size of 0.61 mm2)
Interior floor Wall Concrete
Exterior floor Wall Soil
Rabbit cages Wall Fluid
Air inside the barn
Interior Fluid
Air outside the barn
Interior Fluid
Initial conditions
Inlet Wind speed Constant at 4 m s-1
Outlet Pressure Gauge pressure of 0 Pa
Cage Outlet * Cage temperature = 300 K
(measured)
Barn’s floor Wall * Floor temperature = 292 K
(measured) Collector on the
floor
Wall * Collector temperature = 293 K
(measured)
Wall * Water vapour mass fraction =
0.012 kg kg-1
* Ammonia massa fraction = 0.018
kg kg-1
Table 1. Details of components of the model used for the simulations of the rabbit barn
Climate modelling
The CFD follows the Navier Stokes equations, expressed as a group of partial differential equations. Such equations can be expressed as in Eq. 1 (Anderson, 1995).
( )
(
)
(
)
u S
t φ
∂ ρφ
+ ∇ ρ φ = ∇ Γ∇φ + ∂
where:
∂ - derivative; ρ - density, kg m-3; t - time, s;
∇ - divergence;
ϕ - the state variable being considered (i.e. air tempe-rature, K, and ammonia, g kg-1);
(
)
i 1 T Ti
ρ = ρ − β −
where:
ρ - density, kg m-3;
β - coefficient of thermal expansion, K-1; T - air temperature, K; and,
i - inside.
Mass diffusion within turbulent flows
In this study, the species transport model available in FLUENT was used to simulate the mass transport of ammonia. Such a model uses the dilute approximation (Flick’s law) to model mass diffusion. For turbulent flows, mass diffusion can be written as in Eq. 3 (Ansys-Fluent, 2003):
i i,m i T,i
T
J D Y D
T
∇
= ρ ∇ −
where:
Ji - diffusion flux of species i (ammonia), m 2 s-1;
ρ - density of the mixture, kg m-3;
Di,m - mass diffusion coefficient for species i in the mixture m, m2 s-1;
DT, i - turbulent diffusion coefficient, m2 s-1; Yi - mass fraction of species i;and, T - temperature of the flow, K.
Results and Discussion
Model validation
The values of air temperature measured at eight points within the rabbit barn during the experiments were compared (1)
to the values simulated at the same points. Means of the measured and simulated air temperatures were 25.3 ± 0.3 °C and 25.8 ± 0.8 °C, respectively. The percentage errors calculated from the eight points fluctuated from 0.26 to 9.7%. These values indicate a good agreement and the model could be used to analyse the climate behaviour of the barn. Some studies have assumed good model performance when percentage errors are lower than 20% (Bailey, 2003; Flores-Velázquez & Montero, 2008; Tamimi et al., 2013).
Based on the previous results, the model was used to predict the air temperature distribution within the barn. Furthermore, the model also served to predict air velocities and ammonia concentrations. For that, the model had as boundary conditions the mean measured outside air velocities and a constant source of ammonia simulated beneath the rabbit cages.
With regard to ammonia, U.S. regulation indicates that workplace exposure to ammonia should not exceed 25 ppm (= 0.025 g kg-1) during an 8-hour period (NIOSH, 2011). Perkins & Lipman (1995) recommended these standards should also be applied to animal environments. Since the rabbits are exposed to ammonia 24 h every day, a constant source of ammonia lower than 25 ppm (i.e. 18 ppm = 0.018 g kg-1) was simulated to estimate the spatial distribution of this gas. If a different source of ammonia is simulated, the distribution patterns are assumed not to change.
Scenario I. Simulated wind direction parallel to the vent inlets
Cross-sectional profiles of wind speed and air temperature at 4, 12 and 18 m along the length of the barn are presented in Figure 2. When the outside wind speed was 4 m s-1, there were reductions in the air velocities of up to 90% inside the barn, resulting in a low ventilation rate of 2.9 x 10⁻⁴ m3 m-2 s-1. Furthermore, the first and second section presented a higher homogeneous distribution compared to the third section. The end wall of the third section is closed and the air may accumulate within that zone.
Under the simulated wind speed regimes, air temperature was almost homogeneous in the three cross sections analysed, except for the locations close to the floor, where temperature
values were 3–4 K lower. Therefore, while in the horizontal direction thermal gradients were practically null, there were gradients in the vertical direction caused by the temperature differences between the floor collector and the rabbit cages.
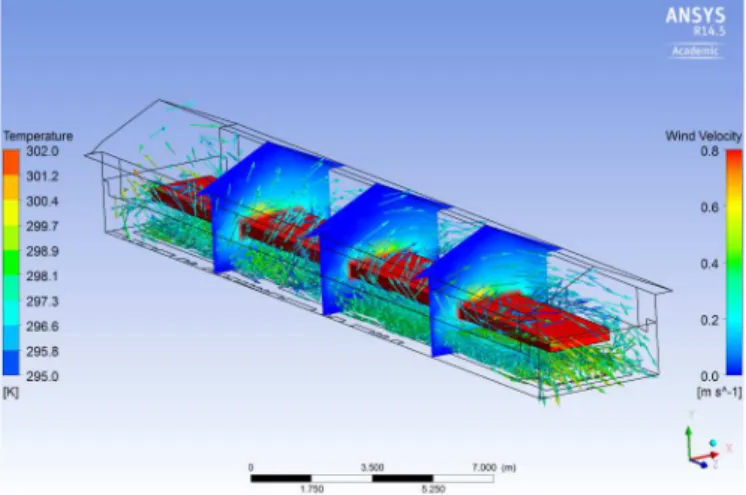
Scenario II. Simulated wind direction normal to the inlet vents
Under the scenario II (Figure 3), the outside wind direction strongly affected the ventilation rate compared to scenario I. In this case, the ventilation rate was 0.052 m3 m-2 s-1, a significantly greater rate than the one produced under scenario I (Figure 2). However, such conditions left the area underneath the rabbit cages with a limited air renovation rate. Air velocity vectors of a greater size on the upper levels compared to the size of vectors underneath the cages can be observed in Figure 3. The air above the rabbit cages presented well-mixed conditions while the air underneath the cages was practically stagnant. Pockets of air poorly mixed are critical to avoid because they may produce an accumulation of toxic components, such as ammonia. This may negatively influence production if these components reach the rabbits when they rise as a result of buoyancy effects.
Outside wind direction parallel to the barn with a magnitude of 4 m s-1
Figure 2. Air velocity vectors (A) and air temperature at three cross sections of the barn (B). Temperature within the rabbit cages is also shown (B)
A. B.
Simulated outside wind direction assumed to be normal to the barn with a magnitude of 4 m s-1
Figure 3. Air temperature within the rabbit cages, vertical
profiles of air temperature at three sections of the barn,
Results from scenarios I & II suggest the ventilation system of the barn may need improvements in order to be able to enhance ventilation within the rabbit barn.
Ventilation system design modification
One limitation of the current ventilation system design studied is the limited air circulation observed underneath the cages. Thus, having both vent openings at an elevated position from the ground level may not be effective to promote enough ventilation rates and lower the ammonia concentrations sufficiently, especially beneath the rabbit cages. Lowering the height of the vents in the rabbit barn could alleviate that. Therefore, a modification on the vents position was analysed.
The modification on the ventilation system of the rabbit barn consisted of having the vent inlet and the vent outlet at different heights. The vent inlet was at 0.2 m above the ground level and ran continuously 22 m along the barn. The position of the vent outlet remained as in the original design, at a height of 1.2 m from the ground level.
To simultaneously compare the conditions produced by the current and the new designs, air temperature andammonia mass of fraction on the vertical profile at the centre of the barn
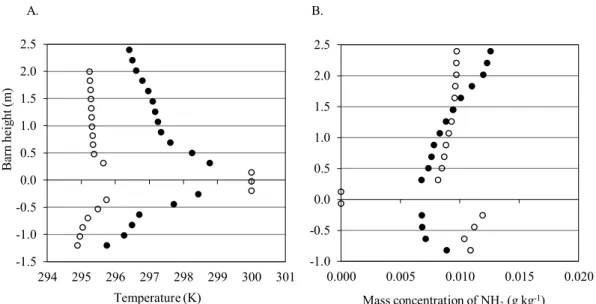
are shown in Figures 4 and 5. Figure 4 shows the case when the wind is perpendicular, and Figure 5 when the wind is parallel, to the barn. For presentation purposes, the height of the barn is shown in the Y-axis (dependent variable). For the new vent configuration, smaller temperature gradients resulted under both scenarios, when the wind direction was perpendicular (Figure 4) and when the wind was parallel to the barn (Figure 5). Regarding ammonia concentrations, while the normal wind direction produced low concentrations underneath the cages, this gas became concentrated when the wind direction was parallel. Lowering the vent inlet clearly improved conditions when the wind is perpendicular to the barn.
With the modification implemented, and simulating a wind direction perpendicular to the vents, air exchange rate did not experience great changes compared to the original vent configuration, resulting in 0.045 m3 m-2 s-1, compared to 0.052 m3 m-2 s-1 for the original design. However, this modification produced a substantial reduction of the air temperature gradients, with lower values underneath the rabbit cages. Probably, a higher air circulation was produced within that area due to a proximity to the air entrance. Furthermore, results show an improvement in the vertical distribution of
(•) Both vents at 1.2 m of height. (ο) Vent inlet at 0.2 m and vent outlet at 1.2 m of height. Outside wind direction simulated as parallel to the barn with a magnitude of 4 m s-1
Figure 5. Air temperature (A) and ammonia (B) at different heights of the barn
-1.5 -1.0 -0.5 0.0 0.5 1.0 1.5 2.0 2.5
294 295 296 297 298 299 300 301
Ba
rn
hei
gh
t(
m)
Temperature (K)
-1.0 -0.5 0.0 0.5 1.0 1.5 2.0 2.5
0.000 0.005 0.010 0.015 0.020
Mass concentration of NH3(g kg-1)
A. B.
(•) Both vents at 1.2 m of height. (ο) Vent inlet at 0.2 m and vent outlet at 1.2 m of height. Outside wind direction simulated as perpendicular to the barn with a magnitude of 4 m s-1
Figure 4. Air temperature (A) and ammonia (kg kg-1) (B) at different heights of the barn
-1.2 -0.7 -0.2 0.3 0.8 1.3 1.8 2.3
294 296 298 300 302
Ba
rn
hei
gh
t(
m)
Temperature (K)
-1.0 -0.5 0.0 0.5 1.0 1.5 2.0 2.5
0.000 0.005 0.010 0.015 0.020 Mass concentration of NH3(g kg-1)
air temperature and the ammonia mass fraction with the inlet vent located at 0.2 m of height (Figure 4). Air circulation was particularly improved in the area underneath the rabbit cages, resulting in a reductionin the ammonia concentration (Figure 4B). When the inlet vent is located at a lower height, renovation rates remain almost the same. In numeric terms, this variable stays constant (continuity equation). However, air enters at the lower part, mixes with the impurities produced in the interior and then leaves the barn while being replaced by a cleaner air. This phenomenon is advantageous and contributes to improving conditions for the rabbits in the barn.
Ammonia is produced from the faeces and urine of the rabbits. Such production is a biological process and is intensified under high temperatures. Ventilation removes ammonia and is fundamental to avoiding harmful accumulations of this gas. Therefore, having an effective ventilation system design is of vital importance. This study shows how a simple modification on the ventilation system can improve conditions inside the barn.
There may be other alternatives of ventilation system designs for this type of barn; however, the cost of implementing them will be a factor to consider. If modifications are simple and cheap to implement, the chance for the breeders adapting them increases.
In this study, a constant source of ammonia was simulated underneath the cages. Consequently, a change in the ventilation rate did not affect the ammonia production rate in the simulations. Ammonia production depends on more than just one single variable (i.e. air temperature and ventilation rate), as pointed out in related studies (Rong et al., 2009; Saha et al., 2010).
One limitation of the ventilation system design originally analysed and still present in the proposed modification is that ammonia has to go through the rabbit cages in order to leave the barn. That means rabbits have to inhale some of it. However, the modification studied under a perpendicular wind direction produced lower concentrations around the rabbit cages, improving conditions substantially.
Probably, the best configuration would be the one where ammonia never passes through the rabbit cages. However, that would be possible only under mechanical ventilation conditions. Most rabbit breeders in Mexico may not be able to afford such investment.
Conclusions
1. The air dynamics inside a rabbit barn were evaluated by computational fluid dynamics (CFD). With the current natural ventilation (NV) system design and with the wind direction parallel to the vents, ventilation rates were close to zero.
2. Vent rates increased significantly when the wind direction was normal to the vents; however, air removal underneath the cages was limited. Therefore, a greater ventilation rate does not necessarily guarantee a higher homogeneity in the barn.
3. A vent inlet located at a lower height did not notably affect air ventilation rate but clearly improved conditions by lowering the concentration gradients of temperature and ammonia.
4. These results are only due to the environmental parameters and two design factors (i.e. barn direction and vent configuration).
Literature Cited
Anderson, J. D. Computational fluid dynamics. 1.ed. New York: McGraw-Hill, 1995. 574p.
Ansys-Fluent. Fluent 6.1 User’s guide. 1.ed. Lebanon: Fluent Inc., 2003. 1864p.
Bailey, B. J. Screens stop insects but slow airflow. Fruit & Vegetable Technology, v.3, p.6-8, 2003.
Bjerg, B.; Cascone, G.; Lee, I. B.; Bartzanas, T.; Norton, T.; Hong, S. W.; Seo, I. H.; Banhazi, T.; Liberati, P.; Marucci, A.; Zhang, G. Modelling of ammonia emissions from naturally ventilated livestock buildings. Part 3: CFD modelling. Biosystems Engineering, v.116, p.259-275, 2013. https://doi.org/10.1016/j. biosystemseng.2013.06.012
Boulard, T.; Meneses, J. F.; Mermier, M.; Papadakis, G. The mechanism involved in the natural ventilation of greenhouses. Agricultural and Forest Meteorology, v.79, p.61-77, 1996. https://doi. org/10.1016/0168-1923(95)02266-X
Ferziger, J. H.; Peric, M. Computational methods for fluid dynamics. 3.ed. New York: Springer-Verlag, 2002. 423p. https://doi. org/10.1007/978-3-642-56026-2
Flores-Velázquez, J.; Montero, J. I. Computational fluid dynamics CFD study of large scale screenhouse. Acta Horticulturae, v.797, p.117-122, 2008. https://doi.org/10.17660/ActaHortic.2008.797.14 García, E. Modificaciones al sistema de clasificación climática de
Köppen, adaptado para las condiciones de la República Mexicana. 3.ed. Mexico: Lario Ed. S. A. 1981. 246p.
Makarenko, O. N.; Skorik, L. V.; Mel’nichuk. D. A. The characteristics of nitrogen metabolism in the tissues of rabbits with ammonium toxicosis. Ukrainian Biochemical Journal, v.64, p.105-9, 1992. Mistriotis, A.; Bot, G. P. A.; Picuno, P.; Scarascia-Mugnozza, G. Analysis
of the efficiency of greenhouse ventilation using computational fluid dynamics. Agricultural and Forest Meteorology,v.85 p.217-228, 1997. https://doi.org/10.1016/S0168-1923(96)02400-8 NIOSH – National Institute of Occupational Safety and Health. 2011.
<http://www.cdc.gov/niosh/pel88/7664-41.html>. 24 Sep. 2016. Norton, T.; Grant, J.; Fallon, R.; Sun, D. W. Assessing the ventilation
effectiveness of naturally ventilated livestock buildings under wind dominant conditions using computational fluid dynamics. Biosystems Engineering, v.103, p.78-99, 2009. https://doi. org/10.1016/j.biosystemseng.2009.02.007
Norton, T.; Sun, D.; Grant, J.; Fallon, R.; Dodd, V. Application of computational fluid dynamics (CFD) in the modeling and design of ventilation systems in the agricultural industry: A review. Bioresource Technology, v.98, p.2386-2414, 2007. https://doi. org/10.1016/j.biortech.2006.11.025
Perkins, S.; Lipman, N. S. Characterization and quantification of microenvironmental contaminants in isolator cages with a variety of contact beddings. Contemporary Topics Laboratory Animal Science v.173, p.96-113, 1995.
Praag, E. van; Maurer, A.; Saarony, T. Skin diseases of rabbits. 1.ed. MediRabbit, 2010. 408p.
Rong, L.; Nielsen, P. V.; Zhang, G. Effects of airflow and liquid temperature on ammonia mass transfer above an emission surface: Experimental study on emission rate. Bioresource Technology, v.100, p.4654-4661, 2009. https://doi.org/10.1016/j. biortech.2009.05.003
Saha, C. H.; Zhang, G.; Ni, J. Q. Airflow and concentration characterization and ammonia mass transfer modelling in wind tunnel studies. Biosystems Engineering v.107, p.328-340, 2010. https://doi.org/10.1016/j.biosystemseng.2010.09.007
Smith, E.; Stockwell, J. D.; Schweitzer, I.; Langley, S. H.; Smith, A. L. Evaluation of cage microenvironment of mice housed on various types of bedding materials. Contemporary Topics Laboratory of Animal Science, v.43, p.12-17, 2004.
Sven, R.; Davies, T. W. Using CFD to model the internal climate of greenhouses: Past, present and future. Agronomie, v.22, p.3-19, 2002. https://doi.org/10.1051/agro:2001006