Food Science and Technology ISSN 0101-2061
DI:
D http://dx.doi.org/10.1590/1678-457X.10516
1 Introduction
Dsmotic dehydration is a water removal process with little changes in the structure, texture and sensory properties of foods (Lemus-Mondaca et al., 2009; Tortoe, 2010); therefore the applicability of this technology to preserve fish products is an interesting alternative. Dsmotic dehydration has been used in seafood such as sardines and anchovies (Corzo & Bracho, 2007, Czerner & Yeannes, 2010), mackerel (Sanchez Pascua et al., 1994), squid (Uribe et al., 2011), catfish (Dladele & Ddedeji, 2008). In the osmotic dehydration of fish different agents such as salt, sugars, glycerol, and sorbitol have been used (Sanchez Pascua et al., 1994, 2001; Casales & Yeannes, 2006; Musjaffar & Sankat, 2006; Corzo & Bracho, 2007; Dladele & Ddedeji, 2008; Larrazabal-Fuentes et al., 2009; Czerner & Yeannes, 2010; Uribe et al., 2011). Color is among the most important quality characteristics for determining the shelf life of a product and is one of the sensory characteristics most appreciated by consumers (Birkeland & Bjerkeng, 2005; Sohn et al., 2005; Corzo et al., 2008; García et al., 2012). This attribute can be determined by sensory and instrumental methods.
The color of any product can be represented in terms of tristimulus L *, a *, b *, or by a combination of them, depending on the nature of the pigment present in the foodstuff (Cortés & Chiralt, 2008; Corzo et al., 2006, 2008).There are many research studies in the application of kinetic to the changes in the quality of foods during processing and storage. Major results of these
studies indicate that color changes during processing and storage follow a first order kinetics (Corzo et al., 2006, 2008). In the literature there is little information available about color changes of fish. Information available about color change kinetics of fish during osmotic dehydration and during storage of osmotically dehydrated fish is very scarce (Corzo et al., 2006, 2008).
In this work chub mackerel (Scomber japonicus) was used to obtain intermediate moisture loins (skinless filets without red muscle). Mackerel is a pelagic species, considered fat by lipid content (Casales et al., 1991; Huss, 1999). Fish lipids are rich in polyunsaturated n-3 fatty acids (PUFA), such as eicosapentaenoic acid (EPA) and docosahexaenoic acid (DHA) (Huss, 1999; Sohn et al., 2005; Massa et al., 2007). Highly unsaturated fatty acids from fish muscle easily form secondary oxidation products such as aldehydes, ketones, alcohols, etc. (Sohn et al., 2005). Mackerel, like most pelagic species, presents clear and red muscle. Myoglobin is the predominant pigment in most fish muscles, being its content higher in dark muscle than in clear one (Sohn et al., 2005; Chaijan & Panpipat, 2009). Dark muscle is distributed along the backbone and has a dark burgundy color in raw mackerel changing to dark brown after cooking. The light muscle after cooking has “tea with milk” color and presents clear and brownish grey areas. Myoglobin exists in three main forms which differ in their sensitivity to heat producing a distinctive color in each of them. The desoximyoglobin is the least sensible
Kinetics of color change of osmotically dehydrated chub mackerel (
Scomber japonicus
)
during storage at different temperatures
Gerardo CHECMAREV1*, María Rosa CASALES1, María Isabel YEANNES1
Received 14 Apr., 2016 Accepted 03 July, 2016
1Grupo de Investigación en Preservación y Calidad de Alimentos – GIPCAL, Consejo Nacional de Investigaciones Científicas y Técnicas – CONICET, Facultad de Ingeniería, Universidad Nacional de Mar del Plata – UNMdP, Mar del Plata, Buenos Aires, Argentina
*Corresponding author: [email protected], [email protected]
Abstract
The aim of this study was to determine the effect of storage temperature on the kinetics of color change of chub mackerel dehydrated in a ternary solution (water, glycerol and salt) and vacuum packaged in films. The color of processed fish can change because of lipids and protein oxidation during storage. Samples were stored at 7, 25 and 35 °C for seven months and kinetic models of 0, 1 and 2 order were applied to describe the color changes. It was observed that an increase in the storage temperature improved the changes in the CIE color values (L*, a* and b*). First-order reaction had the best statistical parameters for a* at the three temperatures tested. The temperature dependence of parameter a* indicated an Arrhenius relationship and the activation energy (Ea) was 44.33 kJ/mol. The parameter b* fitted to the proposed models only in samples stored at 35 °C. The L* value decreased during storage at 25 and 35 °C (pale to dark). Storage at refrigeration temperature (7 °C) minimized the color changes.
Keywords: color; chub mackerel; osmotic dehydration; storage.
to heat denaturation followed by the oxymyoglobin and the metamyoglobin. The 3 forms of myoglobin differ when myoglobin is denatured, the metamyoglobin forms the brown globin hemichromogen, also known as ferrihemochrome. The other myoglobins are denatured to the red globin hemochromogen, also known as ferrohemochrome (King & Whyte, 2006).
The color of processed fish can change because of lipids and protein oxidation, non-enzymatic browning and enzymatic activity (Ceballos, 2012). Considering the complexity of working with a species such as mackerel, the aim of this study was to analyze the effect of storage temperature on the kinetic of color change of osmotically dehydrated chub mackerel (Scomber japonicus) loins.
2 Materials and methods
2.1 Raw materials
The experiments were performed with chub mackerel (Scomber japonicus) caught in November, frozen and stored at –18 °C until use.
2.2 Process
The elaboration process of chub mackerel (Scomber japonicus) loins of low aw consists on the following stages: head, gut and tail cutting, steaming (20 min), cooled to 7 ± 1 °C, obtainment of clear muscle (loin), immersion of loin in water-salt-glycerol solution (40% glycerol, 55% water and 5% sodium chloride) at 7 °C, drained off at 7 ± 1 °C, vacuum packaging in flexible pouches and pasteurization (60 ± 1 °C). Samples were subsequently stored at 7, 25 and 35 °C for 7 months.
2.3 Color measurement
The mackerel loins were ground and homogenized in a household processing. The homogenized mackerel was spread on a glass petri dish until a thickness of 8 mm, and its color was measured on a colorimeter (Model SP60, Lovibond, UK) calibrated with standard black and white. The color coordinates were determined by CIELab scale: L* luminosity (0 black to 100 white); a*, green / red (–60 to +60) and b* blue / yellow (–60 to +60). The values were the resulting average of 5 measurements. Total color difference was calculated according to Equation 1:
2 2 2
* * *
E L a b
∆ = ∆ +∆ +∆ (1)
2.4 Models
Kinetic models of 0, 1 and 2 orders were applied to describe color changes during storage.
Equations 2-4 were used:
Zero order kinetics Ct=C0−kt (2)
First order kinetics
0 lnCt
kt
C = − (3)
Second order kinetics
0 1 1
t
kt
C =C − (4)
where C0 is the initial color value (L *, a *, b *) at time 0, Ct is the color value (L *, a *, b *) at time t, and k is the rate constant (months–1).
Graphing Ct, 0 lnCt
C or 1
t
C vs t gives the rate constant for 0, 1 and 2 reaction order respectively.
The dependence of the rate constant with temperature was determined by the Arrhenius equation (Equation 5).
0 lnk lnk Ea
RT
= − (5)
where k0 is the frequency factor (months –1), E
a the activation
energy in kJ/mol, R the universal gas constant (8.314 kJ / mol K) and T the absolute temperature (K).
2.5 Statistical analysis
To determine if the effect of temperature and time of storage was significant for the color parameters studied, the results were analyzed using analysis of variance (ANDVA) of two factors (temperature and time) (p < 0.05). Further analyses were done comparing means using the Tukey test (p < 0.05). Statistical analysis was performed with the program InfoStat, 2011 (Group InfoStat, FCA, National University of Cordoba, Argentina).
The fitting of the models with the experimental data was performed by linear regression using DriginPro 8 software (DriginLab, Northampton, MA). To evaluate the goodness of fit of the experimental data to the models, the R2
adj and root
mean square error (RMSE) were used according to Equation 6.
(
)
2 11 n
i pi
i
RMSE x x
n =
=
∑
− (6)where xi is the experimental value, xpi is the predicted value and
n is the number of data pairs.
3 Results and discussion
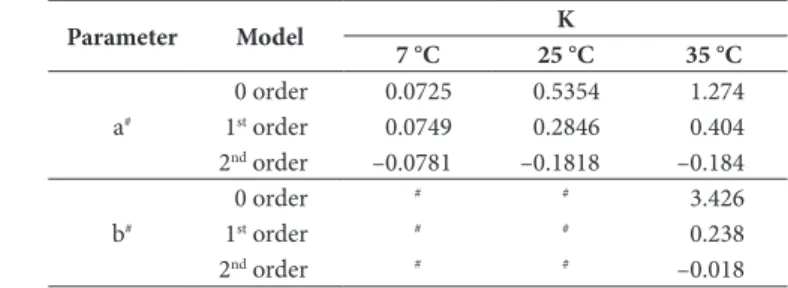
Tables 1 and 2 show the results of the application of kinetic models of 0, 1 and 2 order to describe color changes during storage.
Table 1. Kinetic of color changes of osmotically dehydrated mackerel loins.
Parameter Model K
7 °C 25 °C 35 °C
a#
0 order 0.0725 0.5354 1.274
1st order 0.0749 0.2846 0.404
2nd order –0.0781 –0.1818 –0.184
b#
0 order # # 3.426
1st order # # 0.238
2nd order # # –0.018
3.1 Kinetics of color change on a*
Figure 1 shows the behavior of parameter a*, which had a significant increase (p < 0.05) during the 7 months of storage at the three temperatures tested. There was a slight increase in a* in samples stored at 7 °C while the increase was greater with higher storage temperature (25 and 35 °C). Storage temperature had a significant effect (p < 0.05) on a* value throughout the storage, showing higher values with increasing temperature.
Kinetic models of 0, 1 and 2 order were applied to describe the changes in a* values during 5 months storage at the three temperatures tested (Table 1). The 1st order model presented the best statistical parameters (0.904 < R2
adj < 0.921; 0.199 < RMSE
< 1.127) at the three temperatures tested.
Temperature dependence of the rate constant for the parameter a* could be explained by the Arrhenius equation, yielding an R2
of 0.981. Ea value was 44.33 kJ/mol. This result is in the range of the obtained by Corzo et al. (2006) for osmotically dehydrated anchovy sheets in salt solutions of different concentration (15 to 27 g NaCl/100 g), being the Ea values between 25.49 and 22.42 kJ/mol.
3.2 Changes on b*
Figure 2 shows a significant increase (p < 0.05) in the value of b* in the samples stored at 35 °C during the entire period. This behavior was observed in the samples stored at 7 °C and 25 °C only from the fourth month. With respect to the effect of storage temperature on the value of b *, there was a significant increase (p < 0.05) by the fourth month at 35 °C compared to the other temperatures tested. Due to the high intrinsic variability of the samples, b* only adjusted to the kinetics models for 35 °C during 5 month storage, obtaining the best fit for kinetic of 1st order (R2
adj = 0.892; RMSE = 0.751), with a k value of
0.238 months–1 (Table 1).
3.3 Changes on L*
The brightness (L*) decreased (p < 0.05) during storage in the samples stored at 25 and 35 °C while remained unchanged (p > 0.05) in the samples stored at 7 °C (Figure 3). From the fourth month, L* was significantly lower in the samples at 25 and 35 °C compared with those stored at 7 °C. Due to the intrinsic variability of the sample, L* did not adjust to the proposed models.
Table 2. Statistical parameters.
Parameter Model RMSE R
2 adj
7 °C 25 °C 35 °C 7 °C 25 °C 35 °C
a#
0 order 0.201 2.989 3.783 0.914 0.714 0.903
1st order 0.199 0.839 1.127 0.921 0.904 0.914
2nd order 0.212 0.424 1.205 0.918 0.938 0.637
b#
0 order # # 10.465 # # 0.898
1st order # # 0.751 # # 0.892
2nd order # # 0.754 # # 0.819
#The fit with this model was not good.
Figure 1. Behavior of a* during storage.
Figure 2. Behavior of b* during storage.
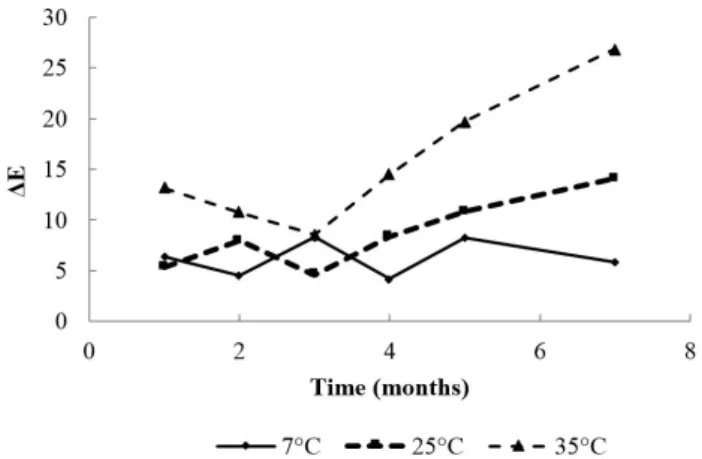
3.4 Changes on total color difference (ΔE)
The total color difference can be expressed by ΔE, indicating that the higher the value the greater the difference in color between two samples. At 35 °C took place the greatest changes in that parameter. Figure 4 shows the variation of the total color difference during storage at the three temperatures tested. As in the case of L*, ΔE did not adjust to the proposed models.
Sohn et al. (2005) reported that the oxidation of lipids in the fish muscle is promoted by auto-oxidation of myoglobin, with the oxidation of myoglobin as the main cause in the development of undesirable color and unpleasant odor during storage of fish on ice. According to the results obtained by Thanonkaew et al. (2006) on squid and Thanonkaew et al. (2007) in cuttlefish, the occurrence of yellow pigmentation is due to the interaction between aldehyde groups produced during the oxidation of lipids with free amino groups from phospholipids and proteins that form Schiff bases. Color changes in mackerel loins stored at different temperatures could be explained by these reactions. The b* values increase towards the yellow and L* values decrease indicating a loin darkening. All these changes are more pronounced with increasing storage temperature.
4 Conclusions
It was found that at 25 and 35 °C occur the higher color changes, with a decrease in L* (light to dark) and an increase in a* and b* (red and yellow respectively). Also, the rate of change of a* followed a first order kinetics and the rate constant (k) increased with temperature. The temperature dependence was given by the Arrhenius equation with an Ea of 44.33 kJ/mol. The b* parameter only adjusted to 35 °C following a first order kinetics, which may be explained considering the inherent variability of the samples. Although L* value decreased during storage at 25 and 35 °C (pale to dark), it did not fit to the models studied. The total color difference (ΔE) increased during storage at 25 and 35 °C, being higher at 35 °C. Storage at refrigeration temperature (7 °C) minimized the color changes.
Therefore, the values of L*, a* and b* are physical properties that were applied satisfactorily to determine the kinetics of the color change during storage of osmotically dehydrated mackerel loins.
Acknowledgements
This work was funded by Universidad Nacional de Mar del Plata, Project ING330/11 and CDNICET, PIP 0403. The authors are grateful to these institutions.
References
Birkeland, S., & Bjerkeng, B. (2005). The quality of cold-smoked Atlantic salmon (Salmo salar) as affected by salting method, time and temperature. International Journal of Food Science & Technology, 40(9), 963-976. http://dx.doi.org/10.1111/j.1365-2621.2005.01030.x. Casales, M. R., & Yeannes, M. I. (2006). Análisis de difusión múltiple
y de equilibrio en el proceso de marinación de anchoita (Engraulis anchoita). In Anales del X Congreso CYTAL. Primer Simposio Internacional de Nuevas Tecnologías (Vol. 4, pp. 1217-1224). Mar del Plata. Argentina.
Casales, M.R.; Yeannes, M.I. & Zugarramurdi, A. (1991). Conservas de caballa: composición química proximal y evaluación sensorial.
Alimentaria, Revista de Tecnología e Higiene de los Alimentos, 219, 93-97.
Ceballos, M. J. (2012). Effect of protein and lipid oxidation in the changes of colour in salted and dried herring and klippfish (Master’s thesis). Norwegian: Institutt for Bioteknologi.
Chaijan, M., & Panpipat, W. (2009). Post harvest discolouration of dark-fleshed fish muscle: a review. Walailak Journal of Science and Technology, 6(2), 149-166.
Cortés, M. R., & Chiralt, A. B. (2008). Kinetic of colour change of air dried fortified apples with vitamin E. Vitae - Revista de la Facultad de Química Farmacéutica, 15(1), 8-16.
Corzo, D., & Bracho, N. (2007). Water effective diffusion coefficient of sardine sheets during osmotic dehydration at different brine concentrations and temperatures. Journal of Food Engineering, 80(2), 497-502. http://dx.doi.org/10.1016/j.jfoodeng.2006.06.008. Corzo, D., Bracho, N., & Marjal, J. (2006). Colour change kinetics of
sardine sheets during vacuum pulse osmotic dehydration. Journal of Food Engineering, 75(1), 226. http://dx.doi.org/10.1016/j. jfoodeng.2005.03.046.
Corzo, D., Bracho, N., & Millán, R. (2008). Cambios de color en las láminas de sardina durante la deshidratación osmótica. Revista Científica, 18(4), 424-430.
Czerner, M., & Yeannes, M. I. (2010). Brining kinetics of different cuts of anchovy (Engraulis anchoita).International Journal of Food Science & Technology, 45(10), 2001-2007. http://dx.doi.org/10.1111/j.1365-2621.2010.02361.x.
García, F. E.V, Cortés Rodríguez, M., & Román Morales, M. D. (2012). Cinética del color durante el almacenamiento de caramelos blandos de uchuva adicionados de calcio y sin sacarosa. Revista Lasallista de Investigación, 9(2), 11-25.
Huss, H.H. (1999). El pescado fresco: su calidad y cambios de su calidad
(FAO Documento Técnico de Pesca, 348). Dinamarca: Laboratorio
Tecnológico Ministerio de Pesca.
King, N., & Whyte, R. (2006). Does it look cooked? A review of factors that influence cooked meat colour. Journal of Food Science, 71(4), 31-40. http://dx.doi.org/10.1111/j.1750-3841.2006.00029.x. Larrazabal-Fuentes, M. J., Escriche-Roberto, I., & Camacho-Vidal, M.
M. (2009). Use of immersion and vacuum impregnation in marinated salmon (Salmo salar) production. Journal of Food Processing and Preservation, 33(5), 635-650. http://dx.doi.org/10.1111/j.1745-4549.2008.00278.x.
Journal of Aquatic Food Product Technology, 10(1), 89-100. http:// dx.doi.org/10.1300/J030v10n01_08.
Sohn, J. H., Taki, Y., Ushio, H., Kohata, T., Shioya, I., & Dhshima, T. (2005). Lipid oxidations in ordinary and dark Muscles of fish: Influences on rancid off-odour development and colour darkening of yellowtail flesh during ice storage. Journal of Food Science, 70(7), 490-496. http://dx.doi.org/10.1111/j.1365-2621.2005.tb11497.x. Thanonkaew, A., Benjakul, S., Visessanguan, W., & Decker, E. A. (2006).
Development of yellow pigmentation in squid (Loligo peali) as a result of lipid oxidation. Journal of Agricultural and Food Chemistry, 54(3), 956-962. http://dx.doi.org/10.1021/jf052107h. PMid:16448208. Thanonkaew, A., Benjakul, S., Visessanguan, W., & Decker, E. A.
(2007). Yellow discolouration of the liposome system of cuttlefish (Sepia pharaonis) as influenced by lipid oxidation. Food Chemistry, 102(1), 219-224. http://dx.doi.org/10.1016/j.foodchem.2006.05.008. Tortoe, C. (2010). A review of osmodehydration for food industry.
African Journal of Food Science, 4, 303-324.
Uribe, E., Miranda, M., Vega-Galvez, A., Quispe, I., Claveria, R., & Di Scala, K. (2011). Mass transfer modelling during osmotic dehydration of jumbo squid (Dosidicus jigas): influence of temperature on diffusion coefficients and kinetic parameters. Food Bioprocess Technology, 4(2), 320-326. http://dx.doi.org/10.1007/s11947-010-0336-2.
Lemus-Mondaca, R., Miranda, M., Andres, A., Briones, V., Villalobos, R., & Vega-Galvez, A. (2009). Effect of osmotic pre-treatment on hot-air drying kinetics and quality of Chilean papaya (Carica pubescens). Drying Technology, 27(10), 1105-1115. http://dx.doi. org/10.1080/07373930903221291.
Massa, A., Yeannes, M. I., & Manca, E. A. (2007). Acidos grasos poliinsaturados de la serie Dmega-3 en ejemplares bonaerenses y patagónicos de anchoita argentina. Revista Aceites y Grasas, 16(1), 568-572.
Musjaffar, S., & Sankat, C. K. (2006). The mathematical modelling of the osmotic dehydration of shark fillets at different brine temperatures.
International Journal of Food Science & Technology, 41(4), 405-416. http://dx.doi.org/10.1111/j.1365-2621.2005.01086.x.
Dladele, A. K., & Ddedeji, J. D. (2008). Dsmotic dehydration of catfish (Hemisynodontis membranaceus): effect of temperature and time.
Pakistan Journal of Nutrition, 7(1), 57-61. http://dx.doi.org/10.3923/ pjn.2008.57.61.
Sanchez Pascua, G. L., Casales, M. R., & Yeannes, M. I. (1994). Preliminary development of intermediate moisture, pasteurized chub mackerel (Scomber japonicus marplatensis) chunks. Journal of the Science of Food and Agriculture, 64(2), 199-204. http://dx.doi.org/10.1002/ jsfa.2740640208.