Original article
RBAFSSOCIEDADE BRASILEIRA DE ATIVIDADE FÍSICA E SAÚDE
Brazilian Journal of Physical Activity and Health
RBAFS
Revista Brasileira de Atividade Física & Saúde
SOCIEDADE BRASILEIRA DE ATIVIDADE FÍSICA E SAÚDE
Brazilian Journal of Physical Activity and Health
Rev Bras Ativ Fis Saúde p. 63-74 DOI: http://dx.doi.org/10.12820/2317-1634.2013v18n1p63
1 Programa de Pós-graduação em Epidemiologia, Universidade Federal de Pelotas
2 Diretoria de Doenças e Agravos Não-Transmissíveis e Promoção da Saúde, Secretaria de Vigilância em Saúde, Ministério da Saúde
3 Programa de Pós-graduação em Educação Física, Universidade Federal do Paraná 4 Pontifícia Universidade Católica do Paraná 5 Universidade Federal do Rio Grande 6 Instituto Federal de Educação, Ciência e Tecnologia Sul-rio-grandense, Campus Camaquã
Description of the physical activity
promotion programs funded by the
Brazilian Ministry of Health
Descrição dos programas municipais de
promoção da atividade física financiados
pelo Ministério da Saúde
Tales C Amorim1,6 Alan G Knuth5 Danielle K A Cruz2 Deborah C Malta2 Rodrigo S Reis3,4 Pedro C Hallal1 Abstract
As a means to operationalize the National Health Promotion Policy, the Brazilian Ministry of Health funded cities for the development of local health promotion interventions from 2005 to 2009. Out of 1,374 interventions funded in this period, approximately 3/4 developed physical activity promotion strategies. The aim of this article is to describe these interventions. We in-terviewed those who are responsible for these interventions in 748 cities in Brazil. The Midwest region was the one with the highest proportion of cities being funded (17.8%); 72.3% of the interventions take place in small cities, i.e. those with fewer than 30,000 inhabitants. Commu-nication, education and information strategies were the mostly frequently reported, followed by behavioral and social strategies. Only 8.2% of the interventions achieve more than 500 people. Most interventions (76.9%) focused on older adults, and 59.2% of them were designed for hypertensive and diabetic patients. Oriented walking was the most prevalent offered activity (80.6%), followed by gym classes (78.5%). Most interventions used parks or squares (55.6%) or sports courts (52%). Radio was the most frequent media strategy used (59.8%) to divulgate the interventions. Lack of adequate physical structure and personnel were the main barriers faced by the interventions (30.3%), followed by bureaucracy at obtaining and using the funding (25.1%). Physical education teachers were present in 72.3% of the interventions. The low proportion of funded cities in the North region, the lack of interventions using environmental and policy strategies, inadequate infrastructure and insufficient personnel are key areas in which interven-tions can improve in order to be more successful.
Keywords
Government Financing; Health Promotion; Physical Activity.
Resumo
Como parte da operacionalização da Política Nacional de Promoção da Saúde, o Ministério da Saúde financiou entre 2005 e 2009, 1.374 entes federados para o desenvolvimento de ações de promoção da saúde, sendo que aproximadamente 3/4 desses realizaram ações de promoção de atividade física. O objetivo deste estudo foi descrever os programas que compõem essa Rede Nacional de Atividade Física. Foram entrevistados 748 coordenadores/responsáveis por programas. A região com maior proporção de cidades financiadas foi a Centro-Oeste (17,8%). A maior parte dos programas (72,3%) foi desenvolvi-da em cidesenvolvi-dades com menos de 30.000 habitantes. Apenas 8,2% dos programas atingiam 500 pessoas ou mais. As ações de comunicação, educação e informação foram as mais frequentemente reportadas, seguidas pelas ações comportamentais e sociais. Os idosos receberam maior atenção das intervenções (76,9%). Em se tratando de grupos especiais, hipertensos e diabéticos foram os mais contemplados (59,2%). A caminhada orientada foi a atividade oferecida com maior frequência (80,6%), seguida por aulas de ginástica (78,5%). Parques/Praças (55,6%) e Ginásios/Quadras (52%) foram as estruturas físicas mais utilizadas. A rádio/rádio comunitária foi o veículo de divulgação mais relatado (59,8%). A falta de estrutura física e de pessoal (30,3%), seguida da burocracia (25,1%), foram as dificuldades mais citadas para funcionamento dos programas. Professores de educação física foram os profissionais mais presentes (72,3%). A baixa proporção de financiamentos na região norte, poucas ações de caráter ambiental e político e dificuldades de estrutura física e qualificação profissional, constituem-se pontos importantes de reflexão para que se potencialize a efetividade dos programas.
Palavras-chave
INTRODUCTION
The prevalence of physical inactivity is high in Brazil and worldwide1. This be-havior is associated with the increased risk of developing several non-commu-nicable diseases2. Such combination of factors has caused the theme of physical activity (PA) to gain increasing attention of the media, enabling greater access to information about the health benefits of regular physical activity3. Although this information has been in the scientific literature for years, population-based PA promotion remains a challenge.
Despite international efforts to include this theme in the agenda of health actions4-5, there is scarce evidence that such initiatives have been successful on the population level. Several obstacles could be pointed out, although a possi-ble explanation would be the limited alignment of interests and actions between professionals and researchers of this area6. Since 2005, the Brazilian Ministry of Health has funded the development of health promotion strategies in different cities, with an emphasis on projects that promote physical activity7-8. Until 2010, approximately R$ 171 million had been invested in these interventions, which came to be collectively known as “Rede Nacional de Atividade Física” (RNAF – National Physical Activity Network).
In addition to this federal government initiative, several interventions in the area of physical activity have been implemented in Brazilian cities, such as the Academia da Cidade Program (ACP), Agita São Paulo Program, CuritibAti-va Program, Serviço de Orientação ao Exercício (Exercise Orientation Service) and Saúde Ativa Program. In April 2011, the Academia da Saúde Program was launched, aiming to expand the promotion of physical activity, leisure and healthy lifestyles to all Brazilian cities14.
Governmental actions of such magnitude, aimed at physical activity promo-tion, have been innovative in the international context until now. For this exact reason, it is essential that studies are conducted so as to understand the function-ing of these initiatives, enablfunction-ing ongofunction-ing programs to receive feedback of their actions, which could lead to new directions of strategies for actions and, conse-quently, allow them to become more effective. It is vital to understand how this investment from the Brazilian Ministry of Health has been made functional, what characteristics the programs and actions developed have and what the strategies and priorities of programs are. The present study aimed to describe the National Physical Activity Network funded by the Ministry of Health through public no-tices, between 2005 and 2009.
METHODS
A descriptive study was conducted from two sources: the first one were the records of projects performed by the state or city departments of health and funded by the Ministry of Health; and the second one was a structured telephone interview con-ducted with the managers, coordinators or professionals responsible for the physi-cal activity promotion programs/actions. The target population included 1,374 cit-ies/states included in the public notice issued by the Ministry of Health in 200915, whose registration data had been updated between July and September 2009 by the program managers themselves, as a requirement to be registered and included in this notice. In addition to physical activity projects, this public notice covered
other components of the Política Nacional de Promoção da Saúde (PNPS – National Health Promotion Policy)8, which will be dealt with in subsequent analyses.
The instrument used in the present study was constructed by the joint work of the technical sector of the Coordenação Geral de Vigilância de Doenças e Agravos Não Transmissíveis (CGDANT/MS – Ministry of Health General Coordination of Surveillance of Non-Communicable Diseases and Injuries) and the authors of this study. This instrument was tested to assess clarity and response time and sub-sequently pre-coded. The first section was comprised of general questions about the program, including information about the identification of the project and coordination, interaction within the health sector, sustainability and inter-sectoral partnerships, partnership with the Ministry of Health, and follow-up and assess-ment. After this section, a filter question was asked, directing respondents towards one of the following thematic areas of the PNPS: 1. Healthy eating; 2. Physical activity/body practice; 3. Smoking prevention and control; 4. Alcohol abuse and other drug prevention; 5. Traffic accident prevention; 6. Violence prevention and promotion of a culture of peace; 7. Sustainable development promotion.
In the section aimed at physical activity programs, there were questions about the types of activities offered, number of weekly sessions, duration of each session, period of the day available for activities, geographical distribution in the city, academic quali-fications of professionals and trainees applying the activities, area covered by activities (urban or rural), facilities used and perception of its quality, in addition to aspects that positively or negatively influence the execution of actions. Finally, the final section included general questions about health promotion, the main difficulties encountered thus far and the professional in charge/coordinator’s view of the program perspectives. A company that specializes in the application of telephone interviews16 was responsible for applying this instrument, data codification, quality control and re-cording and filing of interviews. Interviewers were trained by Ministry of Health technicians. Interviews were preceded by an explanatory letter sent to the head of the state department of health, press release on the Ministry of Health website, and email sent to all coordinators of the 1,374 registered projects, describing the research content and importance. Interviewers left MS/CGDANT contact num-bers to officially confirm the research project and answer any existing questions. In the case of refusals, they attempted to set up new calls. Data collection occurred between August and December 2010.
The coordinator/professional in charge of the program answered questions about the types of approach used by the programs towards their target population. Interventions were categorized into the following three groups of actions, accord-ing to the Community Guide for Increasaccord-ing Physical Activity in Communities17: 1) Communication, information and education actions: actions aimed at providing access to knowledge about physical activity and other health habits, whether for the general population or specific groups, such as schools and community centers; 2) Behavioral and social actions: actions with specific social or community groups, such as families, the elderly, women and individuals with certain diseases or risk factors; 3) Environmental and political actions: construction and/or equipping of physical environments suitable for exercising, such as bike paths and squares, in addition to community efforts to include physical activities in the political agenda. Information about the following aspects was collected to describe the Ministry of Health’s National Physical Activity Network and to determine the cities and their population sizes, states and regions:
• Population to which the activities were provided (general population, children, adolescents, adults, the elderly, women, lesbians/gay men/bisexuals/transsexu-als/transvestites);
• High-risk groups included (individuals who were diabetic, hypertensive and obese/overweight, those who had mental disorders and HIV/AIDS, and those who were smokers and drug addicts, among others);
• Type of activity provided (physical evaluation, walking group/guided walks, dancing, exercises on treadmill/stationary bicycle, integrated body practices, stretching/relaxation, popular games, capoeira (a Brazilian martial art that com-bines elements of dance and music and was created by descendants of African slaves) /martial arts, group sports, gym classes, bodybuilding and others); • Frequency of application of activities (1-2 days per week, 3-4 days per week,
and 5 or more days per week);
• Duration of physical activity sessions (less than 30 minutes, between 30 min-utes and one hour, more than one hour);
• Number of locations used for the practice of physical activities (one location, between two and five locations, and more than five locations);
• Facilities used for activities (squares, parks, swimming pools, fitness clubs for the elderly, gyms/sport courts/facilities found in churches, Primary Health Units, bike paths, sidewalks/streets, other sheltered or open locations);
• Perception of the physical quality of facilities (the majority of locations are adequate, some of the locations are adequate, and the majority of locations are inadequate/poor);
• Professional applying the project activities (physical education teacher, physio-therapist, nutritionist, other);
• Types of activities provided (physical evaluation, walking, dancing, integrat-ed body practices, stretching/relaxation, popular games, capoeira/martial arts, group sports, gym classes, bodybuilding, others).
Data were input and analyzed with the EpiData and Stata 10.0 software pro-grams, respectively. Descriptive analysis was used, including the calculation of proportions and their respective 95% confidence intervals. This research project complied with the ethical precepts of Resolution 196/96 and it was assessed and approved by the National Research Ethics Committee.
RESULTS
Of all 1,374 programs/actions funded by the Ministry of Health in 2009, 72.9% (N=1,000) answered the questionnaire. Of these, 748 (74.8%) informed that they had programs/actions related to the “Body practices/Physical activity” theme of the PNPS. Table 1 describes the number of programs in each Brazilian region, including the percentage of cities of each region with funded programs. Whereas nearly 15% of the cities in the Midwestern, Northeastern and Southeastern re-gions had funded interventions, this percentage was lower than 10% in the North-ern and SouthNorth-ern regions of Brazil.
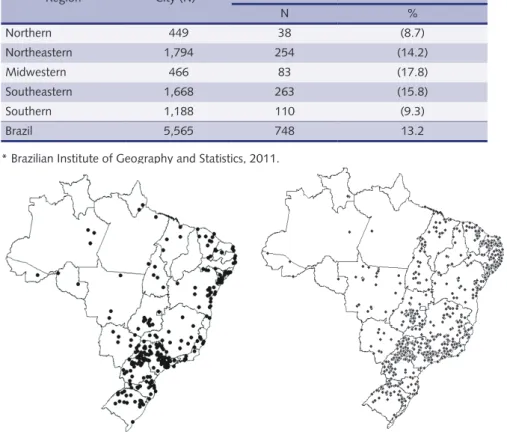
Figure 1 shows the fast evolution of the National Physical Activity Network, including the map of Brazil with all cities funded in 2005 and another with all cities funded in 2009. A significant growth in the number of programs can be noticed in this period, especially in the Southeastern and Northeastern regions.
Table 1 – Distribution and frequency of physical activity programs funded by the Brazilian Ministry of Health, according to country region.
Region City (N)* Cities with physical activity promotion programs
N % Northern 449 38 (8.7) Northeastern 1,794 254 (14.2) Midwestern 466 83 (17.8) Southeastern 1,668 263 (15.8) Southern 1,188 110 (9.3) Brazil 5,565 748 13.2
* Brazilian Institute of Geography and Statistics, 2011.
Figure 1 – Cities included in the National Health Promotion Policy public notices (2005-2008 and 2009), in the thematic areas of Body practices/Physical activity.
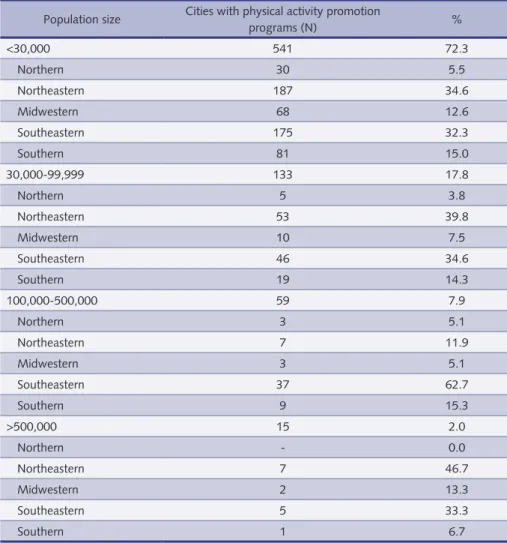
Table 2 categorizes interventions according to population size and region of cities funded. Among smaller cities (fewer than 30,000 inhabitants), which com-prised the majority of programs funded (72.3%), the Northeastern and Southeast-ern regions had more cities included (34.6% and 32.3%, respectively). Among me-dium-size cities (between 30,000 and 99,999 inhabitants), which corresponded to 17.8% of the programs funded, these were also concentrated in the Northeastern (39.8%) and Southeastern regions (34.6%). Finally, among large cities (between 100,000 and 500,000 inhabitants), the Southeastern (62.7%) and Southern regions (15.3%) had more programs funded, whereas such programs were more concen-trated in the Northeastern (46.7%) and Southeastern regions (33.3%) in very large cities (500,000 inhabitants). It is interesting to notice that, regardless of population size, the Northern region had the lowest percentage of cities funded, only reaching the same percentage (5.1%) as the Midwestern region among large cities.
In the case of program characteristics, 8.2% of programs included 500 uals or more in their routine activities, and 45.3% included more than 100 individ-uals. Only 35.4% of programs reached populations living outside the urban area of the cities, such as the rural, riverside and forest areas, with a higher frequency in the Northeastern region (42.3%), followed by the Southeastern (27.5%), Southern (17.7%), Midwestern (9.4%) and Northern regions (3.0%).
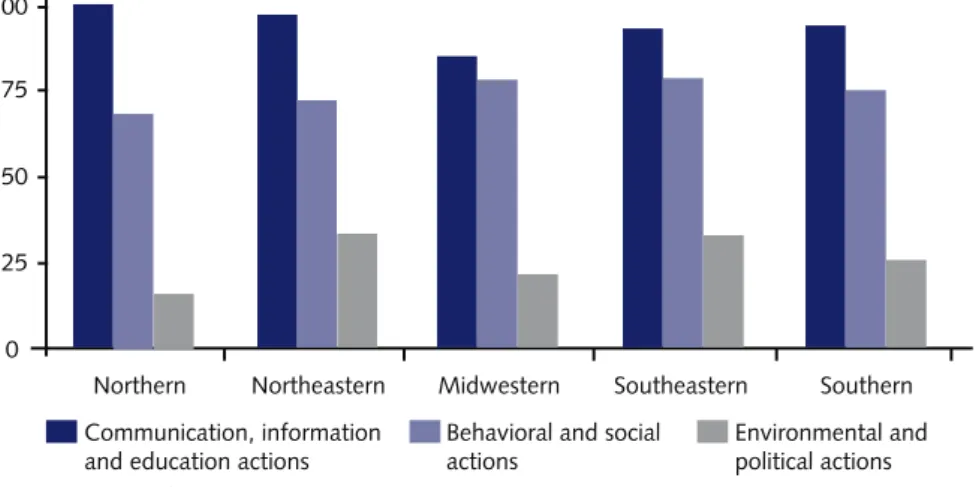
With regard to type of intervention, communication, information, and educa-tion aceduca-tions were those most frequently reported (94.5%). Behavioral and social
actions were mentioned in 75.8% of responses, whereas environmental and po-litical actions were reported by 30.1% of participants. Figure 2 shows the actions developed in each intervention according to Brazilian region.
Environmental and political actions, which are less frequently performed re-gardless of the region, had higher percentages in the Northeastern and South-eastern regions (33.5% and 33.1%, respectively) and a lower percentage in the Northern region (15.8%), compared to the total number of projects developed in these regions. Behavioral and social actions appear in 74.8% of the programs on average, with the highest and lowest percentages occurring in the Southeastern (79.1%) and Northern regions (68.4%). Communication, information and edu-cation actions were the most frequent in all Brazilian regions, with the highest and lowest percentages in the Northern (100%) and Midwestern regions (85.5%), although this lower percentage is higher than the highest percentages of all other types of intervention.
According to responses, programs were mostly aimed at the elderly (76.9%), as observed in all regions and states. Only the state of Pará provided the same number of programs to elderly and adult individuals. The adult population ranked second in number of programs received (38.9%), followed by programs that in-clude the general population (34.0%). Adolescents and children received 23.4% and 32.8% of the programs, respectively. When asked about the high-risk groups
Table 2 – Distribution of physical activity programs funded by the Ministry of Health, according to population size and country region.
Population size Cities with physical activity promotion
programs (N) % <30,000 541 72.3 Northern 30 5.5 Northeastern 187 34.6 Midwestern 68 12.6 Southeastern 175 32.3 Southern 81 15.0 30,000-99,999 133 17.8 Northern 5 3.8 Northeastern 53 39.8 Midwestern 10 7.5 Southeastern 46 34.6 Southern 19 14.3 100,000-500,000 59 7.9 Northern 3 5.1 Northeastern 7 11.9 Midwestern 3 5.1 Southeastern 37 62.7 Southern 9 15.3 >500,000 15 2.0 Northern - 0.0 Northeastern 7 46.7 Midwestern 2 13.3 Southeastern 5 33.3 Southern 1 6.7
included, diabetic and hypertensive individuals were those most frequently bene-fited (59.2%), as observed in all Brazilian regions. The Midwestern, Northeastern and Northern regions included more than 60.0% of the programs aimed at these groups. Obese and overweight individuals ranked second in number of physical activity programs received, totaling 30.3%. Among all groups, there are two others that stand out according to the responses given: smokers (9.6%) and pregnant women (6.4%). All data are shown in Table 3.
Additionally, Table 3 shows that, with regard to the activities provided by the programs, guided walks (80.6%) were the most frequent, especially based on the reports given by respondents from the Midwestern (80.7%), Northern (89.5%) and Southeastern regions (78.3%). Gym classes (78.5%) came next, especially due to the contribution of the Northern and Southern regions, where 90.6% and 74.5% of the programs, respectively, developed this type of activity.
With regard to the functioning of programs, the same table shows that 37.9% provided activities on five or more days a week. Almost half of the programs (48.3%) in the Southeastern region performed their activities on most weekdays. Moreover, 56.4% of programs designed their sessions to last between 30 and 60 minutes. Once more, the Southern region stood out, as it had the highest frequen-cy of all regions (65%), although including the lowest number of programs (35%) lasting more than one hour.
Additionally, with regard to the locations where program activities are per-formed, Table 3 shows that 19.9% of the cities offered activities in only one lo-cation; 54.7%, in two to five locations; and 25.4%, in more than five locations. It should be emphasized that 1/3 of the programs in the Northern region offered their activities in only one location, whereas 35.5% of the programs were offered in more than five locations in the Southern region.
In terms of the facilities used by the programs, Parks and Squares (55.6%) ranked first, followed by Fitness Clubs and Sport Courts (52.0%), Primary Health Units (30.4%) and Churches and Community Centers (29.7%). Concerning the quality of facilities, 61.5% considered the majority of locations to be adequate, 34.0% re-ported that some of them were adequate, and 4.6% considered the majority to be inadequate/poor. The professionals who most frequently applied/guided the activi-ties were physical education teachers (81.0%), followed by physiotherapists (16.5%). With regard to periods of the day available for activities, 89.4% were held in the mornings, 74.2% in the afternoons and only 27.9% in the evenings. The
in-Figure 2 – Types of actions developed in physical activity promotion programs according to coun-try region.
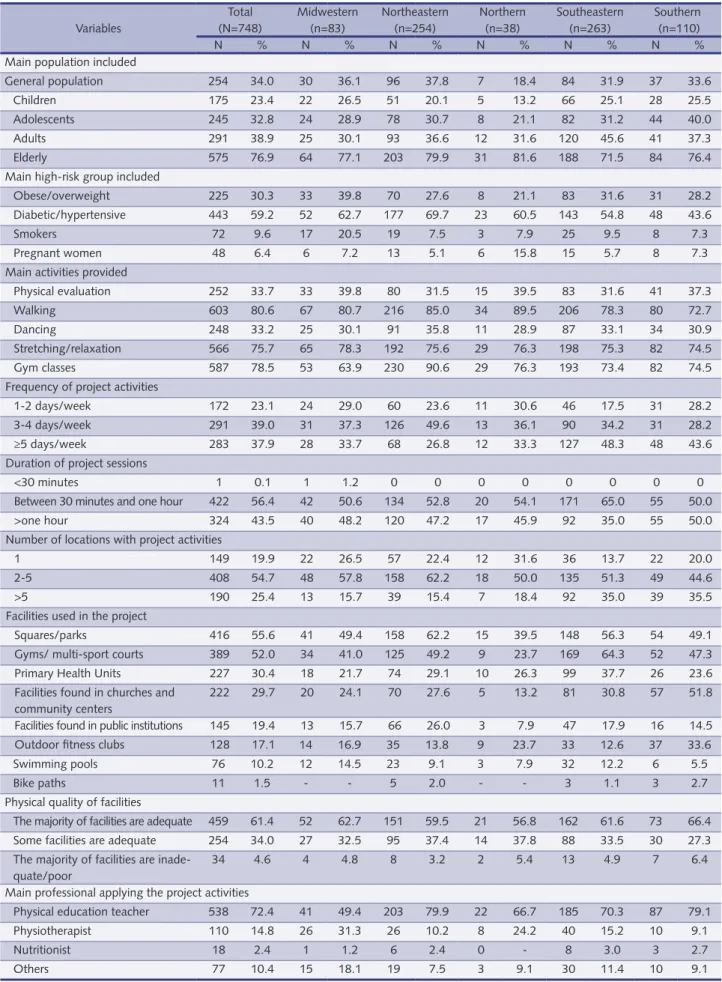
Table 3 – Description of physical activity programs funded by the Ministry of Health, according to country region. Variables Total (N=748) Midwestern (n=83) Northeastern (n=254) Northern (n=38) Southeastern (n=263) Southern (n=110) N % N % N % N % N % N %
Main population included
General population 254 34.0 30 36.1 96 37.8 7 18.4 84 31.9 37 33.6 Children 175 23.4 22 26.5 51 20.1 5 13.2 66 25.1 28 25.5 Adolescents 245 32.8 24 28.9 78 30.7 8 21.1 82 31.2 44 40.0 Adults 291 38.9 25 30.1 93 36.6 12 31.6 120 45.6 41 37.3 Elderly 575 76.9 64 77.1 203 79.9 31 81.6 188 71.5 84 76.4 Main high-risk group included
Obese/overweight 225 30.3 33 39.8 70 27.6 8 21.1 83 31.6 31 28.2 Diabetic/hypertensive 443 59.2 52 62.7 177 69.7 23 60.5 143 54.8 48 43.6 Smokers 72 9.6 17 20.5 19 7.5 3 7.9 25 9.5 8 7.3 Pregnant women 48 6.4 6 7.2 13 5.1 6 15.8 15 5.7 8 7.3 Main activities provided
Physical evaluation 252 33.7 33 39.8 80 31.5 15 39.5 83 31.6 41 37.3 Walking 603 80.6 67 80.7 216 85.0 34 89.5 206 78.3 80 72.7 Dancing 248 33.2 25 30.1 91 35.8 11 28.9 87 33.1 34 30.9 Stretching/relaxation 566 75.7 65 78.3 192 75.6 29 76.3 198 75.3 82 74.5 Gym classes 587 78.5 53 63.9 230 90.6 29 76.3 193 73.4 82 74.5 Frequency of project activities
1-2 days/week 172 23.1 24 29.0 60 23.6 11 30.6 46 17.5 31 28.2 3-4 days/week 291 39.0 31 37.3 126 49.6 13 36.1 90 34.2 31 28.2 ≥5 days/week 283 37.9 28 33.7 68 26.8 12 33.3 127 48.3 48 43.6 Duration of project sessions
<30 minutes 1 0.1 1 1.2 0 0 0 0 0 0 0 0 Between 30 minutes and one hour 422 56.4 42 50.6 134 52.8 20 54.1 171 65.0 55 50.0 >one hour 324 43.5 40 48.2 120 47.2 17 45.9 92 35.0 55 50.0 Number of locations with project activities
1 149 19.9 22 26.5 57 22.4 12 31.6 36 13.7 22 20.0 2-5 408 54.7 48 57.8 158 62.2 18 50.0 135 51.3 49 44.6 >5 190 25.4 13 15.7 39 15.4 7 18.4 92 35.0 39 35.5 Facilities used in the project
Squares/parks 416 55.6 41 49.4 158 62.2 15 39.5 148 56.3 54 49.1 Gyms/ multi-sport courts 389 52.0 34 41.0 125 49.2 9 23.7 169 64.3 52 47.3 Primary Health Units 227 30.4 18 21.7 74 29.1 10 26.3 99 37.7 26 23.6 Facilities found in churches and
community centers
222 29.7 20 24.1 70 27.6 5 13.2 81 30.8 57 51.8 Facilities found in public institutions 145 19.4 13 15.7 66 26.0 3 7.9 47 17.9 16 14.5 Outdoor fitness clubs 128 17.1 14 16.9 35 13.8 9 23.7 33 12.6 37 33.6 Swimming pools 76 10.2 12 14.5 23 9.1 3 7.9 32 12.2 6 5.5 Bike paths 11 1.5 - - 5 2.0 - - 3 1.1 3 2.7 Physical quality of facilities
The majority of facilities are adequate 459 61.4 52 62.7 151 59.5 21 56.8 162 61.6 73 66.4 Some facilities are adequate 254 34.0 27 32.5 95 37.4 14 37.8 88 33.5 30 27.3 The majority of facilities are
inade-quate/poor
34 4.6 4 4.8 8 3.2 2 5.4 13 4.9 7 6.4 Main professional applying the project activities
Physical education teacher 538 72.4 41 49.4 203 79.9 22 66.7 185 70.3 87 79.1 Physiotherapist 110 14.8 26 31.3 26 10.2 8 24.2 40 15.2 10 9.1 Nutritionist 18 2.4 1 1.2 6 2.4 0 - 8 3.0 3 2.7 Others 77 10.4 15 18.1 19 7.5 3 9.1 30 11.4 10 9.1 The highest number of missing data was four, associated with “Main professional applying the project activities” in the Northern region.
struments most frequently used to monitor and assess program activities were sys-tematic meetings of work groups (50.0%), followed by reports, meeting minutes and other types of written records (44.8%). Only 6.6% of programs used the users’ evaluation of the programs as a source for monitoring and assessment.
Concerning the barriers to the functioning of activities, coordinators primarily selected the following aspects: inadequate facilities (25.3%) and bad weather con-ditions (23.7%). What stood out was that the most frequent response to the ques-tion about barriers was “none” (38% of all responses), i.e. that there were no bar-riers to the execution of activities. The findings about the factors that contribute to program success were the most interesting, as the most frequently mentioned items were the pleasant weather (38.2%) and adequate facilities (35.4%), which is in agreement with the barriers to the functioning of activities.
When asked about whether the programs used a certain type of media to pro-mote their actions, 86.2% responded affirmatively and the radio/community radios were the means most often used (59.8%), followed by cars/motorcycles with loud-speakers (33.3%) and posters/pamphlets and folders (30.5%). Additionally, news-papers/magazines (29.1%), websites/blogs/Orkut/Twitter (15.4%), TV (7.9%), billboards/bus ads/posters (3.9%) and community agents (1.3%) were mentioned.
With regard to the main difficulties found to implement projects, lack of fa-cilities/personnel (30.3%) was the aspect most frequently reported by participants, followed by bureaucracy (25.1%) and low adherence of the target population (23.5%). Concerning bureaucracy, the following aspects were mentioned: formal requirements and delay in legal processes for the use of resources to purchase ma-terials, improve facilities and hire professionals, and required reports, among others. There were other aspects that should be emphasized: insufficient financial resources (17.6%), lack of partnerships and low intra- and inter-sectoral interaction (13.1%), lack of capacity-building or engagement/commitment of professionals involved, in addition to constant changes of professionals in the programs (11.4%), lack of/ difficulty in transportation for participants and/or professionals (4.1%) and lack of instructions from the Ministry of Health (1.3%). Only 6.8% of respondents af-firmed that there were no difficulties of any kind in the implementation of projects.
When reporting on their perspectives of program continuity, 79.9% of partici-pants believed that there would be improvements in structure and programs would increase, whereas 61.8% thought that such continuity would depend on the main-tenance of financial incentives from the Ministry of Health. Only 0.7% indicated that programs would end or have their activities reduced and 1.9% reported that these programs would continue, regardless of funding from the Ministry of Health.
DISCUSSION
There are no reports in the literature on such major governmental investment in physical activity promotion as that of Brazil18. Large-scale interventions previous-ly conducted in countries such as Finland and the United States do not clearprevious-ly characterize governmental investment in PA promotion, but rather the sum of efforts of researchers19-20 or governmental investments of a lower magnitude21.
Since the release of the WHO Global Strategy on Diet, Physical Activity and Health22 and the subsequent creation of the National Health Promotion Policy (PNPS)23, a series of actions have been launched, aiming to improve the quality of life of the Brazilian population. The PNPS includes seven thematic areas, one of which
is known as “Body practices/Physical activity”. Among the public notices issued since 2005, there has been a predominance of proposals in the area of PA promotion.
In terms of geographical distribution, the National Physical Activity Network seems to contribute to the increase in the universalization of health programs and in access to services in this area, an action that helps the reduction in the well-known regional inequalities found in Brazil. The Northeastern region is one of those receiving more incentives. On the other hand, the Northern region is un-derrepresented, posing a challenge to the Ministry of Health in its following Net-work-related actions. One of the possible reasons for such inequality is pointed out by the coordinators/professionals in charge of the programs, the main sources of information for the present study: the lack of personnel specialized in the area of physical activity and health promotion in the Northern region. This could be understood as the need for affirmative actions to change this situation, such as investing in the capacity-building and qualification of the existing physical edu-cation professionals and increasing the number of schools of physical eduedu-cation in this region. Although funding opportunities are promoted to all cities and states, few projects reached and included the Northern region.
The fact that few programs have developed environmental and political actions, such as the construction of spaces and implementation of a schedule of PA-related activities, is alarming. However, one of the reasons for this is that resources are di-rected towards project expenses and allocating such resources for new constructions and infrastructure development is not recommended. The recently promoted Aca-demia da Saúde Program could contribute to the improvement of this situation, as 4,000 PA promotion centers are expected to be constructed by 201518. Nonetheless, the support of cities and states is key for actions to continue, increase and become effective, adding strength to what is provided by the Ministry of Health.
The low percentage of programs that offer evening and weekend activities hin-ders access for many workers in Brazil, who have a long working time24, mainly concentrated in morning and afternoon shifts. Based on the experience of ongo-ing initiatives in the country, such as the ACP it is suggested that, apart from the regular hours, programs start their activities early in the morning or in the end of the afternoon, as a strategy to increase the possibility of participation of workers who are busy during working hours25-26.
One of the factors limiting this study was that nearly 30% of program coor-dinators did not answer the questionnaire and a portion of the respondents did not have sufficient knowledge about the programs, due to either the fact that they were general coordinators rather than physical activity program coordinators or the change of professionals in this position. As a result, it is possible that some of the responses do not accurately reflect the reality. Thus, in the following pro-gram registrations, propro-gram coordinators associated with the area of PA should be sought, they should be encouraged to directly follow the activities, and records should be updated whenever there are any changes in project-related aspects, such as facilities, materials, personnel, objectives, strategies, actions and assessment.
Although its construction began in 2005, the Brazilian Ministry of Health’s National Physical Activity Network has contributed to the implementation of PNPS actions on the state and federal management levels of the Unified Health System, especially those centered on body practices/physical activity. This, as a result, increases the access of Brazilians to activities aimed at quality of life improvement.
Some of the results found in this study point to relevant questions, such as the geographical differences, especially in terms of the lower proportion of funding incentives for the Northern region, the lower numbers of environmental and po-litical actions, and the lack of better facilities and qualified personnel, which could serve as a reflection for city managers, program coordinators and the Ministry of Health. Thus, investments could be better directed, more partnerships could be made, and actions could be implemented according to the needs of the population. Additionally, it is recommended that program maintenance should be guaranteed and routine evaluations should be made.
The accumulation of scientific evidence on the high prevalence of physical inactivity and the benefits of physical activity practice confirm the importance of such practice for one’s life and the need for PA promotion to be included in the list of priorities of the public health agenda, even if evidence on the effectiveness of programs promoting PA on the population level is still required. Thus, it is essential that managers of all governmental levels give special emphasis on such priority in the area of health promotion with the creation and maintenance of funding incentives for interventions in this area.
Acknowledgements
Authors would like to thank the Coordenação de Aperfeiçoamento de Pessoal de Nível Superior (CAPES – Coordination for Enhancement of Higher Education Personnel) for the postgraduate scholarship granted.
Authors’ contributions
Tales Amorim contributed to the construction of the research instrument, data analysis and article writing. Alan Knuth was responsible for helping to create the research instrument, leading the training of interviewers and supporting article writing. Danielle Cruz, Deborah Malta and Rodrigo Reis supervised all stages of the study, from the construction of the research instrument, the sample design planning, to the article writing. Pedro Hallal supervised the first author in the entire research process and oversaw the statistical analyses. All authors reviewed the previous versions of the article and approved the final version.
REfERENCES
1. Hallal PC, Andersen LB, Bull FC et al. Global physical activity levels: surveillance progress,
pitfalls and prospects. Lancet 2012; 380:247–57.
2. Lee I-M, Shiroma EJ, Lobelo F et al. Effect of physical inactivity on major non-communicable
diseases worldwide: an analysis of burden of disease and life expectancy. Lancet 2012; 380:219-29
3. Bauman A, Chau J. The role of media in promoting physical activity. J Phys Act Health. 2009
Nov;6 Suppl 2:S196-210.
4. World Health Organization. Global recommendations on physical activity for health. World
Health Organization, Geneva. 2010.
5. Physical Activity Guidelines Advisory Committee report. To the Secretary of Health and
Hu-man Services. Part A: executive summary. Nutrition reviews. 2009; 67:114-20.
6. Brownson RC, Kelly CM, Eyler AA et al. Environmental and policy approaches for promoting
physical activity in the United States: a research agenda. J Phys Act Health. 2008 Jul;5(4):488-503.
7. Knuth AG, Malta DC, Cruz DK et al. Description of the countrywide physical activity
net-work coordinated by the Brazilian Ministry of Health: 2005-2008. J Phys Act Health. 2010 Jul;7 Suppl 2:S253-8.
8. Malta DC, Castro AM, Gosch CS et al. A Política Nacional de Promoção da Saúde ea agenda
9. Mendonça BCA, Toscano JJO, Oliveira ACC. Do diagnóstico à ação: experiências em pro-moção da atividade física programa Academia da Cidade Aracaju: promovendo saúde por meio da atividade física; Academia da Cidade Aracaju program: promoting health through physical activity. Rev bras ativ fís saúde. 2009;14(3).
10. Matsudo S, Matsudo V, Araujo T et al. Do diagnóstico à ação: a experiência do Programa Agita
São Paulo na promoção do estilo de vida ativo; From diagnosis to action: the experience of Agita São Paulo program in promoting an active lifestyle. Rev bras ativ fís saúde. 2008;13(3).
11. Hallal P, Reis R, Hino A et al. Avaliação de programas comunitários de promoção da atividade
física: o caso de Curitiba, Paraná. Rev Bras Ativ Fís Saúde. 2009;14(2):104-14.
12. Venturim LMVP, Molina MDCB. Mudanças no estilo de vida após as ações realizadas no
serviço de orientação ao exercício: Vitória/ES; Life style changes after orientation exercise service actions: Vitória/ES. Rev bras ativ fís saúde. 2005;10(2).
13. Nakamura PM, Papini CB, Chiyoda A et al. Programa de intervenção para a prática de
ativ-idade física: Saúde Ativa Rio Claro; Intervention Program to Practice of Physical Activity: Saúde Ativa Rio Claro. Rev bras ativ fís saúde. 2010;15(2).
14. Ministério da Saúde. Portaria nº 719, de 7 de abril de 2011. Institui o Programa Academia da
Saúde no âmbito do Sistema Único de Saúde. Diário Oficial da União 2011; 8 abr.
15. Ministério da Saúde. Portaria nº 139, de 11 de agosto de 2009. Estabelece mecanismo de
re-passe financeiro do Fundo Nacional de Saúde aos Fundos de Saúde Municipais, Estaduais e do Distrito Federal, por meio do Teto Financeiro de Vigilância em Saúde, para ações específicas da Política Nacional de Promoção da Saúde. Diário Oficial da União 2009; 13 ago.
16. Ministério da Saúde. VIGITEL Brasil 2006: vigilância de fatores e risco e proteção para
doenças crônicas por inquérito telefônico. Ministério da Saúde; 2007.
17. Recommendations to increase physical activity in communities. Am J Prev Med. 2002
May;22(4 Suppl):67-72.
18. Malta DC, Silva JB. Policies to promote physical activity in Brazil. The Lancet . 2012; 380:195-96.
19. Young DR, Haskell WL, Taylor CB, Fortmann SP. Effect of community health education
on physical activity knowledge, attitudes, and behavior. The Stanford Five-City Project. Am J Epidemiol. 1996 Aug 1;144(3):264-74.
20. Puska P, Ståhl T. Health in All Policies-the finnish initiative: background, principles, and
cur-rent issues. Annual review of public health. 2010;31:315-28.
21. Salinas J, Vio F. Promoting health and physical activity in Chile: a policy priority. Rev Panam
Salud Publica. 2003 Oct;14(4):281-8.
22. Waxman A. Prevention of chronic diseases: WHO global strategy on diet, physical activity and
health. Food and nutrition bulletin. 2003;24(3):281.
23. Ministério da Saúde. Política nacional de promoção da saúde. Ministério da Saúde; 2006.
24. Instituto Brasileiro de Geografia e Estatística. Pesquisa Nacional por amostra de domicílios.
Síntese de indicadores 2009. http://ibge.gov.br/home/estatistica/populacao/trabalhoerendi-mento/pnad2009/pnad_sintese_2009.pdf. Acessado em 8 de agosto de 2011.
25. Simoes EJ, Hallal P, Pratt M et al. Effects of a community-based, professionally supervised
intervention on physical activity levels among residents of Recife, Brazil. Am J Public Health. 2009 Jan;99(1):68-75.
26. Hallal PC, Tenorio MC, Tassitano RM et al. Evaluation of the Academia da Cidade
pro-gram to promote physical activity in Recife, Pernambuco State, Brazil: perceptions of users and non-users. Cad Saude Publica. 2010 Jan;26(1):70-8.
Corresponding author Tales C Amorim Rua Marechal Deodoro 1160 Pelotas-RS-Brasil 96020-220 Fone(fax): 55 53 3284-1300 Email: [email protected] Received 11/22/2012 Revised 03/11/2013 Approved 03/14/2013