Potential of photovoltaic solar energy to reduce the
carbon footprint of the brazilian electricity matrix
Potencial da eletricidade solar fotovoltaica para reduzir a pegada de carbono associada a matriz elétrica brasileira
Potencial de la electricidad solar fotovoltaica para reducir la huella de carbón asociada a la matriz eléctrica brasileña
Monica Carvalho1 Danielle Delgado2
Abstract
Photovoltaic solar energy within distributed generation has been consolidating itself in Brazil since 2012. This growth is accompanied by lack of knowledge of the effects, both technical and environmental, of the use of this resource in the Brazilian Electric Power System. The first step of this study applied the Life Cycle Assessment methodology to all stages of the Brazilian Electric Power System, to quantify the emissions associated with the consumption of 1 kWh of electricity in Brazil. The generation potential was considered, along with the following steps (and consequent losses) associated with transmission, distribution and transformation. The reference documents utilized for the electricity generation projections were the statistical annual reports of the Energy Research Company and the Decennial Plan for Electricity Expansion 2024. The Brazilian electricity mixes for the years 2001, 2006 to 2015 and 2024 were modeled in SimaPro (LCA software), for all stages of the Brazilian Electric Power System. The environmental impact assessment method selected was IPCC 2013 GWP 100y, which expressed the LCA results in terms of kg CO2-eq. An important contribution of this study, which will be further utilized within energy supply optimization studies with software Lingo, is the establishment of the dynamics of emissions associated with the consumption of electricity in Brazil. The potential of photovoltaic solar electricity to substitute thermoelectric generation was
1 Federal University of Paraíba, Center of Alternative and Renewable Energy, Department of Renewable Energy Engineering | Email: monica@cear.ufpb.br
2 Federal Institute of Education, Science and Technology of Bahia. Paulo Afonso Campus
also verified. In 2015 photovoltaic solar electricity appeared in the Brazilian electricity matrix, and after representativeness analysis for year 2024, a potential reduction was identified in the carbon footprint of the Brazilian electricity mix after this year. Although photovoltaic solar electricity presents high potential for climate change mitigation, it is still inexpressive and does not present potential to substitute thermoelectric power plants in the Brazilian electricity matrix.
Keywords: Electricity Mix, Renewables, Solar Photovoltaic Electricity, Carbon Emissions.
Resumo
A energia solar fotovoltaica dentro da geração distribuída vem se consolidando no Brasil desde 2012. Este crescimento é acompanhado por um desconhecimento dos efeitos, tanto técnicos quanto ambientais, da utilização deste recurso no Sistema Elétrico Brasileiro. O primeiro passo deste estudo foi aplicar a metodologia da Avaliação do Ciclo de Vida a todas as etapas do Sistema Elétrico Brasileiro, para quantificar as emissões associadas ao consumo de 1 kWh de eletricidade no Brasil. O potencial de geração foi considerado, juntamente com as seguintes etapas (e consequentes perdas) associadas à transmissão, distribuição e transformação. Os documentos de referência utilizados para as projeções de geração de eletricidade foram os relatórios anuais estatísticos da Empresa de Pesquisa Energética e do Plano Decenal de Expansão da Eletricidade 2024. Os mixes elétricos para os anos de 2001, 2006 a 2015 e 2024 foram modelados no software SimaPro, para todas as etapas do Sistema Elétrico Brasileiro. O método de avaliação de impacto ambiental selecionado foi o IPCC 2013 GWP 100a, que expressou os resultados da análise em termos de kg de CO2-eq. Uma contribuição importante deste estudo, que será utilizada em estudos de otimização do fornecimento energia com o software Lingo, é o estabelecimento da dinâmica das emissões associadas ao consumo de eletricidade no Brasil. O potencial da eletricidade solar fotovoltaica para substituir a geração termoelétrica foi verificado. Em 2015, a eletricidade solar fotovoltaica apareceu na matriz elétrica brasileira e, após análise de representatividade para o ano 2024, foi identificada uma potencial redução na pegada de carbono do mix de eletricidade brasileiro a partir deste ano. Embora a eletricidade solar fotovoltaica apresente alto potencial de mitigação de mudanças climáticas, ainda é inexpressiva e não apresenta potencial para substituir as usinas termelétricas na matriz elétrica brasileira.
Palavras-Chave: Mix elétrico, Renováveis, Energia Solar Fotovoltaica, Emissões de
Resumen
La energía solar fotovoltaica dentro de la generación distribuida se ha consolidado en Brasil desde 2012. Este crecimiento se acompaña de un desconocimiento de los efectos, tanto técnicos como ambientales, de la utilización de este recurso en el Sistema Eléctrico Brasileño. El primer paso de este estudio ha sido aplicar la metodología del Análisis de Ciclo de Vida a todas las etapas del Sistema Eléctrico Brasileño para cuantificar las emisiones asociadas al consumo de 1 kWh de electricidad en Brasil. Se ha considerado el potencial de generación, y las etapas siguientes (y consecuentes pérdidas) asociadas a transmisión, distribución y transformación. Los documentos de referencia utilizados para las proyecciones de generación de electricidad han sido los informes estadísticos anuales de la Compania de Investigación Energética y el Plan Decenal de Expansión de la Electricidad 2024. Los mixes eléctricos para los años 2001, 2006 a 2015 y 2024 fueron modelados en el softwareSimaPro, para todas las etapas del Sistema Eléctrico Brasileño. El método de evaluación de impacto ambiental seleccionado ha sido el IPCC 2013 GWP 100a, que expresa los resultados del análisis en términos de kg de CO2-eq. Una importante contribución de este estudio, que se utilizará en estudios de optimización del suministro de energía con el software Lingo, es el establecimiento de la dinámica de emisiones asociada al consumo de electricidad en Brasil. El potencial de la electricidad solar fotovoltaica para sustituir generación termoeléctrica también ha sido verificado. En 2015 la electricidad solar fotovoltaica apareció en la matriz eléctrica brasileña, y después del análisis de representatividad para el año, se identificó una potencial reducción en la huella de carbono de la mezcla eléctrica brasileña después de este año. Aunque la energía solar fotovoltaica presenta un alto potencial de mitigación de cambio climático, sigue siendo inexpresiva y no presenta potencial para sustituir las centrales termoeléctricas en la matriz eléctrica brasileña.
Palabras Clave: Mix eléctrico, Renovables, Electricidad Solar Fotovoltaica, Emisiones
de Carbono.
1. Introduction
In recent years, greenhouse gas (GHG) emissions associated with anthropogenic activities have been in the spotlight due to growing concerns about climate change and its consequences. The latest IPCC report on mitigation of climate change (Bruckner et al., 2014) mentioned that in 2010
the energy supply sector was responsible for 35% of total anthropogenic GHG emissions, being the largest contributor to global GHG emissions.
The Kyoto Protocol, although its adoption was made unanimously in 1997, entered into force only in 2005. It included mandatory targets on GHG emissions for developed/industrialized countries: ranging between -8% and +10% of the countries’ individual 1990 GHG emissions levels. The aim was to reduce overall emissions by at least 5% below existing 1990 levels between 2008 and 2012 (commitment level) (UNFCCC, 2014).
Commitment to the Kyoto Protocol was mandatory only for developed countries, which reflected the international opinion that these countries must lead by example and mitigate climate change; industrialized countries, besides reducing their own emissions, should also assist developing countries through the production of means and technology (Carvalho, et al., 2015). The United Nations Framework Convention on Climate Change (UNFCCC) has already recognized that massive and wide collaboration is required from all countries due to the global nature and impacts of climate change; an appropriate international response should follow a common but differentiated participation according to the capacity of each country (UNFCCC, 1998). Stabilization of global GHG emissions cannot be conducted by developed countries only; it is necessary that developing economies also shift in the direction of low carbon development to reduce global GHG emissions on the required scale (World Bank, 2010).
Brazil ratified the Kyoto Protocol in 2002, with internal approval through Decree-law #144 (BRAZIL, 2015a) but its commitment against climate change had already begun in 1992, when Brazil hosted the Rio Earth Summit (World Bank, 2010). In 2008 the Brazilian National Plan on Climate Change was launched, reflecting the strong commitment to voluntarily reduce carbon emissions, and in 2009 a voluntary national GHG reduction target was set between 36.1% and 38.9% of projected emissions by 2020 (World Bank, 2010). Although not directly related to the aforementioned targets, Brazil has the
ambition of reducing 43% of its GHG emissions by 2030, mainly by boosting the usage of renewable energy and reducing deforestation in the Amazon region (Garside, 2015).
According to Carvalho, et al. (2015), concerns on climate change and its associated effects are beginning to positively influence Brazilians, leading to the growing interest in learning more about the GHG emissions embedded in products, processes and activities. Calculation of these GHG emissions is progressively becoming common in academic environments (but actions and policies towards mitigation and reduction are still incipient). In the world scenario, according to Delgado (2015), despite the fact that Brazil presents great energy potential and has encouraged considerably the utilization of renewable energy sources, their participation in the Brazilian energy matrix is still incipient3 when compared to other countries. For example, participation
of solar energy in the 2015 electricity matrix of Germany (world leader in solar energy) and Brazil was, respectively, 5% (Fraunhofer, 2017) and 0.02% (BRASIL, 2015c) - however, average solar irradiation in Brazil is within the range of 1500-2400 kWh/m2/year while Germany presents 900-1250 kWh/m2/ year (Pereira et al., 2006).
This study utilizes the Life Cycle Assessment methodology to calculate the GHG emissions associated with increased penetration of photovoltaic solar (PV) electricity in the Brazilian electricity mix. The reference documents for the energy predictions herein presented are the Brazilian 2030 National Energy Plan - BNEP 2030 (BRAZIL, 2007) and the Brazilian Decennial Energy Expansion Plan 2024 - BDEEP 2024 (BRAZIL, 2015b). Both documents are important planning tools for the Brazilian electricity sector, and should help to design national development strategies. The aim is to verify whether the introduction of a greater share of solar PV electricity in the Brazilian
3 2015 electricity matrix (BRASIL, 2015): 16.92% thermoelectric, 61.30% hydraulic, 7.49% biomass, 5.65% wind, 1.32% nuclear, 0.02% solar, and 5.80% others. “Others” refers to energy recoveries, coke-oven gas, and other secondary fuels. Biomass originates from firewood, sugarcane bagasse and leachate.
electricity mix will decrease the carbon emissions associated with the consumption of electricity.
2. Materials and Methods
2.1. Electricity Generation in Brazil
Brazil presents significant hydric potential, and most of electricity consumed in the country is generated by hydroelectric power plants (in 2015, 61.30%; BRAZIL, 2015c). Hydroelectricity has been based on the construction of large power plants; regarding the economic aspects, there has been a great capitalization effort that resulted in low energy costs. In the mid-1990’s, approximately 15% of Brazil’s external debt was related to these construction works, with unit costs ranging from 1,000-1,500 US$/kW for capacity, and 20-30 US$/MWh for energy (Reis, 2011).
Energy consumption in Brazil presented the highest mean increase rate between 1990 and 2013 (103%), and between 2013 and 2014, presented an increase of 8% (SEEG, 2015). More specifically, the demand for electricity had doubled between 1990 and 2013, and despite the fact that hydroelectricity is the major constituent of the Brazilian electricity mix, its participation had decreased from 87.2% in 2000 to 68.6% in 2013 (thermoelectric generation had increased, in the same period, from 8.8% to 20.6%) (SEEG, 2015). The power sector is usually responsible for considerable GHG emissions in developed countries, but this is not applicable to Brazil, according to McKinsey & Company (2009), due to the significant presence of hydroelectricity - however, the water crisis has increased the participation of thermoelectric power plants.
The Brazilian Decennial Energy Expansion Plan 2024 (BDEEP) (BRAZIL, 2015b) predicts that Brazil will increase its installed generation capacity by 73 GWe, with half of this figure based on renewables: wind, solar, biomass and small hydro stations. BDEEP also predicts important participation in oil markets in the next ten years, with 5 million barrels per day (BPD) and exports of 2 million BPD in 2024; despite the increased relevance in oil production
and exports, the Brazilian electricity mix should reach 45% contribution of renewables, which is considerably above the world average (13.5% ) or OCDE countries (9%) (BRAZIL, 2015b). BDEEP 2024 (BRAZIL, 2015b) also presents the expansion of demand and supply for different energy sources between 2014 and 2023.
The Brazilian 2030 National Energy Plan (BNEP 2030) (BRAZIL, 2007) was adopted as the reference scenario for the energy sector, and assumes increased usage of renewables4 between 2010 and 2030; but the Brazilian electricity mix
should experience negative climate impacts (higher GHG emissions) over time under the reference scenario. The BNEP 2030 proposed a strategic direction for the expansion of electricity supply in Brazil, estimating future electricity based on forecast growths for demand (per year) that correspond to average gross domestic product growths per year (BRAZIL, 2007).
For year 2001, data provided by Brazilian National Operation System Grid (Operador Nacional do Sistema - ONS) in its Daily Operation Reports (Informativo Diário de Operação - IPDO) were utilized (ONS, 2016). For years 2006-2010, information provided by the Brazilian Energy Research Company (Empresa de Pesquisa Energética - EPE) (BRAZIL, 2011), was used. Data for the period 2011-2014 were obtained from the EPE statistical report for 2015 (BRAZIL, 2015c). The generation matrix considered for year 2015 followed the Brazilian National Electricity Agency (Agência Nacional de Energia Elétrica - ANEEL) (BRAZIL, 2016). The electricity source shares projected for 2024 were obtained from the Decennial Plan for Electricity Expansion 2024, published by EPE (BRAZIL, 2015b).
The first, fifteenth and last days of each month were considered for the calculation of monthly averages and then an annual average of electricity
4 The scenario mentioned by BRAZIL (2007) presents increases for the internal offer of electricity in 2030 (compared to 2015 values): large hydroelectrical power plants (61,300 MW), small hydroelectrical power plants (6000 MW), wind farms (3300 MW), sugarcane bagasse power plants (4,750 MW), and urban solid residues (1,300 MW). Expected increases under 100 MW were not made available.
generation percentages was calculated, per source, for the composition of the electricity mix.
2.2. Life Cycle Assessment
Due to a progressive process of environmental awareness, nowadays the environmental performance of products (goods and services) has become a major concern, and it is important to quantify appropriately the negative (or positive) effects on the environment. Life Cycle Assessment (LCA) has been one of the most utilized, widespread and consolidated methodologies for the calculation of environmental impacts, comprehending the extraction of raw materials, manufacture, transportation or distribution, utilization, and final disposal of waste scenarios (Carvalho et al., 2015).
LCA comprises the inventory of relevant inputs and outputs, the evaluation of the potential environmental impacts and the interpretation of results. Growing concerns on several environmental issues (damages to ecosystems, human health, depletion of resources, etc.) are one of the main reasons for undertaking a LCA study (Carvalho et al., 2015). Public opinion, political bodies and industry have broadly voiced these concerns.
The main objectives for developing a LCA study are (SETAC, 1993): i) provide the complete scenario of the interactions of an activity with the environment, which will help understand the overall and interdependent characteristics of the consequences of anthropogenic activities; ii) provide decision-makers with sufficient information to define the environmental effects of these activities and identify opportunities for improvements. The reader should check on Guinée (2001) and Guinée (2002) for a more detailed explanation on LCA.
Lately, special attention has been devoted to the environmental impacts associated with the consumption of energy, as research efforts and public policies embrace the term “low carbon”, which means less dependence on fossil fuels (high carbon content). However, low-carbon sources currently account for a minority of global energy consumption. Energy use (with its associated
primary energy consumption and emissions) is an important contributor to the life cycle impacts of many products and processes, as well as to corporate GHG inventories (Carvalho et al., 2015). LCA can be utilized to quantify the environmental loads associated with the production and consumption of energy and in this way the supply systems can be ranked accordingly to any environmental indicator.
A framework for LCA has been standardized in the ISO 14040 series (ISO 14040, 2006; ISO 14044, 2006), consisting of the following elements (Carvalho, 2011): “i)Goal and Scope definition, which specifies the goal and intended use of the LCA and delineates the assessment (system boundaries, function and flow, required data quality, technology and assessment parameters); ii) Life Cycle Inventory analysis (LCI), which includes the collection of data on inputs and outputs for all processes in the product system; iii) Life Cycle Impact Assessment (LCIA), which translates inventory data on inputs and outputs into indicators about the product system’s potential impacts on the environment, human health, and availability of natural resources; and iv) Interpretation, the phase where the results of the LCI and LCIA are interpreted according to the goal of the study and where sensitivity and uncertainty analysis are performed to qualify the results and conclusions.”.
Step iii) LCIA can be carried out with the aid of different impact assessment methods, which can consider different aspects of the environment and therefore, yield different results. LCIA can be further split into four steps: i) Classification: substances are sorted into classes according to the effects on the environment; ii) Characterization: substances are multiplied by a factor that reflects the relative contribution to the environmental impact; iii) Normalization: the quantified impact is compared to a certain reference value, and iv) Weighting: different value choices are given to impact categories, generating a single score.
The main methods are divided into midpoint or endpoint approaches. According to Bare (2000), “midpoints are considered to be links in the
cause-effect chain (environmental mechanism) of an impact category, prior to endpoints, at which characterization factors or indicators can be derived”. For midpoint approaches, the normalization and weighting steps of LCIA are not carried out. Midpoint approached focus on environmental themes such as climate change, acidification, human toxicity, depletion of ozone layer. In endpoint approaches, the different impact categories are normalized and weighed according to a specific defined objective, which is oriented toward verification of a specific damage on human health, ecosystem quality or resources.
Due to widespread concerns on global warming and its associated climate change, GHG were chosen to represent the environmental loads herein. Climate change is a global impact category (Udo de Haes, 2002) because it is not relevant where emissions occur: because of the average tropospheric lifetime of GHG, even those with short lifetimes such as methane (10 years) exceed the tropospheric mixing time, which is approximately of one year (Carvalho et al, 2015). The impact evaluation method selected for representation of environmental impacts was the most recent version of the IPCC method (IPCC, 2014), which expresses environmental impacts in kg CO2-eq. This method quantifies all atmospheric emissions, and multiply these by a conversion factor to express the result in kg CO2-eq. Software SimaPro v. 8.0.5 (PréConsultants, 2015) was utilized for all calculations, with EcoInvent version 3 (EcoInvent, 2014) database.
The EcoInvent (2015) database was used, where the Brazilian process for high voltage electricity was adapted to reflect the generation electricity mix for years 2001, 2006-2015 and 2024. Then, transmission and distribution for low voltage consumption were added. After the inventory was compiled, with the percentages corresponding to the electricity matrix of each year, calculation of carbon emissions followed, with interpretation of results.
3. Results and Discussion
The study presented herein calculated the carbon footprint associated with the Brazilian electricity matrixes of years 2001, 2006-2015, the projections for 2024, aiming to evaluate how the progressive introduction of solar photovoltaic electricity influences the carbon footprint results obtained.
Table 1 shows the electricity generation percentages, per source, in Brazil. “Others” refers to energy recoveries, coke-oven gas, and other secondary fuels. Biomass originates from firewood, sugarcane bagasse and leachate. Table 1 includes imports from Argentina, Paraguay, Uruguay, and Venezuela. Figure 1 shows the Brazilian electricity dynamics.
Table 1 Generation percentages for electricity, per source, in Brazil5
2001 2006 2007 2008 2009 2010 Thermoelectric 6.09% 8.52% 7.62% 11.04% 6.73% 11.18% Hydraulic 81.36% 83.18% 84.04% 79.80% 84.21% 78.19% Nuclear 0.00% 3.28% 2.78% 3.02% 2.80% 2.82% Biomass 6.39% 3.44% 3.87% 4.15% 4.44% 6.05% Wind 0.00% 0.08% 0.15% 0.26% 0.27% 0.42% Solar 0.00% 0.00% 0.00% 0.00% 0.00% 0.00% Others 0.00% 1.49% 1.55% 1.74% 1.56% 1.34% 2011 2012 2013 2014 2015 2024 Thermoelectric 8.24% 12.92% 18.55% 22.21% 16.92% 14.30% Hydraulic 80.55% 75.18% 68.49% 63.24% 61.30% 56.70% Nuclear 2.94% 2.90% 2.71% 2.60% 1.32% 1.60% Biomass 5.95% 6.27% 6.95% 7.58% 7.49% 8.70% Wind 0.51% 0.91% 1.15% 2.07% 5.64% 11.60% Solar 0.00% 0.00% 0.00% 0.00% 0.02% 3.30% Others 1.81% 1.81% 2.14% 2.30% 5.80% 3.80%
5 2001: (ONS, 2016); 2006-2010: (BRASIL, 2011); 2011-2014: (BRASIL, 2015c); 2015: (BRASIL, 2016); 2024: (BRASIL, 2015b).
Figure 1: Electricity mix dynamics for Brazil
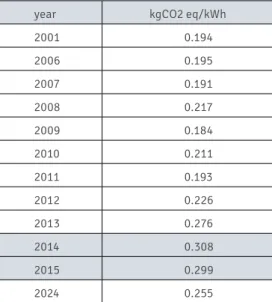
The results presented in Table 2 and Figure 2 were generated after input data from Table 1 had been introduced in SimaPro, and show that the electricity generation mixes for years 2014-2015 presented the highest carbon emissions within the evaluated period.
Table 2: Carbon emissions associated with the consumption of 1 kWh of electricity in Brazil (Results generated by software Simapro, from Table 1 data).
year kgCO2 eq/kWh
2001 0.194 2006 0.195 2007 0.191 2008 0.217 2009 0.184 2010 0.211 2011 0.193 2012 0.226 2013 0.276 2014 0.308 2015 0.299 2024 0.255
Figure 2: Emissions, per source, per year (Results generated by software Simapro, from Table 1 data).
Although the period 2014-2015 is represented by the progressive introduction of micro and minigeneration in Brazil, these years were affected by a severe water crisis, mainly in the year of 2014, with the consequent creation of tariff flags (charges). The tariff flag system was created to cover additional costs that arise when thermal power plants go online, as this type of power plants are more expensive to operate.
Hydroelectric generation corresponded to 373 TWh in 2014 (63.2% participation), which represented a decrease of 4.5% in comparison with 2013 figures (BRAZIL, 2016). This drop was compensated by an increase in thermoelectric generation in 2014, especially from oil derivatives, coal and natural gas, which expanded 43.3%, 24.2% and 17.5% in comparison with 2013 values, totalizing 131 TWh (22.2% participation in electricity mix) (BRAZIL, 2016).
Figure 2 shows that the electricity matrix resources that contribute the most to CO2-eq emissions are thermoelectric and hydroelectric power plants.
Thermoelectric power plants present extremely high operational emissions, and although contribute less to the overall electricity matrix, the impact is high. Hydroelectric power plants, on the contrary, present insignificant operational emissions, but contribute with a generous share of the electricity generated in Brazil and therefore the final impact is high. It must be highlighted that land use for construction of facilities was included, along with construction of the power plants themselves.
The most representative emissions for years 2013 and 2014, as expected, referred to hydroelectric and thermoelectric sources. After 2015, there was a slight decrease in the carbon footprint, which is consolidated after year 2024, and coincides with the beginning of introduction of photovoltaic solar energy in the Brazilian electricity matrix. This result, associated with a more general analysis, could contribute to an energy balance study for substitution of thermoelectric power plants by photovoltaic power plants. Currently, when compared to thermoelectric utilization (generation capacity), it is not a possibility to think about substituting thermoelectric power plants.
Although renewable energy is well-represented in the Brazilian electricity matrix, the solution adopted by the Interconnected National System to address the hydric crisis is to dispatch natural gas and coal thermoelectric power plants. Operation of these power plants in 2013 and 2014 justifies the increase in carbon footprint verified in these years.
The 2015 electricity matrix, however, presents a decrease of 5.29% in the use of thermoelectric power plants (regarding 2014), coinciding with the (although still timid) introduction of photovoltaic solar electricity. The projected reduction from 0.299 kg CO2-eq/kWh in 2015 to 0.255 kg CO2-eq/kWh in 2024 is mainly due to the introduction of 1.6 TWh of small-size residential and commercial photovoltaic solar generation units, in distributed generation. This is the main strategy to mitigate climate change and guarantee that the emissions associated with the consumption of electricity in Brazil remain low.
Most existing scientific literature does not consider a life cycle approach for the calculation of emissions associated with electricity consumption. Cursino (2015) mentions that in August/2015 the CO2 emissions associated with electricity generation in Brazil reached 157,800 kg CO2/kWh produced. However, these emissions seem to be associated only with direct emissions, and do not include distribution, transmission or imports, as this value is far from the values calculated herein. The work of Miranda (2012) carried out a systematic literature review through meta-analysis, identifying studies that estimated GHG emissions for the life cycle of generation technologies present in the Brazilian matrix, estimating 0.125 kg CO2/kWh for the Brazilian matrix (92% hydroelectric, wind and nuclear).
Medeiros et al (2013) mention that a GHG emission inventory has been compiled for the electricity consumed in Brazil, representing the life cycle of all sources that constitute the Brazilian energy matrix, distribution, and losses until delivery of energy to the user (including the energy consumed by the power plants and imports). The GHG emissions of electricity consumed in Brazil, considering a life cycle perspective, was 0.745 kg CO2-eq/kWh (year 2008 mix).
The study of Alvim et al. (2010) established GHG emissions for each technology that constitutes the Brazilian electricity mix, and the values were closer to those found herein: nuclear 0.0278 kg eq/kWh, coal 1.343 kg CO2-eq/kWh, natural gas 0.523 kg CO2-CO2-eq/kWh, sugarcane bagasse 0.049 kg CO2-eq/ kWh, diesel oil 0.832 kg CO2-eq/kWh, wind 0.021 kg CO2-eq/kWh, and solar photovoltaic 0.105 kg CO2-eq/kWh. Photovoltaic solar electricity presented the highest indirect emissions (Alvim et al., 2010). The results of Turconi et al (2013) are within the same magnitude order, and the authors also discuss that from a LCA perspective, the most critical aspects that affect coherence and transparence of the results were definition of the functional unit (study object borders), the LCA method applied, and the impact allocation method.
This wide variation in GHG emission results for 1 kWh of electricity is due to a lack of standardization when using the same methodology to model each inventory, such as the conceptual divergences pointed out by Medeiros et al (2013).
According to Vahl (2014), natural gas will be the basis for the development plan of the Brazilian Electricity Network, leaving solar photovoltaic generation in second plane until 2030 - wind and biomass also follow this slow development rhythm. Vahl (2014) carried out regression analyses using historical data from ONS and EPE, concluding that if the real growth rate of thermal dispatch occurs similarly to the installed capacity, before 2022 the Brazilian Electricity mix will present a major participation of thermoelectric power plants, and the emissions associated with the consumption of electricity in Brazil could increase between 44.4% to 90.3% in 2020, and between 72% and 180.7% in 2030.
Regarding solar energy, currently the installed capacity is still unrepresentative, including R&D projects, power plants installed in the 2014 World Cup stadiums and power plants classified as distributed mini or microgeneration (in accordance with ANEEL resolution 482/2012 - Brasil, 2017). Heliothermal generation centrals were not considered in the horizon of PDE 2024, being only a complement to intermittent renewable sources, such as wind.
It was observed that, within the context herein presented, even with the decreasing emissions of CO2eq/kWh after 2015, as a consequence of the introduction of photovoltaic solar electricity in the Brazilian electricity matrix, it is still not possible to consider the substitution of thermoelectric power plants by photovoltaic solar systems. Despite the high environmental mitigation potential, especially when compared with thermoelectric power generation, this type of resource, widely available in Brazil, presents low insertion potential when considering the projections for the Brazilian electricity matrix in the next years.
4. Final Remarks and Conclusions
This study applied the Life Cycle Assessment methodology to calculate the carbon footprint associated with the consumption of 1 kWh of electricity in Brazil, aimed at meeting the demands of optimization studies that require these data. It was also verified how the progressive introduction of photovoltaic solar electricity can influence the Brazilian electricity matrix. Carbon footprint figures were obtained for years 2001, 2006-2015 and 2024 (projection). The reference documents utilized for energy projections were the statistical annual reports of the Energy Research Company and the Decennial Plan for Electricity Expansion 2024 (published by the Energy and Mines Ministry).
According to the results presented, the environmental benefits reached with the introduction of renewable energy (e.g., photovoltaic solar energy) must be highlighted. Although it was demonstrated that the environmental impact of these systems is not zero, the Life Cycle Assessment methodology enabled the quantification of the greenhouse gas emissions associated with each scenario, to verify the potential to mitigate climate change.
Despite presenting high potential to mitigate environmental problems, with a consequent reduction in kg CO2-eq/kWh, and of being in full growth in Brazil, distributed generation is still inexpressive in the Brazilian electricity matrix.
The solution adopted by the Brazilian Interconnected National System to address the hydric crisis is to dispatch natural gas and coal thermoelectric power plants. Operation of these power plants in 2013 and 2014 resulted in increased carbon footprints in these years.
The 2015 electricity matrix, however, presented a 5.29% decrease in thermoelectric-originated electricity (regarding 2014), coinciding with the (although still timid) introduction of photovoltaic solar electricity. The projected reduction between 2015 and 2024, from 0.299 kg CO2-eq/kWh to 0.255 kg CO2-eq/kWh is mainly due to the introduction of 1.6 TWh of small-size
residential and commercial photovoltaic solar generation units, in distributed generation. This is the main strategy to mitigate climate change and guarantee that the emissions associated with the consumption of electricity in Brazil remain low.
An important contribution of this study, which will be utilized in current and future optimization studies for energy supply with Lingo software, is the establishment of a value of emissions associated with the consumption of electricity in Brazil. Another important study that can be carried out by building upon the work presented herein is the verification of the influence of distributed micro and minigeneration, from an environmental perspective, in the electricity distribution systems of the Brazilian Electricity Power System.
Acknowledgments
Monica Carvalho would like to thank the National Council for Scientific and Technological Development (CNPq), projects nº 475879/2013-9 and nº 303199/2015-6.
References
ALVIM, C. F. et al. Comparação da emissão de gases de efeito estufa (GEE) na geração nuclear de eletricidade no Brasil com as de outras fontes. Economia & Energia 2010, v. 15, n. 79.
BRAZIL. Energy Research Company. 2011 [Accessed on 17 apr 2017] Available at World Wide Web: <http://www.epe.gov.br/ AnuarioEstatisticodeEnergiaEletrica/
20111213_1.pdf>.
BRAZIL. Energy Research Company. 2015c [Accessed on 17 apr 2017] Available at World Wide Web: http://www.epe.gov.br/AnuarioEstatisticodeEnergiaEletrica/ A n u % C 3 % A 1 r i o % 2 0 E s t a t % C 3 % A D s t i c o % 2 0 d e % 2 0 E n e r g i a % 2 0 El%C3%A9trica%202015.pdf>
BRAZIL. Ministry of Environment. The Kyoto Protocol. 2015a [Accessed on 02 mar 2017] Available at World Wide Web: <http://www.mma.gov.br/clima/ convencao-das-nacoes-unidas/protocolo-de-quioto.
BRAZIL. Ministry of Mines and Energy. Decennial energy expansion plan 2024. Empresa de Pesquisa Energética. Brasília, Brazil: MME/EPE, 2015b.
BRAZIL. Ministry of Mines and Energy.2030 National Energy Plan. Brasília, Brazil: MME, 2007.
BRAZIL. National Agency of Eletrical Power. 2016 [Accessed on 03 apr 2016] Available at World Wide Web: <http://www2.aneel.gov.br/aplicacoes/ capacidadebrasil/Operacao
CapacidadeBrasil.cfm>.
BRAZIL. National Agency of Eletrical Power. Resolução nº 482 de 2012 [Accessed on 27 apr 2017] Available at World Wide Web: <http://www2.aneel. gov.br/cedoc/
ren2012482.pdf>.
BRUCKNER, T. et al. Energy Systems. Climate Change 2014: Mitigation of Climate Change. Contribution of Working Group III to the Fifth Assessment Report of the Intergovernmental Panel on Climate Change [Edenhofer, O., R. Pichs-Madruga, Y. Sokona, E. Farahani, S. Kadner, K. Seyboth, A. Adler, I. Baum, S. Brunner, P. Eickemeier, B. Kriemann, J. Savolainen, S. Schlömer, C. von Stechow, T. Zwickel and J.C. Minx (eds.)]. Cambridge University Press, Cambridge, United Kingdom and New York, NY, USA.
CARVALHO, M., et.al. Life Cycle Analysis as a Decision Criterion for the Implementation of Solar Photovoltaic Panels in a Northeast Brazil Hospital. In: Global Conference on Global Warming, 10., Athens, Greece, 2015.
CARVALHO, M., et al. Promotion of sustainability by quantifying and reducing the carbon footprint: new practices for organizations. Global Conference on Global Warming, 10., Athens, Greece, 2015.
CURSINO, A. Emissões de CO2 pela geração de eletricidade no Brasil superam em 2014 a previsão do governo para o ano de 2030, 2015 [Accessed on 02 mar 2017]. Available at World Wide Web: <http://www.mitsidi.com/emissoes-de- co2-pela-geracao-de-eletricidade-no-brasil-superam-em-2014-a-previsao-da-epe-para-o-ano-de-2030/?lang=pt-br >.
polygeneration system including photovoltaic solar energy and biomass: study case at a Northeast Brazil hospital. 2015. M.Sc. dissertation, Graduate Program in Renewable Energy, Center of Alternative and Renewable Energy, Federal University of Paraíba, Brazil.
ECOINVENT DATABASE, 2014 [Accessed on 02 mar 2017]. Available at World Wide Web: <http://www.ecoinvent.ch>..
FRAUNHOFER. 2017. Electricity generation in Germany in 2015 [Acessed on 25 apr 2017]. Available at World Wide Web: <https://www.energy-charts.de/ energy_pie.htm>.
GARSIDE, B. Brazil flags INDC of 2030 goal to cut GHGs 43% below 2005 levels. 2015 [Acessed on 02 mar 2017]. Available at World Wide Web: <http://carbon-pulse.com/brazil-flags-indc-of-2030-goal-to-cut-ghgs-43-below-2005-levels/>. GUINÉE, J.B. Life Cycle Assessment: An operational guide to the ISO Standards; LCA in Perspective; Guide; Operational Annex to Guide. Centre for Environmental Science, Leiden University, The Netherlands, 2001.
GUINÉE, J.B. Handbook on life cycle assessment: operational guide to the ISO standards. Kluwer Academic Publishers, Boston, 2002.
ISO 14040. Environmental management - Life cycle assessment - Principles and framework. International Organization for Standardization (ISO), Geneva, 2006.
ISO 14044. Environmental management - Life cycle assessment - Requirements and guidelines. International Organization for Standardization (ISO), Geneva, 2006.
MCKINSEY & COMPANY. Pathways to a low carbon economy in Brazil.Report. 2009 [Accessed on 02 mar 2017] Available at World Wide Web: http://www. mckinsey.com
/~/media/mckinsey/dotcom/client_service/infrastructure/pdfs/pathways_low_ carbon_economy_brazil.ashx>.
MEDEIROS, D.L. et al. Inconsistências Metodológicas em Estimativas de Emissões de Gases do Efeito Estufa na Matriz Elétrica Brasileira. 4th International Workshop Advances in Cleaner Production. São Paulo: USP, 2013. MIRANDA, M.M. Fator de emissão de gases de efeito estufa na geração de energia elétrica no Brasil: implicações da aplicação da Avaliação do Ciclo de Vida. Dissertação de mestrado, Programa de Pós-Graduação em Ciências da
Engenharia Ambiental, Escola de Engenharia de São Carlos da Universidade de São Paulo, 2012.
ONS, 2016. Operador Nacional do Sistema Elétrico. Informativo Diário de Operação. IPDO 2016 [Accessed on 27 apr 2017]. Available at World Wide Web: <https:// http://www.ons.org.br/publicacao/ipdo/>.
PEREIRA, E. et al. Brazilian Atlas of Solar Energy, São José dos Campos-SP, INPE, 2006, 60 p. [Accessed on 02 mar 2017] Available at World Wide Web: <http:// www.ccst.inpe.br/wp-content/themes/ccst-2.0/pdf/atlas_solar-reduced.pdf>. Préconsultants.SimaPro software, 2015 [Accessed on 02 mar 2017]. Available at World Wide Web: <http://www.simapro.nl>.
REIS, B.L. Geração de Energia Elétrica, 2. Ed, p.14, Baruri-SP, Manole 2011. SEEG. Evolução das emissões de gases de efeito estufa no Brasil (1970-2013): setor de energia e processos industriais. São Paulo: Observatório do Clima, 2015.
SETAC - Society of Environmental Toxicology and Chemistry. Guidelines for Life-cycle Assessment: A Code of Practice. In: SETAC workshop, Brussels, 1993. Belgium: SETAC, 1993.
TURCONI, R. et al,. Life cycle assessment (LCA) of electricity generation technologies:Overview, comparability and limitations. Renewable and Sustainable Energy Reviews 2013, v. 28, p. 555-565.
UDO DE HAES, H.A. (ed.). Life-cycle impact assessment: Striving towards best practice. Published by the Society of Environmental Toxicology and Chemistry (SETAC). Pensacola, USA.
VAHL, F. P. Avaliação dos Impactos Ambientais e no Mercado da Trajetória Tecnológica Contemporânea para Geração de Eletricidade no Brasil. 2014. PhD Thesis,Graduate Program in Production Engineering, Universidade Federal de Santa Catarina.
UNFCCC – United Nations Framework Convention on Climate Change. A summary of the Kyoto Protocol. 2014 [Accessed on 02 mar 2017]. Available at World Wide Web: <http://unfccc.int/kyoto_protocol/background/items/2879. php>.
UNFCCC - United Nations Framework Convention on Climate Change.Full Text of the Convention.1998 [Accessed on 02 mar 2017]. Available at World Wide Web:< http://unfccc.int/resource/docs/convkp/kpeng.pdf >.
WORLD BANK. Brazil Low-carbon Country Case Study. 2010 [Accessed on 02 mar 2017]. Available at: World Wide Web: <http://siteresources.worldbank. org/