UNIVERSIDADE DA BEIRA INTERIOR
Ciências da saúde
Identificação de genes diferencialmente
expressos no cancro da mama
Vânia Isabel Gonçalves Pereira Dos Reis
Dissertação para a obtenção do Grau de Mestre em
Ciências Biomédicas
(2º Ciclo de estudos)
Orientador: Prof. Doutor Cláudio Maia
Co-orientador: Prof. Doutora Sílvia Socorro
ii
Agradecimentos
Gostaria de agradecer ao meu orientador, o Professor Doutor Cláudio Maia pela constante disponibilidade e acompanhamento, como também pelos bons conselhos e críticas dadas ao longo da realização deste trabalho.
Agradeço, também, à minha co-orientadora, a Professora Doutora Sílvia Socorro por todas as críticas construtivas referentes a este trabalho.
Um especial agradecimento à Eduarda Coutinho por toda a ajuda que me prestou relativa à técnica de sequenciação e por todos os bons conselhos que sempre me deu.
Gostaria também de agradecer a todos os meus colegas de laboratório que direta ou indiretamente participaram e ajudaram na realização deste trabalho.
Um grande obrigado às grandes amigas Filipa Patriarca e Tânia Dias por toda a ajuda prestada dentro e fora do laboratório e um forte agradecimento aos meus amigos, Cláudia Reis, Vanessa Rei, Tânia Duarte, Joana Sousa, Vânia Vieira, Sofia Marques, Barbara Campos, Tiago Matos, Miguel Bacalhau e Vasco Marcos pela força, bons conselhos e amizade sempre demonstrados.
Gostaria, também, de agradecer ao meu namorado, Carlos Vilas Boas, por todo o apoio e força que me prestou nas alturas mais difíceis.
Um obrigado à minha família, principalmente aos meus pais e irmão, por todo o apoio que me proporcionaram em todas as situações da minha vida e por toda a coragem que sempre me deram para conseguir atingir os meus objetivos.
iii
Resumo
O cancro da mama abrange tumores bastante heterogéneos que têm não só diferentes características clínicas como também diferentes progressões e respostas a tratamentos específicos. Para além disso, o cancro da mama resulta principalmente de alterações genéticas e epigenéticas de células da glândula mamária. A identificação de novos genes diferencialmente expressos no cancro da mama permite a compreensão da biologia da tumorigénese da mama e a identificação de novos biomarcadores ou alvos terapêuticos. O objetivo deste trabalho foi identificar genes diferencialmente expressos no cancro da mama. Neste estudo, foi utilizada a técnica da hibridação subtrativa para gerar dois bancos subtrativos, cada um com 96 clones, os quais foram, posteriormente, digeridos pela enzima EcoRI, e foram sequenciados todos os plasmídeos que continham insert. Todos os resultados foram analisados usando o programa Blast e a base de dados GeneBank, identificando-se 37 genes como sendo sobre-expressos e 17 como sub-expressos na linha celular MCF7. Embora alguns destes genes já tenham sido identificados como diferencialmente expressos no cancro da mama, foram encontrados alguns novos genes como diferencialmente expressos nas células MCF7. Estes novos genes podem vir a ser usados como biomarcadores do cancro da mama, ou então, utilizados como possíveis alvos terapêuticos no cancro da mama.
Palavras-chave
iv
Resumo Alargado
O cancro é considerado uma das grandes ameaças à saúde pública em todo o mundo, sendo o cancro da mama a neoplasia maligna mais comum entre as mulheres e a segunda principal causa de morte por cancro entre as mulheres. Em Portugal, o cancro da mama é o tipo de cancro mais comum no sexo feminino, com cerca de 4500 novos casos diagnosticados anualmente. Este tipo de cancro é uma doença heterogénea, que apresenta diferentes características biológicas e clínicas. Os carcinomas da mama resultam principalmente da acumulação de alterações genéticas, como mutações, rearranjos e variações no número de cópias de alguns genes e alterações epigenéticas, como a metilação do promotor e modificação das histonas, em células epiteliais da glândula mamária. Os tumores da mama podem ser classificados em várias categorias, com base nas suas características clínicas, a expressão de marcadores tumorais - recetor de estrogénio (ER), recetor de progesterona (PR) e fator de crescimento humano epidermal-2 (HER-2) - e o seu tipo histológico. O cancro da mama pode então ser classificado como cancro da mama invasivo ou in situ. Relativamente à classificação dos tipos moleculares podem ser classificados como luminal A, luminal B, HER-2+, tipo basal e o tipo normal. Existem vários fatores de risco que estão associados a este tipo de cancro, como o estilo de vida e fatores genéticos. Além dos fatores genéticos e reprodutivos, o risco de cancro de mama apresenta uma grande variação étnica e geográfica. Além disso, a dieta alimentar, falta de atividade física, consumo de álcool, a idade da menarca e da menopausa são fatores de risco associados ao desenvolvimento de cancro da mama. A descoberta dos genes BRCA1 e 2, em meados dos anos 90, realçou a importância dos fatores genéticos como causa deste tipo de cancro. Estes fatores podem aumentar substancialmente o risco de contrair cancro de mama e estão associados com o desenvolvimento deste tipo de cancro numa idade jovem. Cerca de 10% dos casos de cancro da mama em países ocidentais é devido a predisposição genética. Outro fator importante é a presença ou não dos recetores de hormonas (ER, PR e HER-2). As mais promissoras descobertas revelam que o ER e o HER-2 podem responder a terapias hormonais, como por exemplo o tamoxifeno e o trastuzumabe, respetivamente. A identificação de genes diferencialmente expressos no cancro da mama tem importantes implicações na compreensão dos processos biológicos deste tipo de cancro, podendo estes seremúteis para o rastreio e diagnóstico do cancro, assim como o desenvolvimento de novas estratégias terapêuticas para o cancro da mama. A identificação de novos genes diferencialmente expressos em tumores da mama irá ajudar a encontrar marcadores específicos para o tratamento e diagnóstico desta doença. Uma das tecnologias usadas para encontrar genes diferencialmente expressos é a hibridação subtrativa (SSH). Este método permite a amplificação seletiva do cADN alvo e, simultaneamente suprime a amplificação de cADN não-alvo. Como resultado, a banco de cADN gerado por SSH contém um elevado número de genes diferencialmente expressos no cancro da
v mama. A identificação de alterações nos padrões de expressão genética em células cancerosas é essencial para o diagnóstico precoce e para a identificação de possíveis alvos terapêuticos. Consequentemente, o objetivo deste estudo foi identificar genes diferencialmente expressos nas células MCF7 de cancro da mama. Para tal, foram gerados dois bancos subtrativos, cada um com 96 clones, que foram posteriormente submetidos a uma digestão pela enzima EcoRI. De entre todos os clones, foram sequenciados 70 de cada banco, uma vez que eram estes que continham insert. Para fazer a identificação dos clones as sequências foram analisadas usando o programa Blast. De seguida, os genes foram agrupados de acordo com as suas funções. Foram identificados 37 genes sobre-expressos e 17 sub-expressos nas células MCF7 de cancro da mama. Alguns destes genes já foram identificados como sendo sobre-expressos (CD24, KRT18, USP32 e DNMT1) e sub-expressos (WISP1, CELSR2, GSN e LALBA) no cancro da mama. Também foram encontrados genes que ainda não foram descritos como sobre-expressos neste tipo de cancro, como por exemplo MTRNR2L 2, MTRNR2L 8, TMPRSS13, RPS25 e LARP1. Para além destes, foram também identificados, pela primeira vez, genes sub-expressos no cancro da mama, tais como CSN1S1, CSN2, CSN3 e OAS1. Este trabalho permitiu a identificação de novos genes diferencialmente expressos no cancro da mama, e que no futuro podem vir a ser usados como possíveis biomarcadores, indicadores de prognóstico, ou utilizados como novos alvos terapêuticos.
vi
Abstract
Breast cancer comprises heterogeneous tumors with different clinical characteristics, disease courses, and responses to specific treatments. Moreover, breast carcinomas result mainly from the accumulation of genetic and epigenetic alterations in epithelial cells of mammary gland. The identification of novel genes differentially expressed in breast cancer has important implications in understanding the molecular mechanisms underlying breast tumorigenesis, and developing new diagnostic and therapeutic targets. Therefore, the aim of this work was to identify genes differentially expressed in the breast cancer MCF7 cells, and to confirm its differential regulation in breast cancer. In this study, we used the suppressive subtractive hybridization technique to generate two subtractive libraries with 96 clones each, which were subsequently digested with EcoRI and then, all the plasmids with insert were sequenced. These results were further analyzed by Blast tool and GeneBank. We identify 36 genes as overexpressed and 19 genes as underexpressed in MCF7 cells. Some of these genes were previously identified as over- or underexpressed in breast cancer; however we found several genes that haven’t yet been described as up or down-regulated in MCF7 cell line. In the future, these novel genes may be used as possible biomarkers, diagnostic markers or therapeutic targets in breast cancer.
Keywords
Breast cancer; genes differentially expressed; suppressive subtractive hybridization; DNA sequencing
vii
Table of Contents
Introduction ... 1
1. Overview... 2
2. Breast anatomy and physiology ... 3
3. Breast cancer ... 6
3.1. Classification ... 6
3.1.1. Histological types... 6
3.1.2. Molecular types ... 7
3.2. Epidemiology and Risks factors ... 9
3.2.1. Lifestyle/Behavior and diet ... 9
3.2.2. Family history and genetic causes ... 11
3.2.2.1. BRCA1 ... 11
3.2.2.2. BRCA2 ... 12
3.3. Hormone Receptor Status ... 13
3.3.1 Estrogen receptor (ER) ... 13
3.3.2 Progesterone receptor (PR) ... 14
3.3.3 Human epidermal growth factor-2 (HER-2) ... 14
4. Genes differentially expressed in breast cancer ... 16
5. Aim of the study ... 19
Materials and Methods ...20
1. Cell lines ... 21
2. Supressive subtractive hybridization (SSH) ... 21
3. Cloning into pGEM-T easy vector ... 21
4. Digestion with the restriction enzyme EcoRI ... 22
5. DNA Sequencing ... 22
6. Sequence analysis ... 23
Results and Discussion ...24
1. Identification of clones with insert ... 25
2. DNA sequencing of the inserts and identification of the respective genes... 25
Conclusion and Future Perspectives ...41
References ...43
viii
List of Figures
Figure 1 - The structure of the breast and mammary glands - a sagittal section ... 3
Figure 2 - The structure of the breast and mammary glands - an anterior view ... 4
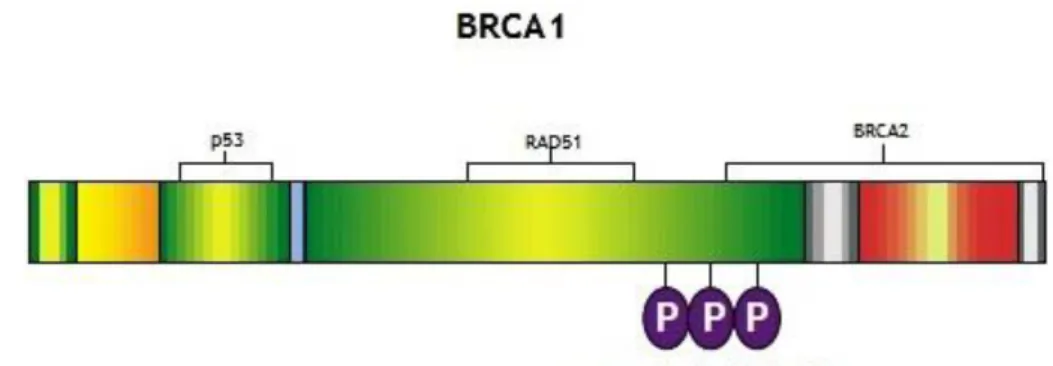
Figure 3 - BRCA1 protein ... 12
Figure 4 - BRCA2 protein ... 12
Figure 5 - Enzymatic digestion of the FW clones E3 to E12... 25
ix
List of Tables
Table 1 – Summary of main up-regulated genes in human breast tumors and its biological
function ... 17
Table 2 – Summary of main down-regulated genes in human breast tumors and its biological function ... 18
Table 3 – Total number of clones with insert in forward and reverse libraries ... 25
Table 4 – Identified up-regulated genes and its primary biological function ... 27
x
List of Acronyms
ATM – Ataxia telangiectasia mutated BRCA1 – Breast cancer gene 1 BRCA2 – Breast cancer gene 2 CHK2 – Checkpoint kinase 2 CIS – Carcinoma in situ
DCIS – Ductal carcinoma in situ
EGFR – Epidermal growth factor receptor ER – Estrogen receptor
ERα – Estrogen receptor alpha ERβ – Estrogen receptor beta FSH – Follicle-stimulating hormone GnRH – Gonadotrophin-releasing hormone HCC – Hepatocellular carcinoma
HER-2 – Human epidermal growth factor-2 HGF – Hepatocyte growth factor
HN - Humanin
IDC-NOS – Invasive breast carcinoma-not otherwise specified IDC-NST – invasive breast carcinoma of no special type KRT – Cytokeratin
LCIS – Lobular carcinoma in situ LH – Luteinizing hormone
MSPL – Mosaic serine protease large form MUC-1 – Mucine 1
p53 – Tumor protein 53 Pg – Progesterone
PR – Progesterone receptor PRA – Progesterone receptor A PRB – Progesterone receptor B
xi
PRL – Prolactin
PTEN – Phosphate and tensin homolog
RAD51 – DNA repair protein RAD51 homolog 1 SAGE – Serial analysis of gene expression SSH – Suppressive subtractive hybridization
STAT1 – Signal transducer and activator of transcription 1 TK - Tyrosine kinase
Chapter I
Introduction
2
1. Overview
Cancer is a major public health problem in the United States and many other parts of the world (Siegel et al., 2012), being breast cancer the most common malignancy among women (DeSantis et al., 2011). There are several risk factors that are involved in this type of cancer, such as lifestyle and genetic factors (Hadjisavvas et al., 2010).
In the past decade, various methods of gene expression have been described, including serial analysis of gene expression (SAGE) (Nacht et al., 1999; Wu et al., 2010), differential screening (Kuang et al., 1998), suppressive subtractive hybridization (SSH) (Kuang et al., 1998; Yang et al., 1999; Jiang et al., 2002) and microarray techniques (Yang et al., 1999; Jiang et al., 2002; Chen et al., 2008; Selga et al., 2009). These techniques also generated information about the differences and similarities of expression profiles in primary and metastatic breast tumors. For example, combining SAGE and array technology have allowed a rapid identification and validation of the clinical relevance of many genes potentially involved in breast cancer progression (Nacht et al., 1999).
The study of genes involved in the development and progression of breast cancer is of the major importance, mostly because it could be useful to discover new important markers of breast cancer, which could also serve as therapeutic targets for chemotherapy and immunotherapy, and to develop more specific treatments for this cancer. Moreover, identify alterations in gene expression in cancer cells is crucial to the development of more efficient techniques for early diagnosis and for the understanding of the biology of breast tumorigenesis (Jiang et al., 2002).
3
2. Breast anatomy and physiology
The breasts are the most prominent superficial structures in the anterior thoracic wall (Moore
et al., 2006). Each breast extends vertically from the second to the sixth rib, and in the
transverse plane, from the sterna edge, medially, almost to the midaxillay line laterally. The superolateral quadrant is prolonged towards the axilla along the inferolateral edge of the pectoralis major, from which it projects a little, and may extend through the deep fascia up to the apex of the axilla (Figure 1) (Standring 2010). The axillary process of the breasts extends upward and laterally toward the axilla, where it comes into close relationship with the axillary vessels. This region of the breast is clinically significant because of the high incidence of breast cancer within the lymphatic drainage of axillary process (Van De Graaff 2002).
Internally, the breast contains glandular tissue, fibrous connective tissue, surrounding the glandular tissue and the interlobar adipose tissue (Standring 2010). Each mammary gland is composed of 15 to 20 lobes, each with its own drainage pathway to the outside. The lobes are separated by varying amounts of adipose tissue. Each lobe is subdivided into lobules that contain the glandular mammary alveoli, which produce milk of a lactating female (Van De Graaff 2002). Breast size is determined by the amount of adipose tissue and has no relationship to the amount of milk the mammary gland can produce (Saladin 2010). Suspensory ligaments between the lobules extend from the skin to the deep fascia overlying
Figure 1 - The structure of the breast and mammary glands - a sagittal section of a mammary gland
4 the pectoralis major muscle and support the breasts. The clustered mammary alveoli secret milk into a series of mammary ducts that converge to form lactiferous ducts. The lumen of each lactiferous duct expands near the nipple to form a lactiferous sinus. Milk is stored in the lactiferous sinuses before draining at the tip of the nipple (Figure 2).
The nipple is a cylindrical projection from the breast that contains some erectile tissue (Van De Graaff 2002). Its shape varies from conical to flattened, depending on nervous, hormonal, developmental and others factors. Internally, the nipple is composed mostly of collagenous dense connective tissue with numerous elastic fibers. Smooth muscle cells are also present in and just deep to the nipple, disposed in a predominantly circular direction and radiating out from its base into the surrounding breast (Standring 2010). A circular pigmented areola surrounds the nipple. The surface of the areola may appear bumpy because of the sebaceous areolar glands close to the surface. The secretions of these glands keep the nipple pliable. The color of the areola and nipple varies with the complexion of the woman. During pregnancy, the areolar becomes darker in most women, and enlarges somewhat, presumably to become more conspicuous to a nursing infant (Van De Graaff 2002).
The venous drainage of the breast is mainly to the axillary vein, but there is some drainage to the internal thoracic vein. The lymphatic drainage of the breast is important because of its role in the metastasis of cancer cells. Lymph passes from the nipple, areola and lobules of the gland to the subareolar lymphatic plexus (Moore et al., 2006).
The mammary gland undergoes dramatic tissue remodeling events in response to hormonal stimuli, primarily by estrogens and progesterone (Pg), during puberty and pregnancy (Richert
et al., 2000; Lee and Ormandy 2012). Puberty is controlled by the
hypothalamus-pituitary-Figure 2 - The structure of the breast and mammary glands - an anterior view partially sectioned
5 ovary axis and it begins with the first release of gonadotrophin-releasing hormone (GnRH). GnRH regulates the secretion of two gonadotropin hormones – luteinizing hormone (LH) and follicle-stimulating hormone (FSH) from the pituitary. Both hormones act on the ovarian follicular cells and induces the production of estrogens and Pg (Van De Graaff 2002; Boron and Boulpaep 2008). Estrogens and growth hormone drive the elongation of the mammary ductal network during puberty (Lee and Ormandy 2012). During pregnancy, gradual increases in levels of prolactin (PRL) as well as very high levels of estrogens and Pg, lead to a full development of the breasts (Boron and Boulpaep 2008) and the co-operation of Pg and PRL during pregnancy stimulate the formation of alveolar structures that produce milk post-partum (Lee and Ormandy 2012). In particular, estrogens stimulates the growth of milk ducts; Pg plays a critical role in inducing ductal side branching of the mammary gland (Atwood et
al., 2000), which is essential for lobuloalveolar development during pregnancy (Lee and
Ormandy 2012) and, at last, PRL promotes secretion of milk from mammary glands (Boron and Boulpaep 2008).
The breast development (thelarche) can be divided into five separate phases: elevation of the breast bud (phase I); glandular subareolar tissue is present and both nipple and breast project from the chest wall as a single mass (phase II); the areola increases in diameter and becomes pigmented, and there is proliferation of palpable breast tissue (phase III); further pigmentation and enlargement occurs in the areola, so that the nipple and areola form a secondary mass anterior to the main part of the breast (phase IV); a smooth contour to the breast develops (phase V) (Standring 2010).
6
3. Breast cancer
Breast cancer is a heterogeneous disease, comprising numerous distinct entities that not only have different biological features (Weigelt et al., 2010) but also different clinical characteristics, disease courses, and responses to the specific treatments (Bertos and Park 2011). Moreover, breast carcinomas result mainly from the accumulation of genetic alterations, such as mutations, rearrangements and copy number variations and epigenetic alterations, such as promoter methylation and histone modification, in epithelial cells of mammary gland (Holm et al., 2010; Aboussekhra 2011). Classical pathology has segregated breast tumors into multiple categories (Bertos and Park 2011), based on its clinical features, its expression of tumor markers - estrogen receptor (ER), progesterone receptor (PR) and human epidermal growth factor-2 (HER-2) receptor status - and its histological type (Li et al., 2005).
3.1.
Classification
Breast cancers can be classified into biologically and clinically meaningful subgroups according to histological grade and histological type (Weigelt et al., 2010). The currently used system for histological grade is based on an assessment of three components, including proportion of tubule formation, nuclear pleomorphism (degree of differentiation) and mitotic index (proliferative activity) (Reis-Filho and Lakhani 2008). Histological type refers to the growth pattern of the tumors. There have been identified specific morphological and cytological patterns that were consistently associated with distinctive clinical presentations and outcomes. These patterns are called ‘histological types’ (Weigelt et al., 2010).
3.1.1. Histological types
Breast cancer can be subdivided in invasive and non-invasive cancer. Most tumors are derived from mammary ductal epithelium, mainly the terminal duct-lobular unit, and up to 75% of the diagnosed infiltrating ductal carcinoma (IDC) are defined as invasive ductal carcinoma, not otherwise specified (IDC-NOS) or of no special type (IDC-NST) (Yerushalmi et al., 2009), which is a diagnosis of exclusion and comprises adenocarcinomas that fail to exhibit sufficient characteristics to warrant their classification in one of the special types (Reis-Filho and Lakhani 2008). The second most common epithelial type is invasive lobular carcinoma which comprises of 5%–15% of the group (Yerushalmi et al., 2009). Breast cancer special types
7 account for up to 25% of all breast cancers and the latest edition of the World Health Organization classification recognizes the existence of at least 17 distinct histological special types (Weigelt et al., 2010), such as tubular carcinoma, invasive cribriform carcinoma, pure mucinous carcinoma, invasive solid papillary carcinoma, solid neuroendrocrine carcinoma – good prognosis typically ER-positive tumors; medullary carcinoma, secretory carcinoma, adenoid cystic carcinoma, acinic cell carcinoma – good prognosis typically ER-negative; small cell carcinoma, invasive miccropapillary carcinoma – poor prognosis typically ER-positive tumors; and finally metaplastic carcinoma and lipid rich carcinoma – poor prognosis typically ER-negative tumors (Yerushalmi et al., 2009). There has been shown a relationship between histological grade and type, so they provide complementary information (Rakha et al., 2008). Relatively to the non-invasive type, called breast carcinoma in situ (CIS), includes ductal carcinoma in situ (DCIS), lobular carcinoma in situ (LCIS), and other relatively rare forms of breast CIS, with DCIS being the predominant subtype. The term 'in situ' indicates that neoplastic cells are present but have not spread past the boundaries of ducts or lobules where the tumor initially developed. Unlike DCIS, LCIS indicates neoplastic changes in the breast lobules, a precursor lesion that carries an elevated risk of invasive lobular carcinoma. In contrast, DCIS and other forms of breast CIS are clinically considered pre-invasive lesions that can be associated with the development of invasive breast cancer at the same location in the breast where the CIS is located (Ma et al., 2010).
3.1.2. Molecular types
In the past decade, high-throughput microarray-based gene expression profiling has been extensively applied to the study of breast cancer to unravel the molecular underpinning of biological features such as metastatic propensity or histological grade, and to identify signatures associated with prognosis and response to therapy (Weigelt et al., 2010). Based on several studies on breast cancer cases, distinct molecular subtypes of breast carcinoma were identified with different clinical outcomes. Based on recent gene expression studies, Carey et
al. characterized five immunohistochemical subtypes as luminal A (ER+ and/or PR+, HER-2-),
luminal B (ER+ and/or PR+, HER-2+), HER-2+/ER- (ER-, PR-, HER-2+), basal-like (ER-, PR-, HER-2-, KRT5/6+) and normal breast-cancer (Carey et al., 2006). These molecular signatures have been shown to correlate with clinical features, such as survival, prognosis and treatment sensitivity.
Normal breast-like cancers have been shown to consistently cluster together with fibroadenoma and normal breast samples (Peppercorn et al., 2008). Tumors of this subtype are still poorly characterized and their clinical significance remains to be determined (Correa Geyer and Reis-Filho 2009).
8 Luminal tumors, both A and B, express hormone receptors, but these two luminal subtypes present distinguishing characteristics. Luminal A cancers have a high expression of ER and PR, HER-2-negative; including the highest proportion of stage I–II (75%) and well/moderately differentiated lesions (97%) (Zaha et al., 2010). Usually, this subtype shows a low histological grade (Weigelt et al., 2010) and presents the most favorable clinical features among the five subtypes. Luminal B tumors express HER-1 and HER-2 in addition to ER/PR and show less favorable clinical outcomes compared with luminal A tumors (Yang et al., 2007). Luminal B cases have shown poorly differentiated cancers, and they are more associated with higher histological grade (Weigelt et al., 2010).
The basal-like and HER-2 molecular subtypes are associated with an aggressive clinical behavior (Yang et al., 2007; Weigelt et al., 2010). Basal-like tumors are characterized by the expression of cytokeratin (KRT) 5/6 and KRT17 and are prevalent in patients with breast cancer gene 1 (BRCA1) mutations (Sorlie et al., 2003). Basal-like carcinomas are usually of high histological grade, have high mitotic indices, pushing borders, conspicuous lymphocytic infiltrate, typical/atypical medullary features and metaplastic areas (Fulford et al., 2006; Livasy et al., 2006; Reis-Filho et al., 2006). This subtype has been reported to be more prevalent in young women of African and Hispanic descent, to be associated with distinct risk factors and to show a high response rate to traditional chemotherapeutic treatments (Carey
et al., 2006; Rakha et al., 2008).
HER-2 cancers have high levels of HER-2 expression, with minimal expression of ER and PR (Zaha et al., 2010), and overexpressed genes associated with HER-2 pathway (Weigelt et al., 2010). The HER-2 array subtype is more likely to be high-graded and poorly differentiated, and more likely to involve axillary lymph nodes. Age of patients ranged from 37 to 68 years with a mean age of 52 years, and 80% were premenopausal (Zaha et al., 2010).
Unclassified cancers refer to negative triple tumors where the negative reaction for KRT5 is added; the prognostic of these tumors is slightly better than the basal subtypes (Zaha et al., 2010).
In the past years, at least 3 additional ER-negative molecular subtypes have been described: the ‘molecular apocrine’ group of tumors, which has been claimed by some to be similar to the HER-2 subtype and appears to have activation of the androgen receptor signalling (Farmer
et al., 2005; Doane et al., 2006); the ‘interferon’ subtype, which is characterized by high
expression of interferon regulated-genes, including STAT1 (signal transducer and activator of transcription 1) (Hu et al., 2006); and the ‘claudin-low’ subgroup, which comprises tumors that have transcriptomic features suggestive of a ‘cancer stem cell-like’ phenotype (Herschkowitz et al., 2007; Hennessy et al., 2009).
Special types of breast cancer account for up to one quarter of all invasive breast malignancies and their importance should not be disregarded. Understanding the biological
9 drivers of these entities may lead to a better understanding of the biology of breast cancer cells (Weigelt et al., 2010).
3.2. Epidemiology and Risks factors
Breast cancer is the most common malignancy among women, accounting for nearly 1 in 3 cancers diagnosed among women in the United States, and it is the second leading cause of cancer death among women (DeSantis et al., 2011). In Portugal, breast cancer is the most common type of cancer among women, with nearly 4500 cases per year (Pinheiro et al., 2003).
Numerous epidemiological studies over the last three decades have revealed a number of risk factors associated with breast cancer (Kelsey and Horn-Ross 1993; Lipworth 1995). In addition to genetic and reproductive factors, breast cancer risk displays wide ethnic and geographic variation (DeSantis et al., 2011). Within Europe the incidence varies by almost two-fold. It is highest in Northern European countries, with an estimated 84.6 cases per 100,000 population with intermediate rates recorded in Southern Europe and lowest rates occurring in Eastern Europe with 42.6 cases per 100,000 population (Parkin et al., 2005). Besides to the geographic variation, influences on incidence rates have also been attributed to differences in the use of mammography, diet, physical activity, body size, alcohol consumption and socioeconomic and reproductive factors (Key et al., 2001). The discovery of highly penetrant breast cancer susceptibility genes such as BRCA–1 and 2 - in the mid 1990’s (Miki et al., 1994; Wooster et al., 1995) emphasized the importance of genetic factors, but it is currently believed that environmental factors are of greater significance (Hadjisavvas et al., 2010).
3.2.1. Lifestyle/Behavior and diet
There are several factors that influence the risk of breast cancer development. Some of them are created by individual lifestyle and choices like diet, overweight, alcohol intake, age at first pregnancy and physical exercise (McPherson et al., 2000). There are others factors such as age at menarche and age at menopause, that influence the risk of breast cancer (Key et
al., 2001).
Migrational data have pointed to nutrition as one of the more relevant environmental factors involved: Japanese women in their home country have a comparatively small lifetime risk for breast cancer. However, after migration to the US, breast cancer incidence assimilates to the risk of Caucasian Americans within one or two generations, a finding which rules out genetic resistance to breast cancer development (Hanf and Gonder 2005). More recent studies have looked at other possible dietary determinants of risk, such as consumption of meat, fiber,
10 fruit and vegetables, and phytoestrogens. There may be a moderate protective effect for a high consumption of vegetables, but results for meat, fiber, and fruit have been inconsistent, and breast-cancer risk has not been shown to be lower in vegetarians than in non-vegetarians in more developed countries (Key et al., 2001). Although there is a close correlation between the incidence of breast cancer and dietary fat intake in populations, the true relation between fat intake and breast cancer does not appear to be particularly strong or consistent (McPherson et al., 2000). However, there has been much interest in the possibility that phytoestrogens, found at high concentrations in soya and some other foods, may block the effects of the vastly more potent endogenous estrogens and thereby reduce breast cancer risk. However, the results of studies are inconclusive (Key et al., 2001). Regardless of all this, obesity is associated with a twofold increase in the risk of breast cancer in postmenopausal women whereas among premenopausal women it is associated with a reduced incidence (McPherson et al., 2000).
Nulliparity and late age at first birth both increase the lifetime incidence of breast cancer. The risk of breast cancer in women who have their first child after the age of 30 is about twice that of women who have their first child before the age of 20. The highest risk group is those who have a first child after the age of 35; these women appear to be at even higher risk than nulliparous women. An early age at birth of a second child further reduces the risk of breast cancer (McPherson et al., 2000; Parsa and Parsa 2009).
Women who start menstruating early in life or who have a late menopause have an increased risk of developing breast cancer (McPherson et al., 2000). For each 1-year delay in menarche, the risk decreases by around 5%. There is also evidence that, although age at menarche is related to breast cancer risk at all ages, the effect may be stronger in younger (premenopausal) women. Women who experience menopause at a late age are at a higher risk of breast cancer than those who cease menstruating earlier, with risk increasing by about 3% for each year older at menopause (Key et al., 2001; Parsa and Parsa 2009). So, women who have a natural menopause after the age of 55 are twice as likely to develop breast cancer as women who experience the menopause before the age of 45. At one extreme, women who undergo bilateral oophorectomy - surgical removal of the ovaries - before the age of 35 have only 40% of the risk of breast cancer of women who have a natural menopause (McPherson et al., 2000).
The classic risk factors for breast cancer, such as age at menarche, age at menopause, and parity, are not amenable to change for the purpose of reducing risk. However, other behavioral risk factors (obesity, alcohol intake, physical exercise) could be modified and these changes could reduce the risk of breast cancer and would have other health benefits also (Key et al., 2001).
11
3.2.2. Family history and genetic causes
Genetic and familial factors can substantially increase the lifetime risk of developing breast cancer and are associated with the development of cancer at a young age (Amir et al., 2010). Up to 10% of breast cancer in Western countries is due to genetic predisposition. Breast cancer susceptibility is generally inherited as an autosomal dominant with limited penetrance. This means that it can be transmitted through either sex and that some family members may transmit the abnormal gene without developing cancer themselves (McPherson
et al., 2000), in others words most women with the disease do not have a family history of it,
and most women with affected relatives never develop breast cancer (Key et al., 2001). The evidence for genetic predisposition to breast cancer derives originally from observations of cancer clustering in families and cancer risk increasing in individuals with some genetically determined syndromes. Most studies on familial risk of breast cancer have found about two-fold relative risks for first-degree relatives (mothers, sisters, daughters) of affected patients (Pharoah et al., 1997). With affected second-degree relatives (grandmothers, aunts, grand-daughters), there is a lesser increase in risk (Key et al., 2001). Although 10–15% of breast cancer cases have some family history of the disease, only 5% can be explained by rare, highly penetrant mutations in genes such as BRCA1 and BRCA2 (Dunning et al., 1999). So far, at least five germline mutations that predispose to breast cancer have been identified or localized. These include mutations in the genes BRCA1, BRCA2, tumor protein 53 (P53), phosphatase and tensin homolog (PTEN), and ataxia telangiectasia mutated (ATM) (Clague et al., 2011). Two breast cancer genes, BRCA1 and BRCA2, which are located on the long arms of chromosomes 17 and 13 respectively, have been identified and account for a substantial proportion of very high risk families. Both genes are very large and mutations can occur at almost any position, so molecular screening to detect mutation for the first time in an affected individual or family is technically demanding (McPherson et al., 2000). Germline mutations in P53 predispose to the Li-Fraumeni cancer syndrome (including childhood sarcomas and brain tumors, as well as early-onset breast cancer) and those in PTEN are responsible for Cowden disease (of which breast cancer is a major feature) (Key et al., 2001).
3.2.2.1. BRCA1
BRCA1 was cloned in 1994 (Miki et al., 1994) and it is localized at chromosome 17q21 (Hall et
al., 1990). It is a large gene, with approximately 100kb that consists of 5592 base pairs
(Hofmann and Schlag 2000) in 22 exons, encoding a 220-kilodalton nuclear protein (Nathanson
et al., 2001). Studies suggest that BRCA1 accounts for the majority of families containing
multiple cases of breast and ovarian cancer, for less than half the families containing breast cancer only, and for few families that include male breast cancer cases (Ford et al., 1998). BRCA1 binds to BRCA2, P53, DNA repair protein RAD51 homolog 1 (RAD51) and many other
12 proteins involved in cell cycle and DNA-damage response (Scully and Livingston 2000) (Figure 3).
The involvement of BRCA1 in response to DNA damage is supported by extensive data, including evidence that BRCA1 is phosphorylated by the ATM and checkpoint kinase 2 (CHK2) proteins in response to DNA damage. Cells without functional BRCA1 do not arrest in G2 after DNA damage and are deficient in transcription-coupled repair. In addition, BRCA1 is part of the RAD50–MRE11–p95 complex, an essential component of recombination-mediated repair of DNA double-stranded breaks (Nathanson et al., 2001).
3.2.2.2. BRCA2
BRCA2 was cloned in 1995 (Wooster et al., 1995) and it is localized at chromosome 13q12.3 in 1994 (Wooster et al., 1994) and this gene is even larger than BRCA1, with a 10.3-kilobase including 27 exons encoding a 384-kilodalton nuclear protein (Hofmann and Schlag 2000) (Figure 4).
Figure 3 - BRCA1 protein. p53 and RAD51 binding site; P, serines phosphorylated by ATM in response
to DNA damage (adapted from (Nathanson et al., 2001))
13 The human tumor suppressor protein BRCA2 plays a key role in DNA repair (Barnes and Antoniou 2012). BRCA2 recruits RAD51 to sites of DNA damage through interaction with eight conserved motifs of approximately 35 amino acids, the BRC repeats (Figure 4). These motifs are highly conserved between mammalian species, and they confer upon BRCA2 the ability to bind RAD51 (Carreira and Kowalczykowski 2011). BRCA2 is also involved in maintaining genomic stability through its interaction with RAD51. Homologous recombination serves to maintain genomic integrity in somatic cells by promoting the repair of breaks in DNA strands. BRCA2 regulates RAD51 function in DNA repair by recruiting it to the sites DNA breaks (Carreira and Kowalczykowski 2011; Barnes and Antoniou 2012).
3.3. Hormone Receptor Status
3.3.1 Estrogen receptor (ER)
Estrogen is an important regulator of growth and differentiation in the normal mammary gland and is also important in the development and progression of breast carcinoma (Gruvberger et al., 2001). The estrogen signal is mediated by the ER, which is a transcription factor belonging to the steroid hormone receptor superfamily. There are two types of ER: ER-α and ER-β and they are encoded by two different genes, ESR1 on chromosome 6 and ESR2 on chromosome 14q, respectively (Herynk and Fuqua 2004). Both ER-α and ER-β proteins are expressed in normal breast luminal epithelial cells as well as in breast tumors (Yu et al., 2011). ERα is expressed in approximately 15–30% of luminal epithelial cells (Anderson 2002). In general, nuclear receptors have a modular structure with six distinct regions, A-F. Of these, region C (corresponding to the DNA-binding domain) and region E (corresponding to the ligand-binding domain) are evolutionally conserved (Mosselman et al., 1996). Although the two ERs are homologous in their DNA-binding and steroid binding domains, the ERβ gene is smaller and it encodes a shorter protein (Anderson 2002).
ERα and ERβ have been demonstrated to form heterodimers, as well as homodimers, further complicating their individual and/or combined function within a cell. Although both receptors bind estrogen with similar affinities, ERβ appears to have a stronger affinity for phytoestrogens (Herynk and Fuqua 2004).
The most promising findings revels that ERα is a very strong predictive factor for response to hormonal therapies, such as tamoxifen. Tamoxifen, which binds ERα and blocks estrogen-stimulated growth, has been shown to significantly reduce disease recurrence and prolong life in patients with ERα-positive invasive breast cancers (EBCTCG 2005). The clinical response to newer types of hormonal therapies, such as the aromatase inhibitors, which suppress the
14 production of estrogen, is also dependent on the status of ERα, and only positive tumors benefit (Buzdar et al., 2004; Howell et al., 2005). The primary reason for assessing ERα is its ability to predict response to these hormonal therapies (Allred 2010).
3.3.2 Progesterone receptor (PR)
Progesterone has two receptors, progesterone receptor A (PRA) and PRB. These two receptors are transcribed from the same gene, that is located on chromosome 11q13 (Law et al., 1987). PRB is longer than PRA as it contains an additional 164 amino acids at its N-terminal, but otherwise the two proteins are identical (Clarke and Sutherland 1990). PRA and PRB are also members of the steroid hormone nuclear receptor superfamily, and they function as ligand-dependent nuclear transcription factors. PRA as well as PRB can activate gene transcription. Once expressed, PR is activated by the hormone progesterone to help regulate several important normal cellular functions, including proliferation which, of course, is detrimental in breast cancers. ERα regulates the expression of PR; hence, the presence of PR usually indicates that the estrogen-ERα pathway is intact and functional (Anderson 2002; Clarke 2003; Jacobsen et al., 2003).
There are few studies in the medical literature for PR (Elledge et al., 2000; Love et al., 2002; Mohsin et al., 2004; Viale et al., 2008). Those available show that PR is expressed in the nuclei of 60–70% of invasive breast cancers, that there is a direct correlation between PR levels and response to hormonal therapies, and that tumors with even very low levels of PR-positive cells (≥1%) have a significant chance of responding (Love et al., 2002; Mohsin et al., 2004; Allred 2010).
3.3.3 Human epidermal growth factor-2 (HER-2)
The human epidermal growth factor (HER) family of transmembrane receptors are potent mediators of normal cell growth and development (Hynes and Lane 2005). This family of receptors consists of four closely related type 1 transmembrane tyrosine kinase receptors: HER1 (EGFR), HER-2, HER3 and HER4. Each receptor comprises an extracellular domain where ligand binding occurs, an a-helical transmembrane segment and an intracellular protein tyrosine kinase (TK) domain (Baselga 2010).
HER-2 (also referred to as HER-2/neu and erbB2) is a proto-oncogene located on chromosome 17 (Coussens et al., 1985). It encodes a TK receptor residing on the surface membrane of breast epithelial cells (Schechter et al., 1984). HER-2 regulate many normal cellular
15 functions, including proliferation, survival, and apoptosis (Harari and Yarden 2000; Menard et
al., 2000; Allred 2010).
HER-2 overexpression occurs in 15%–20% of patients with breast cancer and is associated with aggressive disease and decreased survival (Baselga 2010; Chang 2010). There is a weak but significant association between poor outcome and amplified and/or overexpressed HER-2 in patients receiving no additional therapy after initial surgery (Allred and Swanson 2000). However, most patients receive some type of adjuvant therapy, and the association between HER-2 status and outcome seems to depend on the type of therapy.
The most promising and useful findings come from recent studies showing that HER-2-positive tumors respond favorably to new antibody-based therapies, which specifically target the HER-2 protein, such as trastuzumab (Engel and Kaklamani HER-2007) and the main reason for assessing HER-2 status is to identify candidates for targeted therapy. Although trastuzumab was originally demonstrated as being effective in HER-2-positive metastatic disease, more recent clinical trials have demonstrated significant benefit as adjuvant therapy for women with less advanced HER-2-positive breast cancer (Allred 2010).
16
4. Genes differentially expressed in breast
cancer
Identifying novel and known genes that are differentially expressed in breast cancer has important implications in understanding of the biological processes of breast cancer and in discovering cDNAs that encode proteins that could be useful for cancer screening and diagnosis; with the purpose of develop more specific treatment strategies for breast cancer (Jiang et al., 2002; Zheng and Pepe 2007).
Genetic alterations resulting in altered mRNA and protein levels have been described in breast tumorigenesis, such as the activation or amplification of oncogenes or the loss of tumor suppressor genes. Historically, a number of these genes have been identified such as HER-2, a surface growth factor receptor shown to be overexpressed in 15-20% of breast cancers. The p53 gene that normally functions as a tumor suppressor gene has been found to be overexpressed in 57% of breast tumors as an outcome of gene mutation and changes in protein stabilization. Mucine-1 (MUC-1) is another gene that is up-regulated about 10-fold in 90% of breast tumors. Each of these proteins has become the target for novel immunotherapy approaches in the treatment of breast cancer. Identifying additional genes that may be up- or down-regulated in breast tumors will help to find additional markers for treatment and diagnosis of the disease (Jiang et al., 2002).
One of the technologies used to find these genes is the suppression subtractive hybridization (SSH), also known as PCR-based cDNA subtraction, that was developed by (1996). This method allows selective amplification of target cDNAs, while simultaneously suppressing non-target cDNA amplification. An advantage of the PCR-based cDNA subtraction method is that in addition to the recovery of abundant clones regularly obtained by conventional cDNA subtraction, rare transcripts are also recovered due to the incorporated hybridization and PCR steps that normalize sequence abundance. As a result, the subtracted cDNA library generated by SSH technology contains an increased number of differentially expressed genes (Diatchenko et al., 1996).
There are several studies in the identification of genes differentially expressed in breast cancer, and each study identifies quite a lot of genes that are expressed in this type of cancer. It is in this context that it was made a brief summary of some up- (Table 1) and down-regulated genes (Table 2), which had already been studied, in breast tumors (Kuang et
al., 1998; Nacht et al., 1999; Yang et al., 1999; Jiang et al., 2002; Chen et al., 2008; Hicks et al., 2012).
17
Table 1 – Summary of main up-regulated genes in human breast tumors and its biological function
Gene name Acronym Accession number Biological Function Reference
Fibroblast growth factor 1 FGF-1 NM_001257211 [GO:0001525] Angiogenesis (Nacht et al., 1999)
Serine/threonine-protein phosphatase 2A regulatory
subunit B beta isoform PPP2R2B NM_181678 Apoptosis
[GO:0006915]
(Hicks et al., 2012) WW domain-containing
oxidoreductase WWOX NM_016373 (Hicks et al., 2012)
CD24 molecule CD24 NM_013230.2
Cell adhesion [GO:0007155]
(Yang et al., 1999)
Fibronectin FN NM_212478 (Jiang et al., 2002)
Ephrin type-A receptor 4 HEK8 NM_004438 (Kuang et al., 1998)
Intercellular adhesion
molecule 1 ICAM1 NM_000201 (Hicks et al., 2012)
Mucin-1 MUC-1 NM_001204296 (Nacht et al., 1999)
Reelin RELN NM_005045 (Hicks et al., 2012)
DNA-3-methyladenine
glycosylase MPG NM_002434 [GO: 0007049] Cell cycle (Nacht et al., 1999)
Keratin, type I cytoskeletal
19 KRT19 NM_002276 [GO:0005856] Cytoskeleton
(Nacht et al., 1999; Yang et al., 1999; Jiang et al., 2002)
Bloom syndrome protein BLM NM_000057
DNA replication [GO:0006260]
(Hicks et al., 2012) Replication protein A 32 kDa
subunit RPA2 NM_002946 (Hicks et al., 2012)
Zinc-alpha-2-glycoprotein AZGP1 NM_001185 Immune
response [GO:0006959]
(Nacht et al., 1999) Deleted in malignant brain
tumors 1 protein DMBT1 NM_017579 (Hicks et al., 2012)
Matrix metallopeptidase 8 MMP8 NM_002424
Metabolic process [GO:0008152]
(Hicks et al., 2012)
Matrix metallopeptidase 15 MMP15 NM_002428 (Nacht et al., 1999)
Tripartite motif-containing
protein 45 TRIM45 NM_025188 (Hicks et al., 2012)
Insulin-like growth factor 1
receptor IGF1R NM_000612 Protein binding [GO:0005515] (Hicks et al., 2012)
Heat shock protein beta-1 Hsp27 NM_001540
Response to stress
[GO:0006950] (Kuang et al., 1998)
Trans-acting T-cell-specific
transcription factor GATA-3 GATA-3 NM_001002295
Transcription [GO:0006351]
(Yang et al., 1999) Receptor tyrosine-protein
kinase erbB-2 HER-2 NM_001005862 (Nacht et al., 1999)
High mobility group protein
18
Gene name Acronym Accession number Biological Function Reference
Eukaryotic translation
elongation factor 1 alpha 2 EEF1A2 NM_001958.2| [GO:0006412] Translation (Kuang et al., 1998)
Table 2 – Summary of main down-regulated genes in human breast tumors and its biological function
Gene name Acronym Accession number Biological Function Reference
Caspase-8 CASP8 NM_001228
Apoptosis [GO:0006915]
(Hicks et al., 2012)
Galectin-7 LGALS7 NM_002307 (Nacht et al., 1999)
Dystonin DST NM_001723
Cell adhesion [GO:0007155]
(Nacht et al., 1999)
Thrombospondin-1 THBS1 NM_003246 (Nacht et al., 1999)
DNA-(apurinic or apyrimidinic
site) lyase APEX1 NM_080649
Cell cycle [GO: 0007049]
(Hicks et al., 2012) Histone-lysine
N-methyltransferase EHMT2 EHMT2 NM_006709 (Hicks et al., 2012)
DNA repair protein
complementing XP-G cells ERCC5 NM_000123 (Hicks et al., 2012)
Methylated-DNA--protein-cysteine methyltransferase MGMT NM_002412 (Hicks et al., 2012)
DNA mismatch repair protein
Msh2 MSH2 NM_000251 (Hicks et al., 2012)
DNA mismatch repair protein
Msh6 MSH6 NM_000179 (Hicks et al., 2012)
DNA-dependent protein kinase
catalytic subunit PRKDC NM_006904 (Hicks et al., 2012)
Retinoblastoma-associated
protein RB1 NM_000321 (Hicks et al., 2012)
DNA repair protein
complementing XP-A cells XPA NM_000380 (Hicks et al., 2012)
X-ray repair cross-complementing
protein 5 XRCC5 NM_021141 (Hicks et al., 2012)
Keratin, type I cytoskeletal 15 KRT15 NM_002275
Cytoskeleton [GO:0005856]
(Nacht et al., 1999)
Keratin, type I cytoskeletal 17 KRT17 NM_000422 (Nacht et al., 1999)
Tropomyosin beta chain TPM2 NM_003289 (Nacht et al., 1999)
Replication protein A 70 kDa
DNA-binding subunit RPA NM_002945 DNA replication [GO:0006260] (Hicks et al., 2012)
Src kinase-associated
phosphoprotein 2 SKAP2 NM_003930 Immune response [GO:0006959] (Hicks et al., 2012)
Serpin B5 SERPINB5 NM_002639 Metabolic process [GO:0008152] (Nacht et al., 1999)
19
5. Aim of the study
The identification of alterations in the patterns of gene expression in cancer cells has been an essential tool for development of better and effective approaches for early diagnosis and treatment of human cancer cases. Thus, it is of the major importance to continue looking for novel genes related to breast cancer initiation and progression. Consequently, the aim of this study is to identify genes differentially expressed between normal breast and breast cancer.
Chapter II
Materials and Methods
21
1. Cell lines
The MCF7 human breast cancer cell line was derived from a pleural effusion taken from a patient with metastatic breast cancer. It is characterized by the expression of ER (Levenson and Jordan 1997) and PR (Horwitz et al., 1975).
For this study, it was used a MCF7 and normal human breast RNA (ref. 636315 and 636163, respectively), that were purchased from Clontech (Mountain View, CA).
2. Supressive subtractive hybridization (SSH)
SSH was performed with the PCR-SelectTM cDNA Subtraction Kit (Clontech, Mountain View, CA)
according to the manufacturer’s protocol.
First, cDNA of the MCF7 RNA (tester) and normal human breast RNA (driver) was synthesized. The cDNA derived from both were digested by Rsa I restriction enzyme, to obtain blunt-ends which are necessary for adaptor ligation. The tester cDNA was divided into two portions and a different adaptor was linked to each. Then, two hybridizations were performed. In the first, an excess of driver was added to each sample of the tester. The samples are then heat denatured and allowed to anneal, generating four types of molecules in each sample. In this step, differentially expressed sequences are equalized and enriched. In the second hybridization, the two primary hybridization samples were mixed together to generate differentially expressed sequences. Then, the entire populations of molecules were subjected to a first PCR to amplify the differentially expressed sequences. Finally, the second PCR was performed to reduce any background PCR products and enrich the differentially expressed sequences.
It was generated the forward library, which corresponds to possible up-regulated genes and the reverse library, which corresponds to possible down-regulated genes.
3. Cloning into pGEM-T easy vector
SSH-derived genes were inserted into pGEM-T easy vector (Promega, Madison, WI) and transformed into competent XL1B cells. These were plated in agar plates containing X-Gal, ampicillin and IPTG, and white and blue colonies were formed. The white ones were picked
22 and grown in a LB-broth medium with ampicillin overnight. Finally, the plasmids were purified using the Wizard® Plus SV Minipreps DNA purification Systems (Promega, Madison, WI).
4. Digestion with the restriction enzyme EcoRI
To screen the presence of the inserts on vector, the plasmids were digested with the enzyme EcoRI for 1hour at 37°C. Then, the digests were electrophoresed in a 1% agarose gel with ethidium bromide for 30 minutes at 100V and it was visualized in the UV transilluminator.
5. DNA Sequencing
The plasmids that contain inserts were sequenced using the GenomeLebTM Dye Terminator
Cycle Sequencing with Quick Start Kit (Beckman Coulter, Fullerton, CA) according to the manufacturer’s protocol.
First, the plasmids were denatured by a pre-heat treatment (96°C for 1 minute). Next it was added the primer T7 5’-TAATACGACTCACTATAGGG-3’ and the Master Mix and put in the thermal cycling program (96°C for 20 seconds, 50°C for 20 seconds and 60°C for 4 minutes, during 30 cycles). Then, the DNA ethanol precipitation was performed. Initially, it was prepared a fresh Stop Solution, that contains 2 µL of 3M Sodium Acetate (pH 5.2), 2 µL of 100 mM Na2-EDTA (pH 8.0) and 1 µL of 20 mg/mL of glycogen (per sequencing reaction). To each of the sequencing reactions, it was added 5 µL of the Stop Solution mixture and the final samples were mixed thoroughly. Then, it was added 60 µL cold 95% (v/v) ethanol/dH2O from -20°C freezer and was mixed thoroughly. Immediately it was centrifuged at 14,000 rpm at 4°C for 15 minutes. Carefully it was removed the supernatant with a micropipette. Next, it was rinsed the pellet 2 times with 200 µL 70% (v/v) ethanol/dH2O from -20°C freezer. For each rinse, centrifuge immediately at 14,000 rpm at 4°C for a minimum of 5 minutes. After centrifugation carefully remove all of the supernatant with a micropipette and let the samples dry totally. Finally, the samples were resuspended in 40 µL of the Sample Loading Solution. The resuspended samples were transferred to the appropriated wells of the sample plate and each of the resuspended samples was overlaid with one drop of light mineral oil. At last, the sample plate was loaded into the instrument and it was started the desired method.
23
6. Sequence analysis
The DNA homology searches were performed using the Blast tool (Altschul et al., 1997) at the National Center for Biotechnology Information (NCBI). Next, the genes were grouped according its primary biological function based on Gene Ontology tool (Ashburner et al., 2000).
Chapter III
Results and Discussion
25
1. Identification of clones with insert
To identify genes differentially expressed in MCF7 cells, the subtractive cloning strategy of SSH generated two subtractive libraries – the forward (FW) one and the reverse (RV) one – with 96 clones each, numbered from A to H and 1-12.
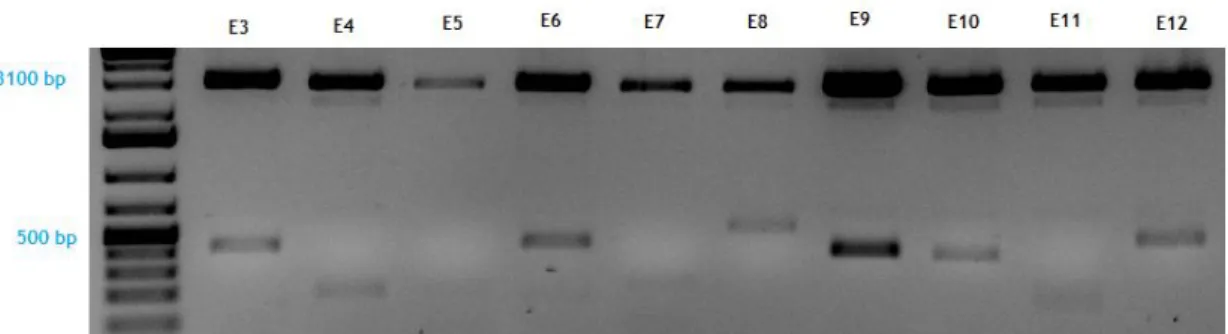
We have performed an enzymatic digestion with the EcoRI in all clones of both libraries, to verify which clones containing insert (Figure 5). Seventy of 96 clones of each library contain cDNA insert (Table 3) with sizes ranging from 100 to ~ 800 bp, suggesting that both libraries were well subtracted and normalized.
Table 3 – Total number of clones with insert in forward and reverse libraries
Total With insert %
Forward library 96 70 72,92
Reverse library 96 70 72,92
2. DNA sequencing of the inserts and identification of the
respective genes
In order to characterize the clone identity, all plasmids with insert were sequenced (Figure 6) and analyzed using the Blast tool (Altschul et al., 1997). In the FW and RV libraries, 49 of 70 and 50 of 70 sequences present high homology with genes deposited at Genebank,
Figure 5 - Enzymatic digestion of the FW clones E3 to E12. The plasmid appears at 3100 bp and
several cDNA inserts with different molecular weight can be detected in the clones E3, E4, E6, E7, E8, E9, E10, E11 and E12.
26 respectively. Although several clones have detected the same gene, it was identified 37 genes as overexpressed and 17 genes as underexpressed in MCF7 cell line.
After all this process, the biological function of each gene was obtained using the Gene Ontology tool (Ashburner et al., 2000), and grouped according its biological function (Table 4 and 5).
27
Table 4 – Identified up-regulated genes and its primary biological function
Clone number Acronym Gene name Chromosome localization
Accession number in GeneBank
Biological
Function Up-regulated in breast cancer Up-regulated in others cancers
F9 CD24 Homo sapiens CD24 molecule 6q21 NM_013230.2| Cell-cell adhesion [GO:0016337 ] Yes Yes
A11 / H2 TUBB2C Homo sapiens tubulin, beta 4B class IVb 9q34 NM_006088.5
Cell cycle [ GO:0007049 ] Yes Yes B1 NPM1 Homo sapiens nucleophosmin (nucleolar phosphoprotein B23, numatrin) 5q35.1 NM_001037738.2 No Yes
B8 / D7 / E12 / G10 KRT18 Homo sapiens keratin 18 12q13 NM_000224.2| Yes Yes
E1 DNMT1 Homo sapiens DNA
(cytosine-5-)-methyltransferase 1 19p13.2 NM_001379.2| Yes Yes
F10 MTRNR2L 2 Homo sapiens MT-RNR2-like 2 5q14.1 NM_001190470.1 No No
F12 / H4 MTRNR2L 8 Homo sapiens MT-RNR2-like 8 11p15.3 NM_001190702.1| No No
G3 H3F3B histone, family 3B Homo sapiens H3
28
Clone number Acronym Gene name Chromosome localization
Accession number in GeneBank
Biological
Function Up-regulated in breast cancer Up-regulated in others cancers
A2 ACTG1 Homo sapiens actin, gamma 1 17q25.1 NR_037688.1|
Cytoskeleton [ GO:0005856 ]
Yes Yes
H5 ACTB Homo sapiens actin, beta 7p22 NM_001101.3 No No
H12 KRT8 Homo sapiens keratin 8 12q13 NM_002273.3 Yes Yes
C6 PTGES3 prostaglandin E Homo sapiens
synthase 3 (cytosolic) 12q13.3 NM_006601.5|
Immune response
[GO:0006959] Yes Yes
C12 USP32 Homo sapiens ubiquitin specific peptidase 32 17q23.1 NM_032582.3|
Metabolic Process [ GO:0008152] Yes No E10 / F6 GAPDH Homo sapiens glyceraldehyde-3-phosphate dehydrogenase 12p13 NM_002046.3| No Yes
G1 TMPRSS13 transmembrane Homo sapiens
protease, serine 13 11q23 NM_001206790.1| No No
H3 PGK1 phosphoglycerate kinase Homo sapiens
29
Clone number Acronym Gene name Chromosome localization
Accession number in GeneBank
Biological
Function Up-regulated in breast cancer Up-regulated in others cancers
H11 H2AFZ histone family, member Homo sapiens H2A
Z 4q24 NM_002106.3 Yes Yes
A1 SNRPD1
Homo sapiens small nuclear ribonucleoprotein D1 polypeptide 16kDa 18q11.2 NM_006938.2| mRNA processing [ GO:0006397 ] No Yes
A9 RPL3 Homo sapiens ribosomal protein L3 22q13 NM_000971.3| No Yes
A4 / E8 / H9 eEF1A2 Homo sapiens eukaryotic translation elongation factor 1 alpha 2 20q13.3 NM_001958.2| Protein biosynthesis or translation [GO:0006412] Yes Yes
E2 RPL35 Homo sapiens ribosomal protein L35 9q34.1 NM_007209.3| No Yes
E8 eEF1A1 Homo sapiens eukaryotic translation elongation factor 1 alpha 1 6q14.1 NM_001402.5 Yes Yes
30
Clone number Acronym Gene name Chromosome localization
Accession number in GeneBank
Biological
Function Up-regulated in breast cancer Up-regulated in others cancers
G4 / G12 RPL7 Homo sapiens ribosomal protein L7 8q21.11 NM_000971.3| No Yes
G11 RPS25 Homo sapiens ribosomal protein S25 11q23.3 NM_001028.2| No No
H6 / H8 EIF2AK1
Homo sapiens eukaryotic translation initiation factor 2-alpha
kinase 1
7p22 NM_001134335.1 No Yes
H7 HSPE1 shock 10kDa protein 1 Homo sapiens heat
(chaperonin 10) 2q33.1 NM_002157.2
Protein folding
[GO:0051084] No Yes
F5 HSP90AA1
Homo sapiens heat shock protein 90kDa alpha (cytosolic), class
A member 1
14q32.33 NM_005348.3| Signal transduction [ GO:0007165 ] Yes Yes
G9 LARP1
Homo sapiens La ribonucleoprotein domain family, member
1
5q33.2 NM_015315.3| [ GO: 0003723] RNA binding No No
A8 POLR2J
Homo sapiens polymerase (RNA) II
(DNA directed) polypeptide J, 13.3kDa
31
Clone number Acronym Gene name Chromosome localization
Accession number in GeneBank
Biological
Function Up-regulated in breast cancer Up-regulated in others cancers
D6 / D10 PSMD7 Homo sapiens proteasome (prosome, macropain) 26S subunit, non-ATPase, 7 16q22.3 NM_002811.4| Yes No
E4 PHB2 Homo sapiens prohibitin 2 12p13 NM_007273.3| No Yes
A6 RAB10 member RAS oncogene Homo sapiens RAB10,
family 2p23.3 NM_016131.4| Transport [ GO:0006810 ] No Yes E3 KPNA2 Homo sapiens karyopherin alpha 2 (RAG cohort 1, importin
alpha 1)
17q24.2 NM_002266.2| Yes Yes
F3 LAPTM4B Homo sapiens lysosomal protein transmembrane
4 beta 8q22.1 NM_018407.4| Yes Yes
C11 TYW3 Homo sapiens t-RNA-yW synthesizing protein 3
homolog (S. cerevisiae) 1p31.1 NM_138467.2|
t-RNA processing
[ GO:0008033 ] No No
E7 RPSAP58 Homo sapiens ribosomal protein SA pseudogene
32
Table 5 – Identified down-regulated genes and its primary biological function
Clone number Acronym Gene name Chromosome localization
Accession number in GeneBank Biological Function Down-regulated in breast cancer Down-regulated in others cancers C2 WISP1 Homo sapiens WNT1-inducible-signaling pathway protein 1 8q24.22 NM_003882 Cell-cell adhesion [GO:0016337] Yes No E9 CELSR2 Homo sapiens cadherin, EGF LAG seven-pass G-type
receptor 2
1p21 NM_001408.2| Yes No
A3 GSN Homo sapiens gelsolin 9q33 NM_000177.4 [ GO:0005856] Cytoskeleton Yes Yes
E7 LYZ Homo sapiens lysozyme 12q15 NM_000239.2 Defense response to bacterium
[GO:0042742] No No
B2 / D7 / E10 / F2 /
G4 / G8 LTF lactotransferrin Homo sapiens 3p21.31 NM_001199149.1
Immune response [GO:0006959]
Yes Yes
B5 OAS1 Homo sapiens 2'-5'-oligoadenylate
synthase 1 12q24.2 NM_016816 No Yes E3 / H2 PIGR Homo sapiens polymeric immunoglobulin receptor 1q31-q41 NM_002644.3 No Yes