Education
Education
Education at a Glance
2016
The statistical data for Israel are supplied by and under the responsibility of the relevant Israeli authorities. The use of such data by the OECD is without prejudice to the status of the Golan Heights, East Jerusalem and Israeli settlements in the West Bank under the terms of international law.
Photo credits:
© Christopher Futcher / iStock © Marc Romanelli / Gettyimages © michaeljung / Shutterstock © Pressmaster / Shutterstock
Corrigenda to OECD publications may be found on line at: www.oecd.org/about/publishing/corrigenda.htm. © OECD 2016
You can copy, download or print OECD content for your own use, and you can include excerpts from OECD publications, databases and multimedia products in your own documents, presentations, blogs, websites and teaching materials, provided that suitable acknowledgment of the source and copyright owner is given. All requests for public or commercial use and translation rights should be submitted to [email protected]. Requests for permission to photocopy portions of this material for public or commercial use shall be addressed directly to the Copyright Clearance Center (CCC) at [email protected] or the Centre français d’exploitation du droit de copie (CFC) at [email protected].
This document and any map included herein are without prejudice to the status of or sovereignty over any territory, to the delimitation of international frontiers and boundaries and to the name of any territory, city or area.
Please cite this publication as:
OECD (2016), Education at a Glance 2016: OECD Indicators, OECD Publishing, Paris.
http://dx.doi.org/10.187/eag-2016-en
ISBN (print) 978-92-64-25979-9 ISBN (PDF) 978-92-64-25980-5
Governments are increasingly looking to international comparisons of education opportunities and outcomes as they develop policies to enhance individuals’ social and economic prospects, provide incentives for greater efficiency in schooling, and help to mobilise resources to meet rising demands. The OECD Directorate for Education and Skills contributes to these efforts by developing and analysing the quantitative, internationally comparable indicators that it publishes annually in Education at a Glance. Together with OECD country policy reviews, these indicators can be used to assist governments in building more effective and equitable education systems.
Education at a Glance addresses the needs of a range of users, from governments seeking to learn policy lessons to
academics requiring data for further analysis to the general public wanting to monitor how its country’s schools are progressing in producing world-class students. The publication examines the quality of learning outcomes, the policy levers and contextual factors that shape these outcomes, and the broader private and social returns that accrue to investments in education.
Education at a Glance is the product of a long-standing, collaborative effort between OECD governments, the experts
and institutions working within the framework of the OECD Indicators of Education Systems (INES) programme and the OECD Secretariat. The publication was prepared by the staff of the Innovation and Measuring Progress Division of the OECD Directorate for Education and Skills, under the responsibility of Dirk Van Damme and Corinne Heckmann, and in co-operation with Étienne Albiser, Diogo Amaro de Paula, Rodrigo Castañeda Valle, Éric Charbonnier, João Collet, Rie Fujisawa, William Herrera Penagos, Soumaya Maghnouj, Gabriele Marconi, Camila de Moraes, Simon Normandeau, Joris Ranchin, Cuauhtémoc Rebolledo Gómez, Gara Rojas González and Markus Schwabe. Administrative support was provided by Laetitia Dehelle, and additional advice as well as analytical support were provided by Anithasree Athiyaman, Marie-Hélène Doumet, Michael Jacobs, Karinne Logez, Martha Rozsi, Giovanni Maria Semeraro, Cailyn Torpie and Benedikt Weiß. Marilyn Achiron, Marika Boiron, Cassandra Davis and Sophie Limoges provided valuable support in the editorial and production process. The development of the publication was steered by member countries through the INES Working Party and facilitated by the INES Networks. The members of the various bodies as well as the individual experts who have contributed to this publication and to OECD INES more generally are listed at the end of the book.
While much progress has been accomplished in recent years, member countries and the OECD continue to strive to strengthen the link between policy needs and the best available internationally comparable data. This presents various challenges and trade-offs. First, the indicators need to respond to education issues that are high on national policy agendas, and where the international comparative perspective can offer added value to what can be accomplished through national analysis and evaluation. Second, while the indicators should be as comparable as possible, they also need to be as country-specific as is necessary to allow for historical, systemic and cultural differences between countries. Third, the indicators need to be presented in as straightforward a manner as possible, while remaining sufficiently complex to reflect multi-faceted realities. Fourth, there is a general desire to keep the indicator set as small as possible, but it needs to be large enough to be useful to policy makers across countries that face different challenges in education.
The OECD will continue not only to address these challenges vigorously and develop indicators in areas where it is feasible and promising to develop data, but also to advance in areas where a considerable investment still needs to be made in conceptual work. The OECD Programme for International Student Assessment (PISA) and its extension through the Survey of Adult Skills, a product of the Programme for the International Assessment of Adult Competencies (PIAAC), as well as the OECD Teaching and Learning International Survey (TALIS), are major efforts to this end.
Name of the indicator
in the 2015 edition
Editorial ...13
Introduction:The Indicators and their Framework ...17
Reader’s Guide ...21
About the new ISCED 2011 classification ...25
Executive Summary ...29
CHAPTER A THE OUTPUT OF EDUCATIONAL INSTITUTIONS AND THE IMPACT OF LEARNING...31
Indicator A1 To what level have adults studied? ...32
Table A1.1. Educational attainment of 25-64 year-olds (2015) ...41
Table A1.2. Percentage of adults who have attained tertiary education, by type of programme and age group (2015) ...42
Table A1.3. Trends in educational attainment, by age group (2005 and 2015) ...43
Table A1.4. Educational attainment of 25-34 year-olds, by programme orientation (2015) ...44
Table A1.5. Field of education studied among tertiary-educated adults, by gender (2012 or 2015) ...45
Indicator A2 How many students are expected to complete upper secondary education? ...46
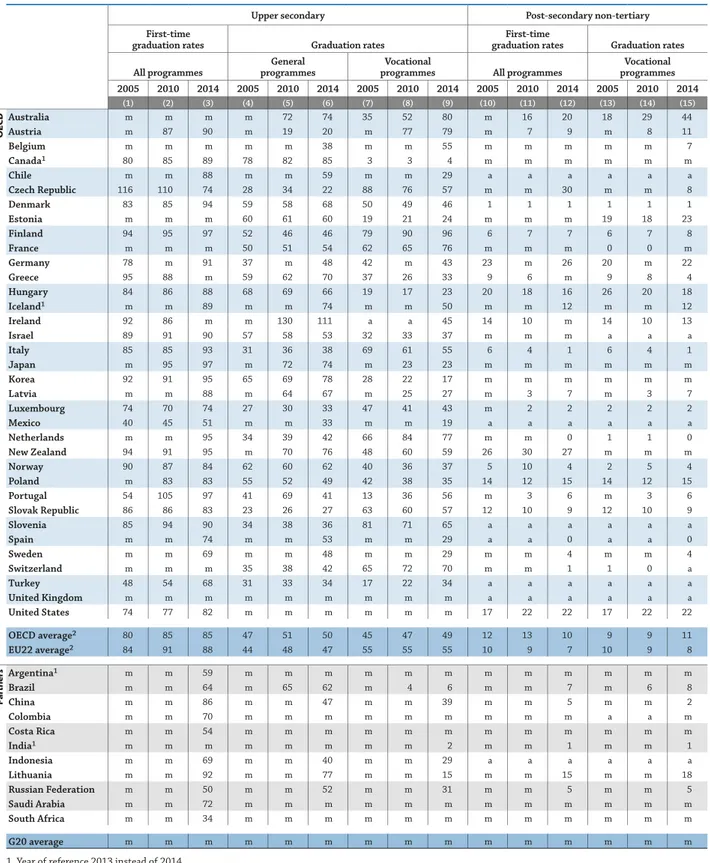
Table A2.1. Upper secondary and post-secondary non-tertiary graduation rates (2014) ...56
Table A2.2. Profile of upper secondary graduates from general and vocational programmes (2014) ...57
Table A2.3. Profile of post-secondary non-tertiary graduates from vocational programmes (2014) ...58
Table A2.4. Trends in upper secondary and post-secondary non-tertiary graduation rates (2005, 2010 and 2014) ...59
Indicator A3 How many young people are expected to complete tertiary education and what is their profile? ...60
Table A3.1. First-time graduation rates, by tertiary level (2014) ...68
Table A3.2. Profile of a first-time tertiary graduate (2014) ...69
Table A3.3. Gender ratio for all tertiary graduates, by field of education (2014) ...70
Table A3.4. Percentage of female, international first-time graduates and average age, by tertiary level (2014) ...71
Table A3.5. Percentage of all students and international students who graduate from sciences and engineering programmes, by tertiary level (2014) ...72
Table A3.6. Trends in first-time graduation rates, by tertiary levels (2005, 2010, 2014) ...73
Indicator A4 To what extent does parents’ background influence educational attainment? ...74
Table A4.1. Percentage of 25-44 year-olds with native-born and foreign-born parents, by educational attainment (2012 or 2015) ...83
Table A4.2. Parents’ educational attainment, by parents’ immigrant status (2012 or 2015) ...84
A1
A2
A3
Name of the indicator
in the 2015 edition Table A4.3. Intergenerational mobility in education, by parents’ educational attainment
and immigrant status (2012 or 2015) ...85
Table A4.4. Intergenerational mobility in education, by father’s and mother’s educational attainment (2012 or 2015)...88
Indicator A5 How does educational attainment affect participation in the labour market? ...90
Table A5.1. Employment rates, by educational attainment (2015) ...103
Table A5.2. Unemployment rates, by educational attainment (2015) ...104
Table A5.3. Trends in employment rates, by educational attainment and age group (2005 and 2015) ...105
Table A5.4. Trends in unemployment rates, by educational attainment and age group (2005 and 2015) ...106
Table A5.5. Employment, unemployment and inactivity rates of 25-34 year-olds, by programme orientation and educational attainment (2015) ...107
Table A5.6. Employment rates of tertiary-educated adults, by field of education studied and gender (2012 or 2015) ...108
Table A5.7. Frequency of use of information and communication technologies at work, by educational attainment (2012 or 2015) ...109
Table A5.8. Proficiency, use and need of information and communication technologies at work, by main industry (2012 or 2015) ...110
Table A5.9. (L) Mean literacy score, by occupation and level of education (2012 or 2015) ...112
Indicator A6 What are the earnings advantages from education? ...114
Table A6.1. Relative earnings of full-time full-year workers, by educational attainment (2014) ...125
Table A6.2. Differences in earnings between female and male workers, by educational attainment and age group (2014)...126
Table A6.3. Percentage of full-time, full-year earners, part-time earners and people with no earnings, by educational attainment (2014) ...127
Table A6.4. Mean monthly earnings of tertiary-educated adults, by field of education studied and gender (2012 or 2015) ...130
Indicator A7 What are the financial incentives to invest in education? ...134
Table A7.1a. Private costs and benefits for a man attaining upper secondary or post-secondary non-tertiary education (2012) ...145
Table A7.1b. Private costs and benefits for a woman attaining upper secondary or post-secondary non-tertiary education (2012) ...146
Table A7.2a. Public costs and benefits for a man attaining upper secondary or post-secondary non-tertiary education (2012) ...147
Table A7.2b. Public costs and benefits for a woman attaining upper secondary or post-secondary non-tertiary education (2012) ...148
Table A7.3a. Private costs and benefits for a man attaining tertiary education (2012) ...149
Table A7.3b. Private costs and benefits for a woman attaining tertiary education (2012) ...150
Table A7.4a. Public costs and benefits for a man attaining tertiary education (2012) ...151
Table A7.4b. Public costs and benefits for a woman attaining tertiary education (2012) ...152
A5
A6
Name of the indicator
in the 2015 edition
Indicator A8 How are social outcomes related to education? ...154
Table A8.1 (L). Percentage of adults reporting that they are in good health,
by educational attainment, literacy proficiency level and gender (2012 or 2015) ...163 Table A8.2a. Percentage of adults reporting activity limitation due to health problem,
by educational attainment and age group (2014)...164 Table A8.3a. Life satisfaction today and in 5 years, by educational attainment (2015) ...165
Indicator A9 How many students complete tertiary education? ...166
Table A9.1. Completion rate of full-time students by level of education, gender,
method and duration (2014) ...175 Table A9.2. Distribution of full-time students who entered a given educational level,
by theoretical duration (N) and theoretical duration
plus three years (N + 3) (2014) ...176 CHAPTER B FINANCIAL AND HUMAN RESOURCES INVESTED IN EDUCATION ...177
Indicator B1 How much is spent per student? ...180
Table B1.1. Annual expenditure per student by educational institutions
for all services (2013) ...192 Table B1.2. Annual expenditure per student by educational institutions for core educational
services, ancillary services and R&D (2013) ...193 Table B1.3. Cumulative expenditure per student by educational institutions
over the expected duration of primary and secondary studies (2013) ...194 Table B1.4. Annual expenditure per student by educational institutions for all services,
relative to per capita GDP (2013) ...195 Table B1.5a. Change in expenditure per student by educational institutions for all services,
relative to different factors, at the primary, secondary and post-secondary
non-tertiary levels of education (2005, 2008, 2010, 2011, 2012, 2013) ...196 Table B1.5b. Change in expenditure per student by tertiary educational institutions
for all services, relative to different factors
(2005, 2008, 2010, 2011, 2012, 2013)...197
Indicator B2 What proportion of national wealth is spent on education? ...198
Table B2.1. Expenditure on educational institutions as a percentage of GDP,
by level of education (2013) ...205 Table B2.2. Trends in expenditure on educational institutions as a percentage of GDP,
by level of education (2005, 2008, 2010, 2011, 2012, 2013) ...206 Table B2.3. Expenditure on educational institutions as a percentage of GDP,
by source of funding and level of education (2013) ...207 Table B2.4. Change in public expenditure on educational institutions
as a percentage of GDP (2008, 2010, 2013) ...208
Indicator B3 How much public and private investment in education is there? ...210
Table B3.1a. Relative proportions of public and private expenditure on educational institutions, by level of education (2013) ...217 Table B3.1b. Relative proportions of disaggregated public and private expenditure
on educational institutions, by level of education (2013) ...218
A8
B1
B2
Name of the indicator
in the 2015 edition Table B3.2a. Trends in the relative proportion of public expenditure on educational
institutions and index of change in public and private expenditure, at primary,
secondary, post-secondary non-tertiary level (2005, 2008, 2010 to 2013) ...219
Table B3.2b. Trends in the relative proportion of public expenditure on tertiary educational institutions and index of change in public and private expenditure (2005, 2008, 2010 to 2013) ...220
Table B3.3. Annual public expenditure on educational institutions per student, by type of institution (2013) ...221
Indicator B4 What is the total public spending on education? ...222
Table B4.1. Total public expenditure on education (2013)...230
Table B4.2. Trends in total public expenditure on primary to tertiary education (2005, 2008, 2010 and 2013) ...231
Table B4.3. Share of sources of public funds by level of government (2013)...232
Indicator B5 How much do tertiary students pay and what public support do they receive? ...234
Table B5.1. Estimated annual average tuition fees charged by educational institutions (short-cycle tertiary, bachelor’s and master’s or equivalent levels) (2013/14) ...243
Table B5.2. Estimated index of changes in the tuition fees charged by educational institutions (ISCED levels 5 to 7) and reforms related to tuition fees implemented in recent years on tertiary education (2013/14)...245
Table B5.3. Estimated annual average tuition fees charged by educational institutions for foreign students (2013/14) ...247
Table B5.4. Public loans to students in tertiary education (2013/14) and trends in the number of beneficiaries (2004/05 and 2014/15) ...249
Table B5.5. Repayment and remission of public loans to students in bachelor’s, master’s, doctoral or equivalent programmes (academic year 2013/14) ...252
Indicator B6 On what resources and services is education funding spent? ...254
Table B6.1. Share of current and capital expenditure by education level (2013) ...259
Table B6.2. Distribution of current expenditure by resource category (2013) ...260
Table B6.3. Share of current expenditure by resource category and type of institution (2013) ...261
Indicator B7 Which factors influence the level of expenditure on education? ...262
Table B7.1. Salary cost of teachers per student, by level of education (2014) ...271
Table B7.2a. Factors used to compute the salary cost of teachers per student in public institutions, in primary education (2010 and 2014) ...272
Table B7.2b. Factors used to compute the salary cost of teachers per student in public institutions, in lower secondary education (2010 and 2014) ...274
Table B7.2c. Factors used to compute the salary cost of teachers per student in public institutions, in upper secondary education (2014)...276
Table B7.3. Contribution of various factors to salary cost of teachers per student in primary education (2014) ...277
Table B7.4. Contribution of various factors to salary cost of teachers per student in lower secondary education (2014) ...278
Table B7.5. Contribution of various factors to salary cost of teachers per student in upper secondary education (2014) ...279
B4
B5
B6
Name of the indicator
in the 2015 edition
CHAPTER C ACCESS TO EDUCATION, PARTICIPATION AND PROGRESSION ...281
Indicator C1 Who participates in education? ...282
Table C1.1. Enrolment rates and expected years in education, by age group (2014) ...292
Table C1.2. Students enrolled as a percentage of the population between the ages of 15 and 20 (2014) ...293
Table C1.3a. Enrolment of students in upper secondary education, by programme orientation and age group (2014) ...294
Table C1.4. Percentage of students enrolled part time, by education level and age group (2014) ...295
Table C1.5. Change in enrolment rates for selected age groups (2005 and 2014) ...296
Indicator C2 How do early childhood education systems differ around the world? ...298
Table C2.1. Enrolment rates in early childhood and primary education, by age (2005 and 2014) ...308
Table C2.2. Profile of early childhood educational development programmes and pre-primary education (2014) ...309
Table C2.3. Expenditure on early childhood educational institutions (2013) ...310
Table C2.4. Profile of education-only and integrated pre-primary programmes (2014) ...311
Table C2.5. Coverage of early childhood education programmes in OECD and partner countries ...312
Indicator C3 How many students are expected to enter tertiary education? ...316
Table C3.1. First-time entry rates, by tertiary level (2014) ...324
Table C3.2. Profile of first-time new entrants into tertiary education (2014) ...325
Table C3.3. Profile of a first-time new entrant into tertiary education, by tertiary level (2014) ...326
Table C3.4. Trends in entry rates, by tertiary level (2005, 2010 and 2014) ...327
Indicator C4 Who studies abroad and where? ...328
Table C4.1. International student mobility and foreign students in tertiary education (2014) ...339
Table C4.2. Female students enrolled in tertiary education as a share of total enrolment, by field of education and mobility status (2014) ...340
Table C4.3. Mobility patterns of foreign and international students (2014) ...341
Table C4.4. Distribution of international and foreign students in master’s and doctoral or equivalent programmes, by country of origin (2014) ...342
Table C4.5. Students abroad in master’s and doctoral or equivalent programmes, by country of destination (2014)...344
Indicator C5 Transition from school to work: where are the 15-29 year-olds? ...346
Table C5.1. Percentage of 15-29 year-olds and 20-24 year-olds in education/not in education, by work status (2015)...356
Table C5.2. Trends in the percentage of 15-29 year-olds and 20-24 year-olds in education/ not in education, employed or not, by gender (2000 and 2015) ...358
Table C5.3 (L). Percentage of NEETs, by literacy proficiency (2012 or 2015) ...360
Table C5.3a (L). NEETs and employed mean literacy score (2012 or 2015) ...361
C1
C3 C2
C4
Name of the indicator
in the 2015 edition
Indicator C6 How many adults participate in education and learning? ...362
Table C6.1. Participation in formal and/or non-formal education, by index of use of reading skills in everyday life (2012 or 2015) ...373
Table C6.2. Participation in formal and/or non-formal education, by gender, literacy proficiency level and index of readiness to learn (2012 or 2015) ...374
Table C6.4. Average number of hours spent in non-formal education and participation rate in non-formal education (2012 or 2015) ...378
CHAPTER D THE LEARNING ENVIRONMENT AND ORGANISATION OF SCHOOLS ...379
Indicator D1 How much time do students spend in the classroom? ...380
Table D1.1. Instruction time in compulsory general education (2016) ...389
Table D1.2. Organisation of compulsory general education (2016)...391
Table D1.3a. Instruction time per subject in primary education (2016) ...392
Table D1.3b. Instruction time per subject in general lower secondary education (2016) ...393
Indicator D2 What is the student-teacher ratio and how big are classes? ...394
Table D2.1. Average class size by type of institution (2014) and index of change between 2005 and 2014 ...401
Table D2.2. Ratio of students to teaching staff in educational institutions (2014) ...403
Table D2.3. Ratio of students to teaching staff, by type of institution (2014) ...404
Indicator D3 How much are teachers paid? ...406
Table D3.1a. Teachers’ statutory salaries, based on typical qualifications, at different points in teachers’ careers (2014) ...420
Table D3.2a. Teachers’ actual salaries relative to wages of tertiary-educated workers (2014) ...422
Table D3.3a. Comparison of teachers’ statutory salaries, based on typical qualifications (2014) ...423
Table D3.4. Average actual teachers’ salaries, by age group and by gender (2014) ...424
Table D3.5a. Trends in teachers’ salaries, based on typical qualifications, between 2000 and 2014 ...425
Table D3.7. Criteria used for base salary and additional payments awarded to teachers in public institutions, by level of education (2014) ...426
Indicator D4 How much time do teachers spend teaching? ...428
Table D4.1. Organisation of teachers’ working time (2014) ...436
Table D4.2. Number of teaching hours per year (2000, 2005, 2010 and 2014) ...437
Table D4.3. Tasks and responsibilities of teachers, by level of education (2014) ...438
Indicator D5 Who are the teachers? ...440
Table D5.1. Age distribution of teachers (2014) ...447
Table D5.2. Age distribution of teachers (2005, 2014) ...448
Table D5.3. Gender distribution of teachers (2014) ...449
Indicator D6 Who are our school leaders and what do they do? ...450
Table D6.1. Gender and age of principals in lower secondary education (TALIS 2013) ...460
Table D6.2. Employment status of principals in lower secondary education (TALIS 2013) ...461
Table D6.3. Principals’ leadership in lower secondary education (TALIS 2013)...462
D2 D1 D3 D4 D5 C6
Name of the indicator
in the 2015 edition Table D6.4. Principals’ participation in school development plans in lower secondary education
(TALIS 2013) ...463
Table D6.5. Shared responsibility for leadership activities in lower secondary education (TALIS 2013) ...464
Table D6.6. Principals’ recent professional development in lower secondary education (TALIS 2013) ...465
Table D6.7. Principal’s views on teacher participation in school management (PISA 2012) ...466
ANNEX 1 CHARACTERISTICS OF EDUCATION SYSTEMS ...469
Table X1.1a. Typical graduation ages, by level of education (2014) ...470
Table X1.1b. Typical age of entry by level of education (2014) ...472
Table X1.2a. School year and financial year used for the calculation of indicators, OECD countries ...473
Table X1.2b. School year and financial year used for the calculation of indicators, partner countries ...474
Table X1.3. Starting and ending age for students in compulsory education (2014) ...475
ANNEX 2 REFERENCE STATISTICS ...477
Table X2.1. Basic reference statistics (reference period: calendar year 2013, 2014) ...478
Table X2.2. Basic reference statistics (reference period: calendar year 2005, 2008, 2010, 2011, 2012 current prices) ...479
Table X2.3. Basic reference statistics (reference period: calendar year 2005, 2008, 2010, 2011, 2012 in constant prices of 2013) ...480
Table X2.4a. Teachers’ statutory salaries at different points in their careers, for teachers with typical qualification (2014) ...481
Table X2.4b. Teachers’ statutory salaries at different points in their careers, for teachers with minimum qualification (2014) ...483
Table X2.4c. Trends in teachers’ salaries between 2000 and 2014, for teachers with typical qualification...485
Table X2.4d. Trends in teachers’ salaries between 2000 and 2014, for teachers with minimum qualification ...487
Table X2.4e. Reference statistics used in calculating teachers’ salaries (2000, 2005-14) ...489
Table X2.4f. Trends in average teachers’ actual salaries, in national currency (2000, 2005, 2010-14) ...490
Table X2.5. Teachers with 15 years of experience, by level of qualification (2014) ...492
Table X2.6. Percentage of pre-primary, primary, lower secondary and upper secondary teachers, by level of attainment (2014) ...493
ANNEX 3 SOURCES, METHODS AND TECHNICAL NOTES ...495
Contributors to this Publication ...497
Look for the StatLinks2at the bottom of the tables or graphs in this book. To download the matching Excel® spreadsheet, just type the link into your Internet browser, starting with the http://dx.doi.org prefix, or click on the link from the e-book edition.
This book has...
StatLinks
2
A service that delivers Excel files from the printed page! ®
http://twitter.com/OECD_Pubs http://www.facebook.com/OECDPublications http://www.linkedin.com/groups/OECD-Publications-4645871 http://www.youtube.com/oecdilibrary http://www.oecd.org/oecddirect/ OECD Alerts http://gpseducation.oecd.org/
In September 2015, the world’s leaders gathered in New York to set ambitious goals for the future of the global community. Goal 4 of the Sustainable Development Goals (SDGs) seeks to ensure “inclusive and equitable quality education and promote lifelong learning opportunities for all”. More specific targets and indicators spell out what countries need to deliver by 2030. The OECD regards the SDGs as an exceptional opportunity to promote the agenda of world-wide inclusive social progress and it will work together with other international organisations in implementing the goals and their targets, including by applying the OECD’s unique tools to monitor and assess measures of social progress and providing country-specific policy advice.
Two aspects of Goal 4 distinguish it from the preceding Millennium Development Goals (MDGs) on education which were in place between 2000 and 2015. Firstly, Goal 4 is truly global. The SDGs establish a universal agenda; they do not differentiate between rich and poor countries. Every single country is challenged to achieve the SDGs. Secondly, Goal 4 puts the quality of education and learning outcomes front and centre. Access, participation and enrolment, which were the main focus of the MDG agenda, are still important. The world is still far from providing equitable access to high-quality education for all. An estimated 57 million children still don’t have access to primary education and too many children continue to be excluded from the benefits of education because of poverty, gender, ethnicity, where they live, and armed conflicts.
But participation in education is not an end in itself. What matters for people and for our economies are the skills acquired through education. It is the competence and character qualities that are developed through schooling, rather than the qualifications and credentials gained, that make people successful and resilient in their professional and private lives. They are also key in determining individual well-being and the prosperity of societies.
The OECD’s international assessments of learning outcomes and skills reflect the magnitude and importance of challenges faced in education. Across the 65 high- and middle-income countries that participated in the OECD Programme for International Student Assessment (PISA) in 2012, an average of 33% of 15-year-olds did not attain the baseline level of proficiency in mathematics and 26% did not attain that level in reading. This means that roughly 800 000 15-year-olds in Mexico, 168 000 in France, and around 1.9 million 15-year-olds in Brazil do not yet have the basic knowledge and skills needed to thrive in modern societies.
The shift from access and enrolment in the MDGs towards the quality of education in Goal 4 requires a system that can measure the actual learning outcomes of children and young people at various ages and levels of education. The OECD already offers measurement tools to this end and is committed to improving, expanding and enriching its assessment tools.
PISA, for example, assesses the learning outcomes of 15-year-old students in reading, mathematics, science and collaborative problem-solving. In December 2016, results from the most recent PISA cycle, involving more than 70 high- and middle-income countries, will become available. PISA offers a comparable and robust measure of progress so that all countries, regardless of their starting point, can clearly see where they are on the path towards the internationally agreed targets of quality and equity in education. Through PISA, countries can also build their capacity to develop relevant data; and while most countries that have participated in PISA already have adequate systems in place, that isn’t true for many low-income countries. In this respect, the OECD PISA for Development initiative not only aims to expand the coverage of the international assessment to include more middle- and low-income countries, but it also offers these countries assistance in building their national assessment and data-collection systems.
PISA is also expanding its assessment domains to include other skills relevant to Goal 4. For 2018, for example, PISA is exploring an assessment of the “global competence” of 15-year-olds. This includes measuring their understanding of the “culture of peace and non-violence, global citizenship and appreciation of cultural diversity and of culture’s contribution to sustainable development”.
Measuring what counts in education: Monitoring
the Sustainable Development Goal for education
Other OECD data, such as those derived from the Survey of Adult Skills (a product of the OECD Programme for the International Assessment of Adult Competencies [PIAAC]) and the OECD Teaching and Learning International Survey (TALIS), provide a strong evidence base for monitoring education systems. OECD analysis promotes peer learning across countries as new policy options are explored and experiences compared. Together, OECD indicators, statistics and analyses can be seen as a model of how progress towards the SDG education goal can be measured and reported.
Table 1 presents a synopsis of what the OECD can offer to the international community as it develops a set of global indicators to track progress towards achieving Goal 4. While the measurement and assessment tools for education may be better established than those for other areas included in the SDGs, they do not yet cover all of the concepts included in the related targets. In this respect, the OECD stands ready to work with UNESCO, which oversees the education SDG agenda, in building a comprehensive data system.
Each year, Education at a Glance presents the broadest set of education indicators available in the world. The indicators in this edition of Education at a Glance provide the elements to assess where OECD countries stand on their way to meeting the education SDG targets (Table 2). For each indicator, the OECD identifies a quantitative benchmark. In future editions of the report, more sophisticated approaches will be developed by integrating multiple indicators in a composite index to reflect the various facets of the targets and the global indicators that will be adopted by the United Nations General Assembly in September 2016.
Comparing data, benchmarking, learning from good practices and exchanging experiences are among the core missions of the OECD. Data collected and processed with the highest possible accuracy and reliability are indispensable for these activities. Education at a Glance has always focused on data collection and reporting; but now, in the service of Goal 4, our indicators can contribute to improving well-being and economic outcomes across many more countries, for many more people.
Making Goal 4 a reality will transform lives around the globe. Imagine a world where all children have the opportunity to develop basic literacy and numeracy skills after nine years of study. The rewards would accrue not only to the individual students, but to the economies and societies to which they will contribute as adults.
The economic output that is lost due to poor education policies and practices is immense. For lower middle-income countries, potential economic gains from ensuring that all 15-year-olds attain at least the PISA baseline level of proficiency in reading, mathematics and science are estimated at 13 times their current GDP; on average, 28% higher GDP over the next 80 years. For upper middle-income countries, which generally show better learning outcomes, the gains would average 16% higher GDP over the same period. In other words, the gains from tackling low performance not only dwarf any conceivable cost of improvement – but also improve people’s well-being and stimulate economic growth.
The challenge is huge, but so is our commitment to succeed!
Angel Gurría
Table 1.OECD data to measure progress towards the education SDG targets
Education SDG targets* Data the OECD can offer and help to develop
4.1 By 2030, ensure that all girls and boys complete free,
equitable and quality primary and secondary education, leading to relevant and effective learning outcomes
• Enrolment and completion rate data from administrative sources
and INES data collections
• Reading and maths performance data for 15-year-olds in PISA
• Learning outcome assessments need to be developed for the end
of primary school
• PISA for Development will improve methodologies for estimating
the out-of-school populations
4.2 By 2030, ensure that all girls and boys have access
to quality early childhood development, care and pre-primary education so that they are ready for primary education
• Administrative data collected through the INES surveys on enrolment
in early childhood development and pre-primary education
• An Early Learning Outcomes assessment project is under development
and will generate data on the development of young children’s cognitive, social and emotional skills
4.3 By 2030, ensure equal access for all women and men
to affordable and quality technical, vocational and tertiary education, including university
• Enrolment rates from the INES data collections for tertiary education
and upper secondary vocational education programmes, by gender
• Participation in formal and non-formal adult education from the Survey
of Adult Skills (PIAAC)
4.4 By 2030, substantially increase the number of youth
and adults who have relevant skills, including technical and vocational skills, for employment, decent jobs and entrepreneurship
• Data on proficiency in digital problem-solving skills among 16-65 year-olds
from the Survey of Adult Skills (PIAAC)
• Data on proficiency in literacy and numeracy among 16-65 year-olds from
the Survey of Adult Skills (PIAAC)
4.5 By 2030, eliminate gender disparities in education
and ensure equal access to all levels of education and vocational training for the vulnerable, including persons with disabilities, indigenous peoples and children in vulnerable situations
• Enrolment, graduation and attainment data for all ISCED levels
from the INES data collections, by gender
• Educational attainment data for ISCED levels 3 and higher, by gender,
immigrant background, parents’ educational attainment, language spoken at home, from the Survey of Adult Skills (PIAAC)
• Data on public and private financial investments in education
from the INES data collections
• Data on equity policies related to access and funding for disadvantaged
populations from the country studies in the OECD project on Efficient Resource Allocation in Education
• Data on aid to education compiled by the Development Assistance
Committee (DAC) of the OECD
4.6 By 2030, ensure that all youth and a substantial
proportion of adults, both men and women, achieve proficiency in literacy and numeracy
• Literacy and numeracy proficiency data from the Survey of Adult Skills
(PIAAC), by age and gender
• Participation in basic skills training activities from the Survey of Adult
Skills (PIAAC)
4.7 By 2030, ensure that all learners acquire the knowledge
and skills needed to promote sustainable development, including, among others, through education for sustainable development and sustainable lifestyles, human rights, gender equality, promotion of a culture of peace and non-violence, global citizenship and appreciation of cultural diversity and of culture’s contribution to sustainable development
• Global competence proficiency data from the 2018 PISA cycle
• Science proficiency and environmental awareness data from the 2015 PISA
cycle
• Data on interpersonal trust and various other social outcomes from the
Survey of Adult Skills (PIAAC)
• INES/NESLI surveys on curricula, subject fields and learning time in
schools
4.a Build and upgrade education facilities that are
child-, disability- and gender-sensitive, and provide safe, nonviolent, inclusive and effective learning environments for all
• Data on learning environments, resources and equipment (including ICT
and connectivity) from PISA surveys
• School-climate indicators, including violence and disruptive behaviour
by students, from the Teaching and Learning International Survey (TALIS)
4.b By 2020, substantially expand globally the number
of scholarships available to developing countries, in particular least-developed countries, small-island developing states and African countries, for enrolment in higher education, including vocational training and information and communications technology, technical, engineering and scientific programmes, in developed countries and other developing countries
• Data compiled by the Development Assistance Committee (DAC)
of the OECD on scholarships included in development aid programmes
4.c By 2030, substantially increase the supply of qualified
teachers, including through international co-operation for teacher training in developing countries, especially least-developed countries and small-island
developing states
• Data on teachers from the INES/NESLI surveys
• Data on teachers, teacher training and teachers’ professional development
from the TALIS surveys and PISA teacher questionnaire
• Data from the forthcoming Initial Teacher Preparation (ITP) study
Table 2. OECD countries’ progress towards the education SDG targets
Education SDG targets* 4.1 4.2 4.3 4.4 4.5 4.6 4.7 4.a 4.b 4.c
Benchmark 80 95 60 60 75 50 70 0.7 0 95 Australia 80 101 66 77 58 71 1.5 38 98 Austria 81 96 70 61 71 45 64 1.5 -19 Belgium1 81 98 67 65 72 53 67 0.7 0 98 Canada1 86 93 65 83 51 75 0.8 13 98 Chile 48 94 87 34 47 13 44 0.5 86 Czech Republic 79 89 69 59 76 49 66 0.9 1 77 Denmark 83 98 89 70 82 50 63 0.8 0 94 Estonia 89 51 82 51 75 0.7 94 Finland 88 79 53 67 91 62 80 0.5 92 France 78 101 40 62 0.6 -10 90 Germany 82 99 64 64 74 47 68 0.7 -50 Greece 64 91 39 73 31 58 0.2 -52 Hungary 72 96 42 63 67 0.6 Iceland 79 86 86 60 0.6 92 Ireland 83 100 51 80 45 66 0.6 1 Israel 66 98 70 50 75 38 50 0.4 94 Italy 75 97 44 76 29 53 0.5 -2 79 Japan 89 96 80 53 78 72 75 0.6 -1 88 Korea 91 94 55 78 46 72 0.4 8 96 Latvia 80 96 75 63 1.0 91 Luxembourg 76 99 32 74 59 0.9 1 Mexico 45 113 38 57 34 0.3 62 Netherlands 85 99 70 73 82 60 70 0.7 -30 92 New Zealand 77 98 96 75 78 58 68 1.1 7 Norway 78 98 81 72 91 58 59 0.8 1 93 Poland 86 95 74 32 76 42 66 0.4 99 Portugal 75 96 65 69 54 0.5 -1 82 Slovak Republic 73 81 59 50 64 51 61 0.8 89 Slovenia 80 90 72 49 75 35 71 0.6 2 Spain 76 97 72 75 32 62 0.7 -7 97 Sweden 73 95 62 72 87 58 62 0.6 9 90 Switzerland 88 98 80 83 66 0.7 -1 Turkey 58 71 94 22 72 12 38 0.1 134 United Kingdom1 78 99 61 79 64 1.0 -7 92 United States 74 90 52 64 74 48 58 1.0 OECD average 77 95 68 57 76 46 63 0.7 1 90 EU22 average 79 95 63 57 76 46 65 0.7 -10 90
Notes: Figures above the benchmark are coloured light blue. Mismatches between the coverage of the population data and the enrolment data may
result in enrolment rates of over 100%.
1. For targets 4.4, 4.6 and 4.c, Belgium is Flanders only. For target 4.c, Canada is Alberta only, and the United Kingdom is England only.
* Legend to the Education SDG targets
4.1 Percentage of 15 year-old students performing at Level 2 or higher on the math scale (PISA, 2012)
4.2 Enrolment rate in pre-primary and primary education at age 5 (INES, 2014)
4.3 First-time tertiary entry rates (INES, 2014)
4.4 Percentage of 24-64 year-olds in Group 3 or 4 of skills and readiness to use information and communication technologies for problem solving scale (PIAAC, 2012/2015)
4.5 PISA Inclusion Index (PISA, 2012)
4.6 Percentage of adults performing at Level 3 or higher on the literacy scale (PIAAC, 2012/2015)
4.7 Percentage of students at level A, B and C in the environmental science performance index (PISA, 2006)
4.a Computers for educational purposes per student. Mean index (PISA, 2012)
4.b Scholarships and student costs in donor countries (US$, millions, difference between 2012 and 2014)
The organising framework
Education at a Glance 2016: OECD Indicators offers a rich, comparable and up-to-date array of indicators that reflects
a consensus among professionals on how to measure the current state of education internationally. The indicators provide information on the human and financial resources invested in education, how education and learning systems operate and evolve, and the returns to investments in education. The indicators are organised thematically, and each is accompanied by information on the policy context and an interpretation of the data. The education indicators are presented within an organising framework that:
• distinguishes between the actors in education systems: individual learners and teachers, instructional settings and learning environments, education service providers, and the education system as a whole
• groups the indicators according to whether they address learning outcomes for individuals or countries, policy levers or circumstances that shape these outcomes, or to antecedents or constraints that put policy choices into context
• identifies the policy issues to which the indicators relate, with three major categories distinguishing between the quality of education outcomes and education opportunities, issues of equity in education outcomes and opportunities, and the adequacy and effectiveness of resource management.
The following matrix describes the first two dimensions:
THE INDICATORS AND THEIR FRAMEWORK
1. Education and
learning outputs and outcomes
2. Policy levers and
contexts shaping education outcomes 3. Antecedents or constraints that contextualise policy I. Individual participants in education and learning
1.I. The quality and distribution of individual education outcomes
2.I. Individual attitudes towards, engagement in, and behaviour in teaching and learning
3.I. Background characteristics of the individual learners and teachers II. Instructional
settings 1.II. The quality of instructional
delivery
2.II. Pedagogy, learning practices and classroom climate
3.II. Student learning conditions and teacher working conditions III. Providers of
educational services 1.III. The output of educational
institutions and institutional performance
2.III. School environment
and organisation 3.III. Characteristics of the service providers and their communities IV. The education
system as a whole 1.IV. The overall performance
of the education system 2.IV. System-wide institutional settings, resource allocations, and policies
3.IV. The national educational, social, economic, and demographic contexts
Actors in education systems
The OECD Indicators of Education Systems (INES) programme seeks to gauge the performance of national education systems as a whole, rather than to compare individual institutional or other subnational entities. However, there is increasing recognition that many important features of the development, functioning and impact of education systems can only be assessed through an understanding of learning outcomes and their relationships to inputs and processes at the level of individuals and institutions. To account for this, the indicator framework distinguishes between a macro level, two meso-levels and a micro-level of education systems. These relate to:
• the education system as a whole
• the educational institutions and providers of educational services
• the instructional setting and the learning environment within the institutions • the individual participants in education and learning.
To some extent, these levels correspond to the entities from which data are being collected, but their importance mainly centres on the fact that many features of the education system play out quite differently at different levels of the system, which needs to be taken into account when interpreting the indicators. For example, at the level of students within a classroom, the relationship between student achievement and class size may be negative, if students in small classes benefit from improved contact with teachers. At the class or school level, however, students are often intentionally grouped such that weaker or disadvantaged students are placed in smaller classes so that they receive more individual attention. At the school level, therefore, the observed relationship between class size and student achievement is often positive, suggesting that students in larger classes perform better than students in smaller classes. At higher aggregated levels of education systems, the relationship between student achievement and class size is further confounded, e.g. by the socio-economic intake of schools or by factors relating to the learning culture in different countries. Therefore, past analyses that have relied on macro-level data alone have sometimes led to misleading conclusions.
Outcomes, policy levers and antecedents
The second dimension in the organising framework further groups the indicators at each of the above levels: • Indicators on observed outputs of education systems, as well as indicators related to the impact of knowledge and
skills for individuals, societies and economies, are grouped under the sub-heading output and outcomes of education
and learning.
• The sub-heading policy levers and contexts groups activities seeking information on the policy levers or circumstances that shape the outputs and outcomes at each level.
• These policy levers and contexts typically have antecedents – factors that define or constrain policy. These are represented by the sub-heading antecedents and constraints. The antecedents or constraints are usually specific for a given level of the education system; antecedents at a lower level of the system may well be policy levers at a higher level. For teachers and students in a school, for example, teacher qualifications are a given constraint while, at the level of the education system, professional development of teachers is a key policy lever.
Policy issues
Each of the resulting cells in the framework can then be used to address a variety of issues from different policy perspectives. For the purpose of this framework, policy perspectives are grouped into three classes that constitute the third dimension in the organising framework for INES:
• quality of education outcomes and education opportunities
• equality of education outcomes and equity in education opportunities • adequacy, effectiveness and efficiency of resource management.
In addition to the dimensions mentioned above, the time perspective in the framework allows for dynamic aspects of the development of education systems to be modelled as well.
The indicators that are published in Education at a Glance 2016 fit within this framework, though often they speak to more than one cell.
Most of the indicators in Chapter A, The output of educational institutions and the impact of learning, relate to the first column of the matrix describing outputs and outcomes of education. Even so, indicators in Chapter A measuring educational attainment for different generations, for instance, not only provide a measure of the output of the education system, but also provide context for current education policies, helping to shape policies on, for example, lifelong learning.
Chapter B, Financial and human resources invested in education, provides indicators that are either policy levers or antecedents to policy, or sometimes both. For example, expenditure per student is a key policy measure that most directly affects the individual learner, as it acts as a constraint on the learning environment in schools and learning conditions in the classroom.
Chapter C, Access to education, participation and progression, provides indicators that are a mixture of outcome indicators, policy levers and context indicators. Internationalisation of education and progression rates are, for instance, outcome measures to the extent that they indicate the results of policies and practices at the classroom, school and system levels. But they can also provide contexts for establishing policy by identifying areas where policy intervention is necessary to address issues of inequity, for example.
Chapter D, The learning environment and organisation of schools, provides indicators on instruction time, teachers’ working time and teachers’ salaries that not only represent policy levers that can be manipulated but also provide contexts for the quality of instruction in instructional settings and for the outcomes of individual learners. It also presents data on the profile of teachers, the levels of government at which decisions about education are taken, and pathways and gateways to gain access to secondary and tertiary education.
The reader should note that this edition of Education at a Glance covers a significant amount of data from partner countries as well (please refer to the Reader’s Guide for details).
READER’S GUIDE
Coverage of the statistics
Although a lack of data still limits the scope of the indicators in many countries, the coverage extends, in principle, to the entire national education system (within the national territory), regardless of who owns or sponsors the institutions concerned and regardless of how education is delivered. With one exception (described below), all types of students and all age groups are included: children (including students with special needs), adults, nationals, foreigners, and students in open-distance learning, in special education programmes or in education programmes organised by ministries other than the ministry of education, provided that the main aim of the programme is to broaden or deepen an individual’s knowledge. Vocational and technical training in the workplace, with the exception of combined school- and work-based programmes that are explicitly deemed to be part of the education system, is not included in the basic education expenditure and enrolment data.
Educational activities classified as “adult” or “non-regular” are covered, provided that the activities involve the same or similar content as “regular” education studies, or that the programmes of which they are a part lead to qualifications similar to those awarded in regular education programmes.
Courses for adults that are primarily for general interest, personal enrichment, leisure or recreation are excluded.
Country coverage
This publication features data on education from the 35 OECD countries, two partner countries that participate in the OECD Indicators of Education Systems programme (INES), Brazil and the Russian Federation, and other partner countries that do not participate in INES (Argentina, China, Colombia, Costa Rica, India, Indonesia, Lithuania, Saudi Arabia and South Africa). Data sources for these latter nine countries are specified below the tables.
The statistical data for Israel are supplied by and under the responsibility of the relevant Israeli authorities. The use of such data by the OECD is without prejudice to the status of the Golan Heights, East Jerusalem and Israeli settlements in the West Bank under the terms of international law.
Calculation of international means
The main purpose of Education at a Glance is to provide an authoritative compilation of key international comparisons of education statistics. While countries attain specific values in these comparisons, readers should not assume that countries themselves are homogeneous. The country averages include significant variations among subnational jurisdictions, much as the OECD average encompasses a variety of national experiences (see Box A1.1 in Education at a Glance 2014).
For many indicators, an OECD average is presented; for some, an OECD total is shown. The OECD average is calculated as the unweighted mean of the data values of all OECD countries for which data are available or can be estimated. The OECD average therefore refers to an average of data values at the level of the national systems and can be used to answer the question of how an indicator value for a given country compares with the value for a typical or average country. It does not take into account the absolute size of the education system in each country.
The OECD total is calculated as the weighted mean of the data values of all OECD countries for which data are available or can be estimated. It reflects the value for a given indicator when the OECD area is considered as a whole. This approach is taken for the purpose of comparing, for example, expenditure charts for individual countries with those of the entire OECD area for which valid data are available, with this area considered as a single entity.
Both the OECD average and the OECD total can be significantly affected by missing data. Given the relatively small number of countries surveyed, no statistical methods are used to compensate for this. In the case of some countries, data may not be available for specific indicators, or specific categories may not apply. Therefore, readers should keep in mind that the term “OECD average” refers to the OECD countries included in the respective comparisons. Averages are sometimes not calculated if too many countries have missing information or have information included in other columns.
For financial tables using trend series over 1995-2013, the OECD average is also calculated for countries providing data for all reference years used. This allows for a comparison of the OECD average over time with no distortion due to the exclusion of certain countries in the different years.
For many indicators, an EU22 average is also presented. It is calculated as the unweighted mean of the data values of the 22 countries that are members of both the European Union and the OECD for which data are available or can be estimated. These 22 countries are Austria, Belgium, the Czech Republic, Denmark, Estonia, Finland, France, Germany, Greece, Hungary, Ireland, Italy, Latvia, Luxembourg, the Netherlands, Poland, Portugal, Slovenia, the Slovak Republic, Spain, Sweden and the United Kingdom.
For some indicators, a G20 average is presented. The G20 average is calculated as the unweighted mean of the data values of all G20 countries for which data are available or can be estimated (Argentina, Australia, Brazil, Canada, China, France, Germany, India, Indonesia, Italy, Japan, Korea, Mexico, the Russian Federation, Saudi Arabia, South Africa, Turkey, the United Kingdom and the United States; the European Union is the 20th member of the G20 but is not included in the calculation). The G20 average is not computed if data for China or India are not available.
For some indicators, an average is presented. This average is included in tables with data from the 2012 Survey of Adult Skills, a product of the OECD Programme for the International Assessment of Adult Competencies (PIAAC). The average corresponds to the arithmetic mean of the estimates included in the table or figure from both the national and the subnational entities (which include Flanders [Belgium] and England/ Northern Ireland [UK]). Partner countries are not included in the average presented in any of the tables or figures.
Standard error (S.E.)
The statistical estimates presented in this report are based on samples of adults, rather than values that could be calculated if every person in the target population in every country had answered every question. Therefore, each estimate has a degree of uncertainty associated with sampling and measurement error, which can be expressed as a standard error. The use of confidence intervals provides a way to make inferences about the population means and proportions in a manner that reflects the uncertainty associated with the sample estimates. In this report, confidence intervals are stated at a 95% level. In other words, the result for the corresponding population would lie within the confidence interval in 95 out of 100 replications of the measurement on different samples drawn from the same population.
In tables showing standard errors, there is one column with the heading “%”, which indicates the average percentage, and a column with the heading “S.E.”, which indicates the standard error. Given the survey method, there is a sampling uncertainty in the percentages (%) of twice the standard error (S.E.). For example, for the values: % = 10 and S.E. = 2.6, 10% has an uncertainty zone of twice (1.96) the standard error of 2.6, assuming an error risk of 5%. Thus, the true percentage would probably (error risk of 5%) be somewhere between 5% and 15% (“confidence interval”). The confidence interval is calculated as: % +/– 1.96 * S.E., i.e. for the previous example, 5% = 10% – 1.96 * 2.6 and 15% = 10% + 1.96 * 2.6.
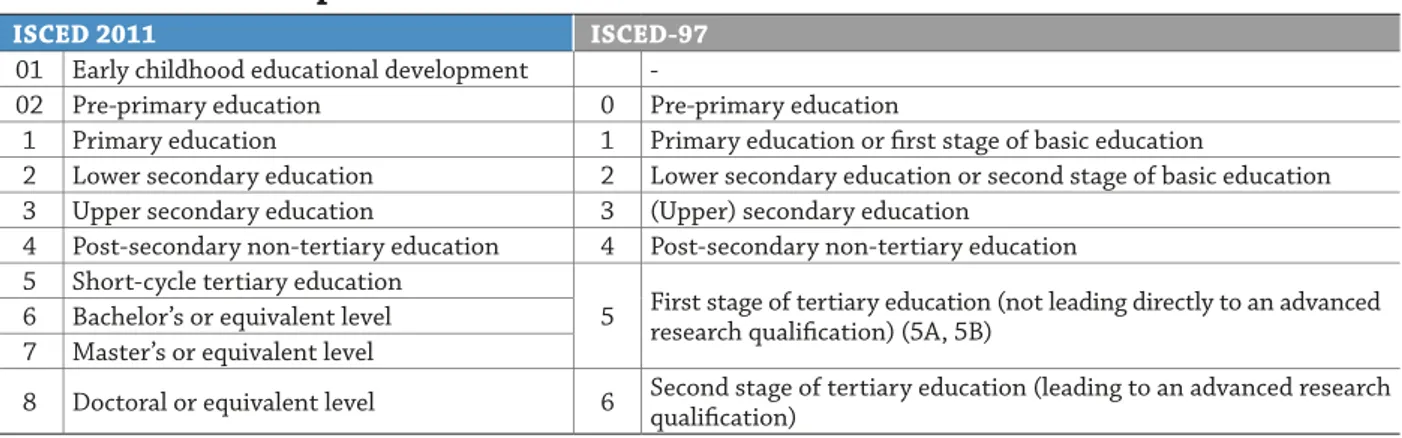
Classification of levels of education
The classification of levels of education is based on the International Standard Classification of Education (ISCED). ISCED is an instrument for compiling statistics on education internationally. ISCED-97 was recently revised, and the new International Standard Classification of Education (ISCED 2011) was formally adopted in November 2011. This new classification is used for the second time in this edition of Education at a Glance. The major changes between ISCED 2011 and ISCED-97 are described in the section “About the ISCED 2011 classification”.
Symbols for missing data and abbreviations
These symbols and abbreviations are used in the tables and figures: a Data are not applicable because the category does not apply.
b There is a break in the series when data for the latest year refer to ISCED 2011 and data for previous years refer to ISCED-97.
c There are too few observations to provide reliable estimates (e.g. in the Survey of Adult Skills, there are fewer than 3 individuals for the numerator or fewer than 30 individuals for the denominator). d Includes data from another category.
m Data are not available.
0 Magnitude is either negligible or zero.
r Values are below a certain reliability threshold and should be interpreted with caution. q Data have been withdrawn at the request of the country concerned.
x Data included in another category or column of the table (e.g. x(2) means that data are included in Column 2 of the table).
~ Average is not comparable with other levels of education.
Further resources
The website www.oecd.org/education/education-at-a-glance-19991487.htm provides information on the methods used to calculate the indicators, on the interpretation of the indicators in the respective national contexts, and on the data sources involved. The website also provides access to the data underlying the indicators and to a comprehensive glossary for technical terms used in this publication.
All post-production changes to this publication are listed at www.oecd.org/publishing/corrigenda (corrections) and http://dx.doi.org/10.1787/eag-data-en (updates).
Education at a Glance uses the OECD’s StatLinks service. Below each table and figure in Education at Glance 2016
is a URL that leads to a corresponding Excel file containing the underlying data for the indicator. These URLs are stable and will remain unchanged over time. In addition, readers of the Education at a Glance e-book will be able to click directly on these links and the workbook will open in a separate window.
Layout of tables
In all tables, the numbers in parentheses at the top of the columns are simply used for reference. When a consecutive number does not appear, that column is available on line only.
Codes used for territorial entities
These codes are used in certain figures. Country or territorial entity names are used in the text and the tables. Note that throughout the publication, the Flemish Community of Belgium and the French Community of Belgium may be referred to as “Belgium (Fl.)” and “Belgium (Fr.)”, respectively. However, for indicators using data from the Survey of Adult Skills and from the Teaching and Learning International Survey (TALIS), the Flemish Community is referred to as “Flanders (Belgium)”.
ARG Argentina CZE Czech Republic ISL Iceland PRT Portugal
AUS Australia DEU Germany ISR Israel RUS Russian Federation
AUT Austria DNK Denmark ITA Italy SAU Saudi Arabia
BEL Belgium ENG England (UK) JPN Japan SCO Scotland (UK)
BFL Belgium (Flemish Community) ESP Spain KOR Korea SVK Slovak Republic BFR Belgium (French Community) EST Estonia LUX Luxembourg SVN Slovenia
BRA Brazil FIN Finland LVA Latvia SWE Sweden
CAN Canada FRA France LTU Lithuania TUR Turkey
CHE Switzerland GRC Greece NZL New Zealand UKM United Kingdom
CHL Chile HUN Hungary MEX Mexico USA United States
CHN China IDN Indonesia NLD Netherlands ZAF South Africa
COL Colombia IND India NOR Norway
More details can be found in the publication ISCED 2011 Operational Manual: Guidelines for Classifying National
Education Programmes and Related Qualifications (OECD/Eurostat/UNESCO Institute for Statistics, 2015),
http://dx.doi.org/10.1787/9789264228368-en.
The need to revise ISCED
The structure of education systems varies widely between countries. In order to produce internationally comparable education statistics and indicators, it is necessary to have a framework to collect and report data on education programmes with a similar level of educational content. UNESCO’s International Standard Classification of Education (ISCED) is the reference classification for organising education programmes and related qualifications by education levels and fields. The basic concepts and definitions of ISCED are intended to be internationally valid and comprehensive of the full range of education systems.
The ISCED classification was initially developed by UNESCO in the mid-1970s, and was first revised in 1997. Due to subsequent changes in education and learning systems throughout the start of the 21st century, a further review of ISCED was undertaken between 2009 and 2011 involving extensive global consultation with countries, regional experts and international organisations. The revision took into account important shifts in the structure of higher education, such as the Bologna process in Europe, expansion of education programmes for very young children, and increasing interest in statistics on the outcomes of education, such as educational attainment. The revised ISCED 2011 classification was adopted by the UNESCO General Conference at its 36th session in November 2011.
Major changes between ISCED 2011 and ISCED-97
The ISCED 2011 classification is an important step forward in a long-term consultative process designed to improve the comparability of international statistics on education. The classification is used for the second time in this edition of Education at a Glance. The major changes between ISCED 2011 and ISCED-97 are the following:
• ISCED 2011 classification presents a revision of the ISCED-97 levels of education programmes (ISCED-P) and introduces for the first time a related classification of educational attainment levels (ISCED-A) based on recognised education qualifications (see Indicator A1).
• ISCED 2011 classification includes improved definitions of formal and non-formal education, educational activities and programmes.
• Compared to ISCED-97 which had seven levels of education, ISCED 2011 now has nine levels of education. In fact, higher education has been restructured taking into account changes in tertiary education, such as the Bologna structure, and now comprises four levels of education compared with two levels in ISCED-97. Programmes previously classified in level 5 of ISCED-97 will now be allocated to level 5, 6 or 7 in ISCED 2011. Moreover, while the position in the national degree structure of tertiary programmes was mentioned in ISCED-97, specific coding for this dimension has been introduced in ISCED 2011 for levels 6 and 7 (bachelor’s or equivalent and master’s or equivalent levels, respectively).
• ISCED level 0 has been expanded to include a new category covering early childhood educational development programmes designed for children under the age of 3 (see Indicator C2).
• Each education level within ISCED has also been more clearly delineated, which may result in some changes of classification for programmes that previously sat on the border between ISCED levels (for example, between ISCED levels 3 and 4).