LOOKING THROUGH THE EYES OF THE PAINTER:
FROM VISUAL PERCEPTION TO
NON-PHOTOREALISTIC RENDERING
Roberto Lam
University of Algarve Escola Superior de TecnologiaCampus da Penha 8005-139, Faro, Portugal
[email protected]
João Rodrigues
University of Algarve Escola Superior de TecnologiaCampus da Penha 8005-139, Faro, Portugal
[email protected]
J.M.H. du Buf
University of Algarve Vision Laboratory - FCT Campus de Gambelas 8005-072, Faro, Portugal[email protected]
ABSTRACT
In this paper we present a brief overview of the processing in the primary visual cortex, the multi-scale line/edge and keypoint representations, and a model of brightness perception. This model, which is being extended from 1D to 2D, is based on a symbolic line and edge interpretation: lines are represented by scaled Gaussians and edges by scaled, Gaussian-windowed error functions. We show that this model, in combination with standard techniques from graphics, provides a very fertile basis for non-photorealistic image rendering.
Keywords
Perception, models, multi-scale representations, brightness, focus-of-attention, non-photorealistic rendering.
1. INTRODUCTION
Painters have learned to observe, to select relevant information, and to translate this information into a representation that they want to transfer, in some preferred style like pointillism (e.g. Seurat) or impressionism (e.g. van Gogh). These two styles can be seen as extreme examples of Level-of-Detail (LoD), which is strongly related to the processing in the retina and visual cortex. In addition, painters can apply coarse-to-fine scale and background-to-foreground “rendering,” plus special techniques like clair-obscur and wet-in-wet, using a broad array of brushes and palette knives. Available pigments allow to approximate any real color, although many painters prefer a very limited color gamut.
Trying to understand painters, their techniques, and visual aesthetics in general, is a challenge, especially when referring to physical processes in the eyes and brain [Zeki, 2000; Livingstone, 2000]. An even bigger challenge is to exploit these processes in
trying to simulate techniques and styles of certain painters. This requires state-of-the-art models of image representations in the visual cortex together with insight into higher-level cognitive effects. For example, symbolic pointillism [Krüger and Wörgötter, 2003] renders small circles at edge positions by exploiting principles of Gestalt theory, such as good continuity grouping, in order to present meaningful image information.
Visual perception seems to be an effortless, transparent process. In reality it is the result of a combination of many different, complicated and still partly understood mechanisms in the retinas, visual cortex and higher brain areas. Hypercolumns in cortical area V1 contain a stack of scale- and orientation-tuned cells that provide retinotopic (neighborhood preserving) image-representation and feature maps: even and odd simple cells, complex and end-stopped cells, plus many grouping cells that serve to detect basic features like lines and edges, bars and gratings, keypoints and saliency maps for Focus-of-Attention (FoA), motion and disparity. This information is relayed to higher brain areas, via ventral and dorsal data streams, in combination with top-down data streams, forming the what and where subsystems [Deco and Rolls, 2004; Rensink, 2000]. Receptive fields of even and odd simple cells, which can be seen as anisotropic quadrature filters, are commonly modeled by complex Gabor functions with real (even) and imaginary (odd) parts. Phase invariant complex cells are then modeled by Permission to make digital or hard copies of all or part of
this work for personal or classroom use is granted without fee provided that copies are not made or distributed for profit or commercial advantage and that copies bear this notice and the full citation on the first page. To copy otherwise, or republish, to post on servers or to redistribute to lists, requires prior specific permission and/or a fee. Conference proceedings ISBN 80-86943-03-8 WSCG’2006, January 30-February 3, 2006 Plzen, Czech Republic.
combining activities of even and odd simple cells: the modulus of the complex Gabor response (see Section 2 for definitions). Recently, models of other cortical cells have been developed, for example bar and grating cells [Petkov and Kruizinga, 1997; Santos and du Buf, 2001] and end-stopped cells [Heitger et al.,1992; Rodrigues and du Buf, 2004], the first detecting isolated bars or periodic patterns, the latter junctions and points of high curvature (keypoints).
In this paper we illustrate part of the visual representation in the visual cortex, i.e. the multi-scale line/edge coding necessary for developing a 2D model of brightness perception, and the multi-scale keypoint (vertex) representation that can be used for constructing a saliency map for modeling Focus-of-Attention (FoA). Together, these representations can be used for non-photorealistic rendering (NPR), i.e. new NPR schemes completely based on models of perception: painterly rendering by using brushes of different sizes [Hertzmann, 1998] and image stylization [DeCarlo and Santella, 2002] with LoD controlled by FoA.
2. CELL MODELS
Gabor quadrature filters provide a model of cortical simple cells. In the spatial domain (x, y) they consist of a real cosine and an imaginary sine, both with a Gaussian envelope. A receptive field (RF) is denoted by (see e.g. [Rodrigues and du Buf, 2005a]):
, ~ 2 cos 2 ~ ~ exp ) , ( 2 2 2 , , , ⎟ ⎠ ⎞ ⎜ ⎝ ⎛ + ⎟ ⎟ ⎠ ⎞ ⎜ ⎜ ⎝ ⎛ + − = ϕ λ π σ γ ϕ θ σ λ x y x y x g , sin cos ~ ; sin cos ~ x θ y θ y y θ x θ x= + = − where the
aspect ratio γ = 0.5 and σ determines the size of the RF. The spatial frequency is 1/λ, λ being the wavelength. For the bandwidth σ/λ we use 0.56, which yields a half-response width of one octave. The angle θ determines the orientation (we use 8 orientations), and φ the symmetry (0 or π/2). We apply a linear scaling between fminand fmaxwith a
few discrete scales, or hundreds of contiguous scales. The responses of even and odd simple cells, which correspond to the real and imaginary parts of a Gabor filter, are obtained by convolving the input image with the RF, and are denoted by RsE,i(x,y) and
) , (
, x y
RsOi , s being the scale and i the orientation
(
θi =iπ (Nθ−1))
and Nθ the number oforient-ations. In order to simplify the notation, and because the same processing is done at all scales, we drop the subscript s. The responses of complex cells are modelled by the modulus
( )
,{
( )
,}
{
( )
,}
2. 1 2 2 ⎥ ⎦ ⎤ ⎢ ⎣ ⎡ + = R x y R x y y x Ci iE iOThere are two types of end-stopped cells [Heitger et al., 1992], i.e. single (S) and double (D). If
[]
.+denotes the suppression of negative values, and i
i
Cˆ =cosθ and Sˆ =i sinθi, then
(
)
[
(
ˆ, ˆ)
]
; ˆ , ˆ ) , ( + + − − − + = i i i i i i i C d y S d x C C d y S d x C y x S( )
(
)
[
]
. ) ˆ 2 , ˆ 2 ( ˆ 2 , ˆ 2 , ) , ( 2 1 2 1 + + − − − + − = i i i i i i i i C d y S d x C C d y S d x C y x C y x DThe distance d is scaled linearly with the filter scale s, i.e. d = 0.6s. All end-stopped responses along straight lines and edges need to be suppressed, for which we use tangential (T) and radial (R) inhibition:
( )
[
( )
(
ˆ , ˆ)
]
; , , mod 1 2 0 mod + − = + + + − =∑
i i N i N i i N T S d y C d x C y x C y x I θ θ θ( )
[
( )
, ˆ 2 , ˆ 2 . 4 , , mod ) 2 ( 1 2 0 mod + + − = ⎥ ⎦ ⎤ ⎟ ⎠ ⎞ ⎜ ⎝ ⎛ + + − =∑
i i N N i N i i N R S d y C d x C y x C y x I θ θ θ θwhere
(
i+Nθ 2)
modNθ ⊥imodNθ .All responses of the end-stopped cells S ,
( )
xy =( )
∑
− =01 , θ N i Si x y and D ,( )
x y =∑
( )
− =01 , θ N i Di x y are inhibited by I=IT +IR for obtaining the keypointmaps KS
( )
x,y = S( )
x,y −gI( )
x,y and KD( )
x,y =( )
x y I( )
x yD , −g , , with g ≈1.0, and then the final keypoint map K
( )
x,y =max{
KS( )
x,y,KD( )
x,y}
. In the multi-scale case keypoints are detected the same way as done above, but now by using KsS( )
x,y =( )
x y I( )
x ySs , −g s , and KsD
( )
x,y = Ds( )
x,y −( )
x y Is ,g . For more details and results see
[Rodrigues and du Buf, 2005a].
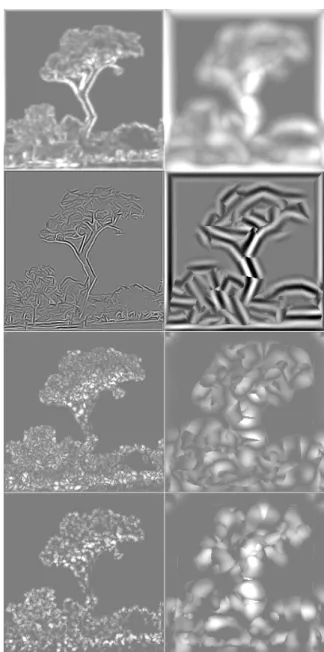
Figure 6 shows the “tree” image which will be used as reference. Figure 1 shows at the left the finest scale (λ = 4), and at the right a coarser scale (λ = 16), from top to bottom: responses of complex cells, combined even and odd simple cells, plus single and double end-stopped cells. Complex and simple cell
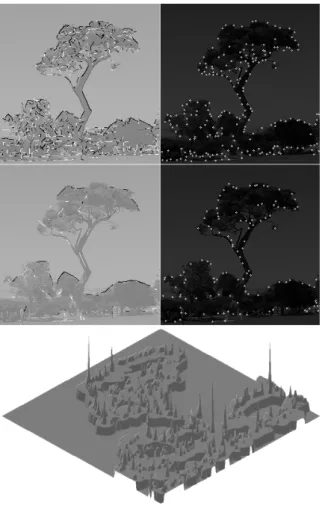
activities are only shown for the local dominant orientation, i.e. this is a selection of all cell activities. We can see that the basic cell responses are very fuzzy, without postprocessing even completely useless. Figure 2 (upper part) shows four event maps at the same two scales λ = 4 (top) and λ = 16 (bottom). Despite the fuzzy responses of end-stopped cells (Fig. 1), the inhibition process leads to precise detection of keypoints, even at coarse scales. Figure 2 (left) shows line/edge maps, i.e. the positions of detected lines and edges and the event type, for example positive line or negative edge, coded by gray level and superimposed on the input image. Not shown in Fig. 2 are line/edge orientation and amplitude.
A detailed description of line and edge detection is beyond the scope of this paper, hence we refer to [van Deemter and du Buf, 1996)] and [Rodrigues and du Buf, 2004]. The basic idea is the following: a local maximum of responses of complex cells gives a first, but normally inaccurate estimate of the position. The near zero-crossing of even or odd simple cells is much more precise, and the combination of even and odd simple cells’ local extremum (max or min) and zero-crossing determines what there is, for example a negative line or a positive edge [du Buf, 1993]. The four maps shown in Fig. 2 represent event cells, i.e. cells which only respond when at their retinotopic position there is a line, an edge or a vertex in the visual input. Line/edge orientation and scale are coded by different cells, and the activity of each cell reflects the amplitude of the underlying line or edge through the response of the corresponding complex cell. This symbolic representation or neural code is used at higher levels in the visual cortex, for brightness perception (see next section) and object detection and recognition.
Keypoint cells are binary, i.e. they respond or they don't. An analysis over many scales showed that keypoints are stable at important structures, i.e. local image complexity, that the stable scale intervals indicate the scale of the structures, and that they can be used for object and face detection [Rodrigues and du Buf, 2005a; Rodrigues and du Buf, 2005b]. In addition, since local image complexity provides very important information for planning fixation points and saccades of the eyes, keypoints are thought to play a significant role in Focus-of-Attention by means of a saliency map [Rodrigues and du Buf, 2005a].
If we assume that retinotopic projection is maintained throughout the visual cortex, the activities of all keypoint cells at the same position (x,y) can be easily summed over scale s, which leads
to a very compact, single-layer map. At the positions where keypoints are stable over many scales, this summation map will show distinct peaks at centers of objects, important sub-structures and contour landmarks. The height of the peaks can provide information about the relative importance. In addition, this summation map, with some simple processing of the projected trajectories of unstable keypoints, like a dynamic lowpass filtering related to the scale and non-maximum suppression [Rodrigues and du Buf, 2005a], might solve the segmentation problem: the object center is linked to important sub-structures, and these are linked to contour landmarks. Such a mapping or data stream is data-driven and bottom-up, and could be combined with top-down processing from inferior temporal cortex (IT) in
Figure 1. Top to bottom: responses of complex, simple, and single and double
order to actively probe the presence of certain objects in the visual field [Deco and Rolls, 2004]. In addition, the summation map with links between the peaks might be available at higher brain areas where serial processing occurs for e.g. visual search. Apart from detected keypoints at two scales, Fig. 2 also shows a projected saliency map obtained over a big scale interval (λ = [4, 32]; λΔ = 1). This map contains distinct peaks at positions where keypoints are stable over scale intervals, and the lowpass filtering coupled to the scale of driving complex cells leads to regions which connect the peaks. It has been shown that such a saliency map corresponds to the map of fixation points as measured by eye tracking during inspection of faces [Rodrigues and du Buf, 2005b].
3. MULTI-SCALE LINE/EDGE
RE-PRESENTATION AND BRIGHTNESS
There are very few models for explaining brightness perception and illusions like Mach bands [Pessoa, 1996]. One brightness model [du Buf, 1994; du Buf and Fischer, 1995] assumes that lines and edges are
detected at all possible scales, and that these are interpreted symbolically: a responding “line cell” implies that, at the cell’s retinotopic position, there is a line with a certain orientation, amplitude and scale, i.e. a Gaussian profile with a size that depends on the scale of the underlying simple and complex cells. The same happens in the case of an “edge cell,” but with a bipolar Gaussian-windowed error-function profile (see Fig. 3). It is important to stress that the interpretation of all responding line and edge cells leads to a virtual representation of the input image, i.e. there is no cell layer in which all the information is summed in order to create a retinotopic brightness map1. The fact that responses of simple cells are the
same in the case of lines and ramp edges leads to an elegant explanation of Mach bands [du Buf, 1994], and an extended model was shown to explain also brightness induction (simultaneous contrast and assimilation) and other illusions [du Buf and Fischer, 1995]. This model is being extended from 1D to 2D, which involves complicating factors like the size of receptive fields in the case of curved lines and edges, see [van Deemter and du Buf, 1996]. In future models it may be possible to exploit end-stopped and keypoint cells in order to model transparency. Figure 4 shows two opposite brightness induction effects and preliminary model predictions. In simultaneous brightness contrast, the circles, which are physically the same under homogeneous
1 This would require yet another “observer” inside our
brain.
Figure 3. Symbolic brightness interpretation of positive and negative lines (top row) and positive and negative edges (bottom row) at
the finest scale.
Figure 2. Top: event maps with detected lines and edges (left) and keypoints (right) at two
illumination, appear different because the background pushes brightness in the opposite direction, i.e. the circles to the left appear brighter and the ones to the right darker. In assimilation, the flanking black and white bars pull the brightness of the gray bars, which also are physically equal, in the same direction: the left bars appear darker than the right bars.
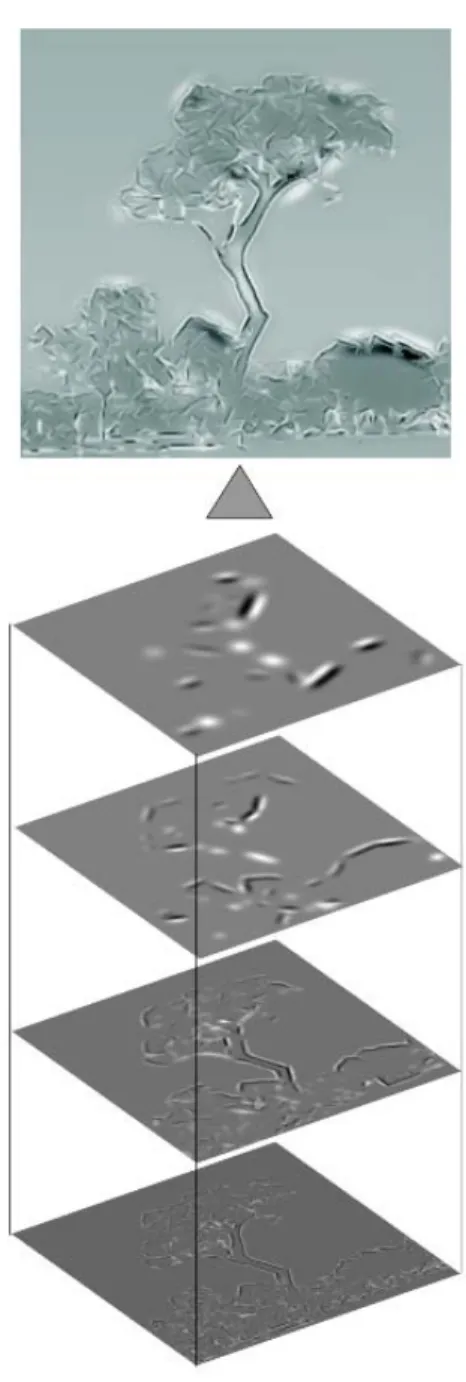
Model predictions shown in Fig. 4, which agree with our brightness impression, are based on mixing one lowpass-filtered image providing a global background, with weighted contributions from the symbolic line and edge representations. This is shown in Fig. 5, which illustrates the application of visual reconstruction to NPR. The top image is obtained by summing a lowpass-filtered version of the tree image and detected lines and edges at four scales: event positions (Fig. 2) and line/edge profiles (Fig. 3). Comparing Fig. 6 (top) with the reconstruction (top Fig. 5) we can see that the latter is not perfect. This due to the fact that only four scales have been used.
4. NON-PHOTOREALISTIC
RENDERING
A perfect reconstruction is not a goal in NPR. The idea is to create an image that looks like an input image, but with an artistic twist. For example, Hertzmann (1998) simulated painting with (spline) brush strokes, the sizes of the brushes being linked to the sizes of Gaussian kernels used in lowpass
filtering the input image. Our brightness model on the basis of symbolic line/edge representation provides a perceptually justified alternative: a line is a sequence of positions with intensities, the profile (scale) being truncated by a Gaussian function. In other words, the profile can be seen as a brush and the sequence of positions as a stroke. In addition, rendering can be combined with image stylization [DeCarlo and Santella, 2002] in which our model of FoA, a saliency map as shown in Fig. 2, can be used to select brush strokes (line/edge scales) dynamically: small brushes only at positions with peaks caused by local image complexity. The latter
Figure 5. Multi-scale NPR of the tree image based on one lowpass filter and four line/edge scales. The bottom image is the
sum of the four images shown in Fig. 3. Figure 4. Brightness illusions. Top-left:
simultaneous brightness contrast. Bottom-left: assimilation. All circles (top) and gray bars (bottom) have the same reflectance but
idea has not yet been implemented (see also Discussion). Here we show a few results obtained with the method applied to reconstruct the tree image (Fig. 5), i.e. lowpass filtering plus four line/edge scales.
Figure 6 (top) shows the tree image in color, and a simulated oil canvas produced with Linux GNU tool GIMP. The images used for rendering this scene are shown in Fig. 5. Because our models are restricted to grayscale (color perception may be added later), we picked a few colors of the input image to create RGB lookup tables and color gradients for the rendering layers. The result was obtained with no manual editing. The canvas texture is a basic GIMP feature. As can be seen, the result is an impressionist view of the tree image, in which global structures (trees, lawn) are preserved but not in detail.
Figure 7 shows a picture taken across a Venice (Italy) canal. Instead of an oil canvas, we tried to obtain a watercolor rendering of type “Turner in Venice.” Like Turner, we used very unsaturated and diffuse colors, and the contrast of the input lines and edges was reduced. In contrast with the rendering of the tree image, manual editing was necessary in order to approximate Turner’s style in the sky and water. A more realistic rendering of Turner’s textures (windows, facades) is probably only possible by substituting the line and edge representation by real, discrete brush strokes in combination with wet-in-wet painting. However, it should be stressed that the NPR is entirely based on the information present in the input image. We cannot (yet) simulate the hand of the painter while painting fine, repetitive structures and textures.
Figure 8 shows the Fiona image with NPR. No manual editing was applied, and the typical crayon effect was added by Corel’s Photo-Paint standard “impressionist” filter.
Figure 9 shows a first result obtained with painterly rendering and discrete brush strokes. The image was created in two steps. First, a background was created on the basis of lowpass-filtered RGB components. Big, elliptical brush strokes were applied at random positions and with random orientations. Three colors were picked, at the center of the stroke and at the two end points. If the color at one end point deviated significantly from the average of the other two colors, the brush stroke was not applied. This prevents from introducing wrong colors in areas where no line/edge information is available, for example in the sky close to the tree. This process was repeated until the entire background image was covered. The brush strokes cannot be seen in the sky,
Figure 8. Simulated crayon. Figure 7. Simulated watercolor.
because of the very small gradient. Second, line and edge representations (Fig. 3) were converted into discrete brush strokes, by splitting long lists of (x,y) positions into smaller lists, such that the aspect ratio of the brush strokes was about the same at different scales (brush sizes). Lines were rendered with single-color strokes, whereas edges were rendered with two, parallel strokes. The color of each stroke was picked in the unfiltered input image, at the center of the stroke. This process was applied from coarse to fine scales, each stroke substituting previously rendered colors (painting wet-on-dry). All brush strokes, including those for creating the background, were modeled by triangle lists in combination with opacity in the alpha channel, for obtaining a spray-like effect, using standard features of OpenGL. Figure 9 shows that the final result approaches the effect of a real painting, for example in the tree top. In this first result we already applied color equalization by the ACE model, but not yet saliency maps for stylization (see below).
5. DISCUSSION
A set of Gabor filters with suitably chosen characteristics in combination with one lowpass filter, such that the sum of all transfer functions is about constant over the entire frequency domain, can be seen as a linear allpass filter and allows to reconstruct the input image. This idea is exploited in image coding by (Gabor) wavelet transforms. Our visual system does not reconstruct the input image in the same way, i.e. by summing responses of simple cells. Our visual system does not even construct a virtual representation of the entire visual field, see change blindness and the limited capacity of the attentional system [Rensink, 2000]. The what and where systems serve object detection and are based
on feature-extraction engines in area V1 and higher areas.
In this paper we illustrated a few, basic processing steps and cell models in V1. We also showed that one brightness model that is based on a symbolic line and edge representation can be used for non-photorealistic rendering with many possibilities. However, our goal is photorealistic rendering in the sense of developing a 2D or even 3D brightness model that is capable of predicting psychophysical data and visual illusions like Mach bands and brightness induction (simultaneous contrast and assimilation). Figure 5 shows the tree image (re)constructed by assuming a lowpass filter in combination with a multiscale summation of line and edge representations, but without using nonlinear amplitude transfer functions for the different scales associated with nonlinear brightness perception [du Buf and Fischer, 1995].
The NPRs of the tree image (Figs 6, 9), as for the simulated watercolor and crayon (Figs 7, 8), are preliminary results to show some possibilities of our approach, i.e. they are probationes pennae or pen tests. The next step will be to optimize the rendering process such that results cannot be distinguished from real paintings, using real brush strokes in the line of Hertzmann's (1998) painterly rendering. Long brush strokes can be modeled by splines, and these can be modified by splitting them into short, randomized strokes, or they can be linearized, in order to create impressionist or expressionist renderings. Gestalt theory, as applied in symbolic pointillism [Krüger and Wörgötter, 2003], can be used to retain crucial image information. This idea is strongly linked to image stylization and abstraction [DeCarlo and Santella, 2002], but instead of recording eye movements it will be possible to exploit our keypoint-based saliency map to control the Level-of-Detail by selecting brush sizes on the basis of local image complexity. Few but vivid colors are often used in cartoon- or comics-like renderings, such as those shown by DeCarlo and Santella, and a recent model of color constancy called ACE (Automatic Color Equalization) [Rizzi et al., 2003] can be used to convert dull colors into vivid ones. There are numerous ideas for creating NPRs [Sousa, 2003].
Non-photorealistic rendering is a spin-off and can, preferably in collaboration with artists and specialists of color perception, be used to develop new “filters” for tools like GIMP and PaintShop. However, instead of applying a certain effect at all image positions, like GIMP’s randomized brush strokes that can be influenced by image intensity or the canvas texture used in the tree image, more intelligent filters can be Figure 9. Painterly rendering.
developed. For example, developing a “Seurat filter” might be relatively straightforward because of the fine brush strokes (“sampling”), but a “van Gogh filter” requires, apart from knowledge about brushes and colors, deep insight into his cognitive perception [Zeki, 2000; Livingstone, 2000]. Nevertheless, our method may provide the basis for a systematic study of the emotional impact of different rendering techniques [Halper et al., 2003; Healey and Enns, 2002] and the importance of aspects like 3D cues, color and texture [Kjelldahl, 2003]. In addition, instead of applying NPR to color images, it is possible to explore other data sets, with the goal of highlighting specific data structures: layers of multidimensional data sets can be visualized by means of perceptually based brush strokes [Healey et al., 2004].
6. ACKNOWLEDGMENTS
This research is partly financed by PRODEP III Medida 5, Action 5.3, and by the FCT program POSI, framework QCA III.
7. REFERENCES
DeCarlo, D. and Santella, A. (2002) “Stylization and Abstraction of Photographs”. Proc. SIGGRAPH 2002, pp. 769-776.
Deco, G. and Rolls, E. (2004) “A neurodynamical cortical model of visual attention and invariant object recognition”.Vision Res., (44):621–642. du Buf, J. (1993) “Responses of simple cells: events,
interferences and ambiguities”. Biol. Cybern., 68:321–333.
du Buf, J. (1994) “Ramp edges, Mach bands, and the functional significance of the simple cell assem-bly”. Biol. Cybern.,70:449–461.
du Buf, J. and Fischer, S. (1995) “Modeling bright-ness perception and syntactical image coding”. Optical Eng. 34(7):1900–1911.
Halper, N. et al. (2003) “Towards an understanding of the psychology of non-photorealistic render-ing”. Comp. Visualistics, Media Informatics, and Virtual Communities, Vol. 11, pp. 67–78. Healey, C. and Enns, J. (2002) “Perception and
painting: A search for effective, engaging visuali-zations”. IEEE Comp. Gr. Appl., 22(2):10–15. Healey, C. et al. (2004) “Perceptually based brush
strokes for non-photorealistic visualization”. ACM Trans. Graphics, 23:64–96.
Heitger, F et al. (1992) “Simulation of neural con-tour mechanisms: from simple to end-stopped cells”. Vision Res., 32(5):963–981.
Hertzmann, A. (1998) Painterly rendering with curv-ed brush strokes of multiple sizes. Comp. Graphics Proc. (SIGGRAPH 98), pp. 453–460. Kjelldahl, L. (2003) “A survey of some perceptual features for computer graphics and visualiza-tion”. Annual SIGRAD Conf., Umea Univ., Swe-den, Linkoping Conf. Proc. ISSN 1650-3686. Krüger, N. and Wörgötter, F. (2003) “Symbolic
pointillism: Computer art motivated by human perception”. Proc. Symp. Artif. Intell. Creativity in Arts and Science – AISB 2003, pp. 36–40. Livingstone, M. (2000) “Vision and art: the biology
of seeing”. Abrams, New York (NY).
Pessoa, L. (1996) “Mach bands: how many models are possible? Recent experimental findings and modeling attemps”. Vision Res., 36:3205–3227. Petkov, N. and Kruizinga, P. (1997) Computational models of visual neurons specialised in detection of periodic and aperiodic visual stimuli”. Biol. Cybern., 76:83–96.
Rensink, R. (2000) “The dynamic representation of scenes”. Visual Cognition, 7(1-3):17–42. Rizzi, A., Gatta, C. and Marini, D. (2003) A new
algorithm for unsupervised global and local color correction. Patt. Recogn. Lett., 24:1663-1677. Rodrigues, J. and du Buf, J. (2004) “Visual cortex
frontend: integrating lines, edges, keypoints and disparity”. Proc. Int. Conf. Image Anal. Recogn., Springer LNCS 3211, pp. 664–671.
Rodrigues, J. and du Buf, J. (2005a) “Multi-scale cortical keypoint representation for attention and object detection”. 2nd Iberian Conf. Patt. Recogn. Im. Anal., Springer LNCS 3523, 255-262. Rodrigues, J. and du Buf, J. (2005b) “Multi-scale
keypoints in V1 and face detection”. 1st Int. Symp. Brain, Vision and Artif. Intell., Springer LNCS 3704, 205-214.
Santos, L. and du Buf, J. (2001) “Improved grating and bar cell models”. 7th Neural Computing in Psychology Worksh., Brighton, Sept. 17-19. Sousa, M. Theory and practice of non-photorealistic
graphics: Algorithms, methods, and production systems. Course Notes for SIGGRAPH 2003 http://pages.cpsc.ucalgary.ca/˜mario/.
van Deemter, J. and du Buf, J. (1996) “Simultaneous detection of lines and edges using compound Gabor filters”. Int. J. Patt. Recogn. and Artif. Intell., 14(6):757–777.
Zeki, S. (2000) “Inner vision: an exploration of art and the brain”. Oxford Univ. Press.