YIC2013
Second ECCOMAS Young Investigators Conference 2–6 September 2013, Bordeaux, France
Biaxial seismic behaviour of reinforced concrete columns
H. Rodrigues
a,*, H. Varum
a, A. Arêde
bb Civil Engineering Department, University of Aveiro, Aveiro, Portugal
3810-193 Aveiro, Portugal
b
Civil Engineering Department, Faculty of Engineering, University of Porto 4200-465 Porto, Portugal
* hrodrigues@ua.pt
Abstract. The present work focuses on the assessment of the structural response of RC columns under
bidirectional horizontal loads in three main streamlines. First, an experimental testing campaign was performed on rectangular columns, for different types of loading. Subsequently, the tested columns were simulated with different non-linear modelling strategies. Finally, a simplified hysteretic model is proposed for the representation of the non-linear response of RC members subjected to biaxial bending.
Keywords: RC columns; cyclic behaviour; biaxial experimental testing; refined non-linear modelling; simplified
non-linear modelling
1 INTRODUCTION
The importance of studies addressing the 3D earthquake actions or to building irregularities, which induce a biaxial bending demand combined with axial load in the columns. is well recognised Different modelling strategies have been proposed for the simulation of the biaxial cyclic behaviour of RC elements with axial force. However, it is believed that the available biaxial models are not mature enough to be used in practice. The present study, based on an extensive experimental campaign and on the analysis of existent modelling strategies proposes an upgraded simplified model for the representation of the biaxial bending response of columns with axial force, which is based in an existing uniaxial model.
2 EXPERIMENTAL CAMPAIGN
In the experimental campaign were tested 24 rectangular RC columns with different types of geometric characteristic and reinforcement detailing and were cyclically tested for different loading histories with a constant axial force and under displacement controlled conditions. The cross-section dimensions and the reinforcement detailing are presented in Figure 1.
a) b) c)
Figure 1: Testing setup: a) RC column specimen dimensions and reinforcement detailing; b) General view; c) Global results of rectangular column PB12-N07 for rhombus load path
The experimental results show that the initial column stiffness was not significantly affected by the biaxial load path. The maximum strength of the columns were lower for all biaxial tests compared with those for the
hal-00855921, version 1 - 30
corresponding uniaxial tests. The ultimate ductility was significantly reduced in columns subjected to biaxial load paths. The strength degradation increases after displacement ductility demands of about 3 and it the equivalent global damping for columns tested biaxially is clearly dependent on the load path [5].
3 EFFICIENCY OF DIFFERENT NON-LINEAR MODELLING STRATEGIES
The numerical analyses developed and described in the present paper with different non-linear modelling strategies were performed using the computer program. In this work three non-linear modelling strategies were applied to each column specimen and the obtained results were compared, based on: elements with lumped-plasticity; elements with distributed inelasticity and force-based formulation; and elements with distributed inelasticity and displacement-based formulation.
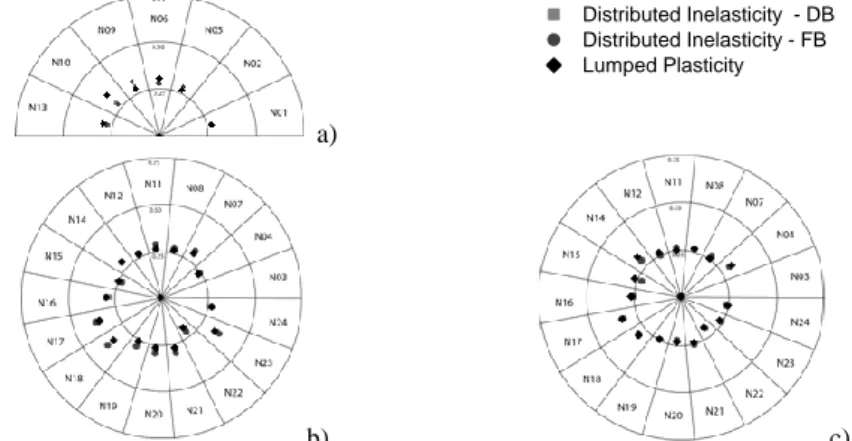
In order to evaluate the accuracy of the numerical models studied in the representation of the shear force evolution obtained experimentally, the frequency domain error (FDE) index was calculated. The FDE index measures the deviation between two waveforms (quantifies amplitude and phase deviations between two signals, giving an error factor between 0 and 1), in this case the shear force measured in the test and the corresponding calculated shear force for each modelling strategy. It is considered that a FDE index larger than 0.75 represents a poor correlation. The FDE indices obtained for all analyses are represented in Erreur ! Source du renvoi introuvable..
a)
Distributed Inelasticity - DB Distributed Inelasticity - FB Lumped Plasticity
b) c)
Figure 2: FDE index obtained from the comparison between numerical and experimental shear force evolutions: a) uniaxial tests; b) biaxial tests – strong direction (X); c) biaxial tests – weak direction (Y)
From the analysis of the obtained results, similar levels of adequacy were verified using the distributed inelasticity (force and displacement formulations) and the lumped plasticity modelling strategies. However, based on the comparisons made the following comments can be drawn: The initial stiffness obtained with all the modelling strategies for the simulation of the biaxial tests presents differences, when compared with the experimental values, in the range of 25% to 50%. The secant stiffness evolution of the columns was accurately represented with all modelling strategies. However, considerable differences were observed, for all modelling strategies, between the numerical and experimental tangent stiffness evolutions, mainly for the lower drift demands and in the last phase of the columns’ responses. This aspect confirms the difficulties normally found in representing numerically the response of columns with models based on incremental procedures, which depend on the tangent stiffness. The cyclic response obtained with the three modelling strategies for all columns was found to be satisfactory, but difficulties were found in capturing the strength degradation for the higher drift demands. Also, the majority of the models show limitations in representing the pinching effect in the unloading-reloading stage.
All modelling strategies exhibit difficulties in the representation of the energy dissipation evolution. The main differences correspond to an underestimation of the dissipated energy for lower drift demands associated with a quasi-linear numerical response and to an overestimation for higher demands associated with the limitations of the numerical models in the representation of the strength degradation and pinching effect.
4 SIMPLIFIED HYSTERETIC MODEL FOR BIAXIAL BENDING RESPONSE
4.1 Uniaxial Model and the biaxial Bouc-Wen model
For the development and validation of the simplified biaxial model, the Costa-Costa uniaxial hysteretic model [1] was adopted. This model represents a generalisation of the original Takeda model with a trilinear skeleton curve for monotonic loading, defined by the cracking point and the yield point, and includes pinching, stiffness degradation and strength degradation effects.
hal-00855921, version 1 - 30
The biaxial construction of the Bouc-Wen model in the Wang and Wen [2] form follows the same general idea as for the uniaxial case. The restoring forces for both directions are defined by:
y y y y y y y y x y x x x x x x Z F 1 u K F Z F 1 u K F , with y y x x 1 n x y x y y 1 n y y y y y y x y y 1 n y x y x x 1 n x x x x x u Z u sign Z Z u Z u sign Z Z u u A Z u Z u sign Z Z u Z u sign Z Z u u A Z (3.1)in which the involved parameters have the same meaning as for the uniaxial case, but are now referred to the two orthogonal directions X and Y, by the subscripts x and y respectively. The hysteretic parameters Zx and Zy are then defined by the following coupled differential equations.
Considering now the definition of the incremental orthogonal forces Fxi and Fyi given by, the first part of this
system can be written, by a simple mathematical transformation, as:
i i i i i i i i i i i i i i i i y y 1 n y y y y y y y y y y x x 1 n x x x x x x x x x x Z u sign Z Z u u A K 1 u K F Z u sign Z Z u u A K 1 u K F (3.2)
which matches to the uniaxial incremental restoring forces calculated for each direction without biaxial interaction,
and the part of the system that corresponds to the correction factors Cfxi and Cfyi accounting for the interaction
between the two loading directions:
i i i i i i i i i i i i x x 1 n x y x y y fy y y 1 n y x y x x fx Z u sign Z Z u K 1 C Z u sign Z Z u K 1 C (3.3)
Considering that the incremental forces can be obtained with any uniaxial hysteretic model, the presented framework introduces a simple and flexible form to represent biaxial bending in columns. This formulation requires the same information needed for the corresponding uniaxial PWL model, only introducing an additional correction
term which couples the two loading directions ().
i i i i i i fy y uni y fx x uni x C F F C F F (3.4)
4.2 Parameter identification for the scaling interaction factor
Aiming at calibrating the parameters for the hysteretic biaxial model based on uniaxial models with an interaction function, a gradient based-method was adopted, sequentially associated with an evolutionary algorithm method. For the application of these models, the SDL/SiDoLo optimisation lab computer program was used [3].
The calibration of the interaction function was performed in two phases. In the first phase, it was intended to select
the analytical expression-type most suitable for the interaction scaling factor () function. After the expression type
selection, the second phase, consists in the calibration of the parameters of the interaction function as well as of the
interaction scaling factor. After an expression of the scaling factor (), which depends on the column properties, the
interaction function parameters were optimized for all biaxial pushover curves, using a cascade optimization strategy. The convergence evolution of the cascade optimization strategies in the parameter identification are presented in Erreur ! Source du renvoi introuvable.. Erreur ! Source du renvoi introuvable. shows the plot of the Relative Global Error for two situations, with and without considering the interaction function..
0 500 1000 1500 2000 1.0x10⁷ 1.2x10⁷ 1.4x10⁷ 1.6x10⁷ 1.8x10⁷ 2.0x10⁷ 2.2x10⁷ 2.4x10⁷ 2.6x10⁷ Q ua dr at ic e rr or Iterations/ Generations LM+EA+LM 0 20406080100120140160180200 1.0x10⁷ 1.2x10⁷ 1.4x10⁷ 1.6x10⁷ 1.8x10⁷ 2.0x10⁷ 2.2x10⁷ 2.4x10⁷ 2.6x10⁷ LM
Figure 3: Convergence evolution of the cascade optimization 0 50 100 150 200 250 0 50 100 150 200 250 300 350 400 450 500
With interaction function optimized - 11.25º With interaction function optimized - 22.50º With interaction function optimized - 45.00º With interaction function optimized - 67.50º With interaction function optimized - 78.75º Without interaction function - 11.25º Without interaction function - 22.50º Without interaction function - 45.00º Without interaction function - 67.50º Without interaction function - 78.75º
R el a ti ve G lo b a l E rr o r in d ir ec ti o n Y ( % )
Relat ive Global Error in direct ion X (%)
Figure 4: Relative Global of the simplified model results, with and without interaction function
Erreur ! Source du renvoi introuvable. includes selected examples of pushover curves for different columns and
different pushover loading angles. In each plot, for both directions, the obtained pushover curves are represented: i) by the refined numerical fibre model; ii) by the simplified model without the biaxial bending interaction function; and iii) by the simplified model but with the interaction function. Also, the examples in Erreur ! Source du renvoi
hal-00855921, version 1 - 30
introuvable. confirm the error reductions, in both column directions, obtained by adopting the interaction function
combined with the optimized scaling factor.
0.00 0.01 0.02 0.03 0.04 0.05 0 50 100 150 200 250 300 350 400 M22 30x60cm2 = 0.1 As = 1.5% Ac Pushover - 45o B as e Sh ea r (k N ) Horizontal Displacement (m) Fibre model (X direction) Fibre model (Y direction) Original (X) Original (Y) Optimized solution (X) Optimized solution (Y)
0.00 0.01 0.02 0.03 0.04 0.05 0 50 100 150 200 250 300 350 B as e Sh ea r (k N ) Horizontal Displacement (m) Fibre model (X direction) Fibre model (Y direction) Original (X) Original (Y) Optimized solution (X) Optimized solution (Y)
M16 30x50cm2 = 0.1 As = 1% Ac Pushover - 22.5o 0.00 0.01 0.02 0.03 0.04 0 50 100 150 200 250 300 350 M14 30x50cm2 = 0.2 As = 1.5% Ac Pushover - 45o B as e Sh ea r (k N ) Horizontal Displacement (m) Fibre model (X direction) Fibre model (Y direction) Original (X) Original (Y) Optimized solution (X) Optimized solution (Y)
Figure 5: Examples of pushover curves for different columns and different pushover loading angles. For the validation of the proposed simplified model with interaction functions, the experimental results of cyclic tests were used of the test campaign [4, 5]. First, the uniaxial tests were modelled in order to obtain the primary skeleton curves for each independent direction. Then, using the obtained curves, the biaxial tests were simulated and the results of the numerical model with the interaction function are compared with the test results. For columns under biaxial loading the strength degradation is difficult to represent, particularly for the last cycles of the experimental response. The energy dissipation evolution is also well represented. In general, a good agreement between the predicted numerical results and the experimental hysteretic response was observed, indicating that the proposed strategy may be suitable to simulate the response of columns to biaxial loading based on uniaxial behaviour curves associated with properly calibrated coupling interaction functions.
Figure 6: Base-shear versus drift of column N15 – Biaxial test, quadrangular displacement pattern
5 CONCLUSIONS
From the experimental results, it was clear the effects of the biaxial loading and its importance in the column response, especially in terms of the strength degradation and reduction of the ductility capacity.
With the three refined numerical strategies studied, similar level of accuracy was verified. The three modelling strategies revealed limitations in the representation of the strength degradation, particularly for larger drift demands, which justifies the poor estimation of the energy dissipation evolution with the numerical models.
A simplified interaction model was proposed, based on an uniaxial hysteretic model and the interaction function developed from the Bouc-Wen model. The validity of the proposed simplified model was demonstrated through the analytical simulation of the response of the RC columns biaxially tested. The obtained numerical results showed the model efficiency, which encourages further validation to become a simple tridimensional tool to simulate biaxially loaded RC elements.
REFERENCES
[1] A. C. Costa and A. G. Costa, "Hysteretic model of force-displacement relationships for seismic analysis of
structures," National Laboratory for Civil Engineering, Lisbon, 1987.
[2] C. H. Wang and Y. K. Wen, "Evaluation of pre-Northridge low-rise steel buildings. I: Modelling " J.
Struct. Eng., ASCE, V. 126(10), 1160-1168., 2000.
[3] A. Andrade-Campos, "Development of an Optimization Framework for Parameter Identification and
Shape Optimization Problems in Engineering," International Journal of Manufacturing, Materials, and
Mechanical Engineering (IJMMME), vol. 1, pp. 57-79, 2011.
hal-00855921, version 1 - 30
[4] H. Rodrigues, A. Arêde, H. Varum, and A.G. Costa, "Experimental evaluation of rectangular reinforced Concrete column behaviour under biaxial cyclic Loading," Earthquake Engineering and Structural
Dynamics, John Wiley & Sons, Ltd. 2012.
[5] H. Rodrigues, "Biaxial seismic behaviour of reinforced concrete columnns," PhD Thesis PhD, Civil
Engineering Department, University of Aveiro, Aveiro, 2012.