Pancreatic neuroendocrine tumors: correlation
between histogram analysis of apparent
diffusion coefficient maps and tumor grade
Jose Antonio Sousa Pereira,
1Elsa Rosado,
2Maria Bali,
3Thierry Metens,
3Shih-Li Chao
4 1Department of Radiology, Centro Hospitalar de Lisboa Central, Lisbon, Portugal
2
Department of Radiology, Hospital Fernando Fonseca, Amadora, Portugal
3Department of Radiology, Hoˆpital Erasme, Universite´ Libre de Bruxelles, Brussels, Belgium 4Department of Radiology, Institut Jules Bordet, Universite´ Libre de Bruxelles, Brussels, Belgium
Abstract
Purpose: To explore the role of histogram analysis of apparent diffusion coefficient (ADC) MRI maps based on entire tumor volume data in determining pancreatic neuroendocrine tumor (PNT) grade.
Methods and Materials: Retrospective evaluation of 22 patients with PNTs included low-grade (G1; n = 15), intermediate-grade (G2; n = 4), and high-grade (G3; n= 3) tumors. Regions of interest containing the lesion were drawn on every section of the ADC map containing the tumor and summated to obtain histograms for entire tumor volume. Calculated histographic parameters included mean ADC (mADC), 5th percentile ADC, 10th percentile ADC, 25th percentile ADC, 50th per-centile ADC, 75th perper-centile ADC (ADC75), 90th percentile ADC (ADC90) and 95th percentile ADC (ADC95), skewness and kurtosis. Histogram parameters were correlated with tumor grade by repeated measures analysis of variance with Tukey–Kramer post hoc comparisons.
Results:The mADC, ADC75, ADC90, and ADC95 were significantly higher in G1 tumors (1283 ± 267; 1404 ± 300; 1495 ± 318; 1562 ± 347 9 10-6mm2 /s) compared to G2 (892 ± 390; 952 ± 381; 1036 ± 384; 1072 ± 374 9 10-6 mm2 /s) and to G3 tumors (733 ± 225; 864 ± 284; 1008 ± 288; 1152 ± 192 9 10 -6
mm2/s) (p value <0.05). Skewness and kurtosis were significantly different between G1 (0.041 ± 0.466; 2.802 ± 0.679) and G3 (1.01 ± 1.140; 5.963 ± 4.008) tumors (p value <0.05). Tumor volume (mL) was significantly higher on G3 (55 ± 15.7) compared to G1
(1.9 ± 2.7) and G2 (4.5 ± 3.6) tumors (p value <0.05). In this small sample size, we did not detect statistically significant parameters between G2 (n = 4) and G3 (n = 3) tumors.
Conclusions:Histographic analysis of ADC maps on the basis of the entire tumor volume can be useful in differentiating histologic grades of PNTs.
Key words: Pancreatic—Neuroendocrine— Histogram—ADC
Pancreatic neuroendocrine tumors (PanNET) are a rare group of heterogeneous tumors which represent only 1– 2% of all pancreatic neoplasms [1] and have an estimated incidence rate in several population studies of <1% [2]. However, in the last 20 years, its incidence has increased and this is thought to be due to increased awareness, improved diagnostic imaging modalities, and a revision of the definition [1,3,4].
In 2010, the World Health Organization (WHO) adopted a grading system (G1, G2, and G3) based on the mitotic count per square millimeter of tumor and the Ki-67 index, that was created by the European Neuroen-docrine Tumor Society (ENETS) [5,6] (Table1). In this system, well-differentiated PanNET (WDNET) are di-vided into low grade (G1) and intermediate grade (G2), while the high grade (G3) refers to poorly differentiated neuroendocrine carcinoma (PDNEC). Studies have shown the usefulness of this grading system, as some of the well-differentiated tumors with higher proliferative index (G2) seem to have worse prognosis than PanNET with lower proliferative index (G1) [6, 7]. It has been shown that this grading system is a valid tool for
prog-Correspondence to:Jose Antonio Sousa Pereira; email: pereirajosean-tonio@outlook.com
nostic stratification in clinical practice and research [8,9]. The choice of treatment depends not only on the symp-toms, stage of disease, degree of uptake of radionuclide but also on tumor grade [10]. For example, treatment with somatostatin analogs are indicated only in G1/G2 tumors, therefore, pre-treatment grading of the tumor is considered essential [10].
Magnetic resonance (MR) imaging is one of the rec-ommended imaging modalities for the detection of sus-pected PanNET [10]. Diffusion-weighted MR imaging (DW-MRI) allows non-invasive assessment of biological tissues based on the molecular motion of water molecules in the extracellular, intracellular, and the intravascular spaces. In tissues, such as tumors characterized by high cellular density, increased tortuosity of the extracellular space and high density of hydrophobic cellular mem-branes restricted diffusion is seen [11–13].
Apparent diffusion coefficient (ADC) maps have been used to characterize tumoral tissues. These maps provide a quantitative index of water diffusivity for each voxel, allowing visualization of molecular diffusion in the dif-ferent tissue compartments and providing indirect infor-mation on its microstructure [11]. Recently, there has been growing interest in the histogram analysis of ADC of the entire tumor volume, as this approach provides quantita-tive information on the distribution and frequency of ADCs and consequently on the heterogeneity of water molecules diffusivity within the whole tumor [14–17]. The histogram-based ADC analysis has shown capabilities in differentiating and grading brain tumors [14–16], and in the prediction of uterine cervical cancer recurrence [18,19]. Previous studies have evaluated the correlation of ADC with histopathologic characteristics of PanNET [12,13,20]. However, these studies were based on regions of interest (ROI) placed on a representative section of the tumor, which does not reflect in detail the histological features of the tumor, something that might be paramount for Pan-NET, as treatment choice depends on these features [10].
To our knowledge, there are no previous reports of volume-based histogram analysis of ADC to differentiate PanNET grades. Therefore, the purpose of this study was to assess if histogram analysis of ADC from the entire tumor volume allows differentiation of the histo-logical grades of PanNETs.
Materials and methods
This retrospective study was approved by the institu-tional review board and a waiver of informed consent was obtained.
Study population
From the clinical records of our institution, we identified 33 patients with histological proven PanNET who underwent abdominal MR imaging between 2007 and 2012.
The inclusion criteria consisted of MR examinations including DW-MR performed within a delay of 30 days before surgery.
Nine patients were excluded because MR was not performed before surgery. Two patients were excluded because the PanNET was intra-ductal. Finally, 22 patients were included: 19/22 (86%) had PanNET histo-logical confirmation after surgical excision and 3/22 (14%) had histological confirmation based on endoscopic biopsy samples (2 patients did not undergo surgery due to the presence of metastatic disease at the diagnosis and 1 patient refused surgery).
MR imaging technique
Among the 22 patients, 18/22 (82%) were investigated on a 1.5T magnet (Achieva, Philips Health System, Best, The Netherlands) and 4/22 (16%) patients were scanned on a 3T magnet (Achieva Multitransmit, Philips Health System, Best, The Netherlands). In both systems, a 16 channel re-ceived coil was used. All patients were imaged after 4 h fasting in the supine position. The MR imaging protocol included the following pulse sequences: (a) axial and coronal single-shot turbo spin-echo (TSE) T2-weighted images covering the upper abdomen were acquired with respiratory triggering (TE = 80 ms, Echo train length: 72, 40 slices of 5 mm thickness and no interslice gap and a field of view of 350 9 400 mm), (b) axial spin-echo echo planar DW-MRI sequence acquired with respiratory triggering, (TE 70 ms, Echo train length: 61, 40 slices of 5 mm section thickness, no interslice gap, field of view of 350 9 400 mm). Diffusion-probing gradients were applied in three orthog-onal directions and the isotropic mean image was obtained. The DW-MRI sequence was acquired with b factors 0, 150, and 1000 s/mm2. All sequences were acquired with a sense acceleration factor of 2.
Histological analysis
Histological evaluation was made on surgically resected specimens in 19/22 patients and on endoscopic biopsy samples in 3/22 patients. Grading classification was based on mitotic count per square millimeter of tumor and Ki-67 index, according to the ENETS [5,6] adopted by the WHO in 2010 (Table1).
Image Analysis
Two radiologists (one third year resident in radiology and one radiologist with 16 years of experience in abdominal MR) analyzed all images, working in consensus and blinded to histological grading of the PanNET. Data from all b-values were transferred from a picture archiving and com-munication system (PACS) to a personal computer. Using an in-house developed software, an ADC map was calcu-lated for each slice from images with b values‡150 s/mm2
providing a perfusion insensitive ADC. Then the Image J software (http://rsb.info.nih.gov/ij/) was launched together with an in-house graphical user interface (GUI) that was developed in order to allow numerical assisted segmentation of the entire lesion volume and ADC histogram analysis. Since it is challenging to define the limits and boundaries of the tumors on ADC maps due to poor signal-to-noise ratio (SNR), the tumor volume was defined using the highest b value, in our case b = 1000 s/mm2DW images. The whole tumor was enclosed inside a user-defined bounding box in orthogonal views and automatically segmented by thresh-olding all the inner voxels with value over the mean +0.5 SD. The resulting regions of interest (ROI) were then inspected and readjusted manually with an edit base validation pro-tocol referring to b = 0 s/mm2diffusion-weighted images and TSE T2-weighted images, to encompass the totality of the PanNET lesion volume by avoiding adjacent pancreatic parenchyma within the ROIs and to exclude gross necrotic and cystic areas.
The ADC histogram was generated from the total tumor volume encompassed in all ROIs. The following quantitative parameters were derived: total volume, mean ADC (mADC), 5th percentile ADC (ADC5), 10th percentile ADC (ADC10), 25th percentile ADC (ADC25), 50th percentile ADC (ADC50), 75th percentile ADC (ADC75), 90th percentile ADC (ADC90) and 95th percentile ADC (ADC95), skewness and kurtosis.
Statistical analysis
Statistical analyses were performed with Stata software version 12.1 (Stata Corporation, College Station, TX).
Variables are reported as mean and standard deviation. Pvalues <.05 were considered to represent statistically significant differences. ANOVA with Tukey–Kramer post hoc comparisons for multiple pairwise comparisons [21,22] was performed to compare between histological tumor grades, age and gender, tumor volume, and histogram-derived ADC parameters.
Receiver operating characteristic (ROC) curves were obtained for each histogram-derived parameter. Optimal threshold for each histogram-derived parameter in dif-ferentiating histologic grades was considered to be the maximum value of Youden index [23].
Results
According to the ENETS grading system, 15/22 (68%) tu-mors were classified as low grade (G1), 4/22 (18%) as intermediate grade (G2) and 3/22 (14%) as high grade (G3). Of the three patients that only had endoscopic biopsy, one had a G1 tumor and the other two had G3 tumors.
For histological grades G1, G2, and G3, the mean age was 54 ± 14, 55 ± 17, and 67 ± 12 years, respectively, and the gender was 9 males/6 females, 4 males/0 females, and 2 males/1 female, respectively. No statistically sig-nificant differences in age or gender were found between the three histological grades (p > .05).
Tumor volume ranged from 1.1 to 55 mL. The mean volume for G1 was 2 ± 3 mL, for G2 5 ± 6 mL and G3 55 ± 15 mL. The volume was statistically significantly higher in G3 compared to G1 and G2 (p < 0.0001).
Table2 shows the quantitative histogram-derived parameters. Among these mADC, ADC75, ADC90, and ADC95 were statistically significantly different between
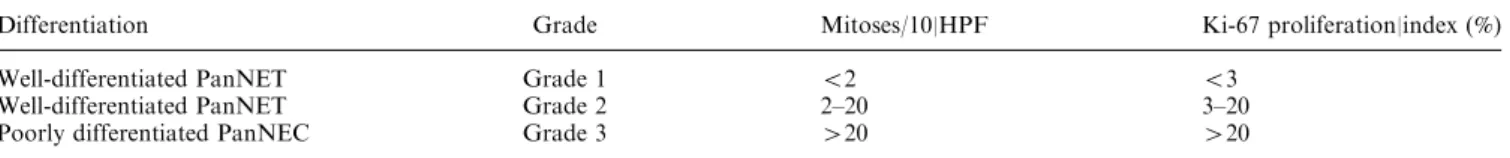
Table 1. Classification system for pancreatic neuroendocrine tumors
Differentiation Grade Mitoses/10|HPF Ki-67 proliferation|index (%) Well-differentiated PanNET Grade 1 <2 <3
Well-differentiated PanNET Grade 2 2–20 3–20 Poorly differentiated PanNEC Grade 3 >20 >20 HPFhigh power field, PanNET pancreatic neuroendocrine tumor, PanNEC pancreatic neuroendocrine carcinoma
Table 2. Histogram-derived parameters (mean± SE)
mADC ADC5 ADC10 ADC25 ADC50 ADC75 ADC90 ADC95 Skew Kurtosis
G1 1283 ± 267 962 ± 266 1019 ± 257 1137 ± 254 1270 ± 287 1404 ± 300 1495 ± 318 1562 ± 347 0.041 ± 0.466 2.802 ± 0.679 G2 892 ± 390 664 ± 420 716 ± 409 800 ± 390 880 ± 385 952 ± 381 1036 ± 384 1072 ± 374 0.065 ± -0.387 3.788 ± 1.220 G3 733 ± 225 448 ± 254 512 ± 284 608 ± 284 725 ± 272 864 ± 284 1008 ± 288 1152 ± 192 1.01 ± 1.140 5.963 ± 4.008
Table 3. Significant differences in ANOVA and post hoc comparisons (p values)
mADC ADC5 ADC10 ADC25 ADC50 ADC75 ADC90 ADC95 Skew Kurtosis G1vsG2 0.049 0.208 0.185 0.104 0.069 0.034 0.038 0.029 0.941 0.488 G1vsG3 0.004 0.019 0.017 0.007 0.008 0.008 0.018 0.041 0.036 0.010 G3vsG2 0.469 0.460 0.467 0.419 0.519 0.686 0.838 0.990 0.056 0.168 The bold numbers represent the statistically significant p-values < 0.05
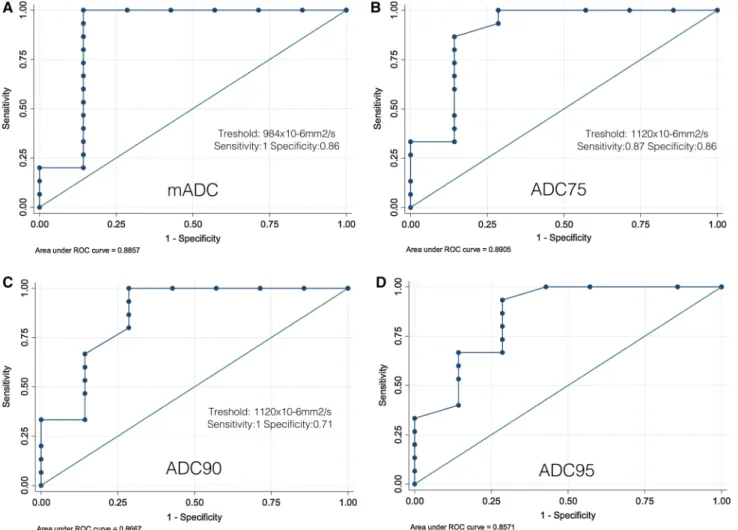
the three histological grades (p = 0.002; p = 0.002; p= 0.005; p = 0.008). MeanADC, ADC75, ADC90, ADC95 were statistically significantly higher in G1 compared to G2 tumors. All histogram-derived param-eters were statistically significantly higher in G1 than in G3 tumors. No statistically significant differences were found between G2 and G3 tumors. Table3 gives the results of post hoc ANOVA pair analysis. Figure1 rep-resents ROC curves for the mADC, ADC75, ADC90, and ADC95 calculated for differentiating G1 from G2/ G3. Skewness was positive in all tumor grades and sta-tistically significantly higher in G3 (1.01 ± 1.140) com-pared to G1 (0.041 ± 0.466; p < 0.05) and to G2 (0.065 ± -0.387; p = 0.056) tumors. Kurtosis increased with tumor grade and was significantly higher in G3 (5.963 ± 4.008) compared to G1 (2.802 ± 0.679) (p = 0.01). Representative images of G2 and G3 tumors are shown in Figs.2and3, respectively.
Discussion
The purpose of our study was to assess if ADC his-togram-based analysis considering the entire tumor vol-ume allows differentiation of the histological grades of PanNET. Previous studies have assessed the correlation between ADC and the histopathological characteristics of PanNETs, however, these were based on the evalua-tion of a single or few ROIs in the most representative sections of the tumor, giving limited information regarding the distribution of the ADCs. To our knowl-edge, there are no reports that have assessed PanNET histological grades with ADC histogram-based analysis considering the entire tumor volume. This method gives better information regarding the distribution of ADCs summarizing the diffusion pattern of water molecules within the whole tumor, also eliminating potential sam-pling bias.
Fig. 1. ROC curve for A mADC, B ADC75, C ADC90, D ADC95 calculated for differentiating G1 from G2/G3. The respective cut-off, sensitivity and specificity were A
984 9 10-6mm2/s, 100%, 86%, B 1120 9 10-6mm2/s, 87%, 86%, C 1120 9 10-6mm2/s, 100%, 71%, (D) 1184 9 10-6 mm2/s, 93%, 71%.
At histology, PanNETs are stroma-poor tumors with morphologic features that are dependent on their level of differentiation [5]. In WDNETs, which include G1 and G2 tumors, the cells are arranged as sheets of mono-tonous epithelial cells and have a fair amount of cyto-plasm. The number of mitosis and the Ki-67 index allow the differentiation between G1 and G2. While G1 tumors show <2 mitosis per high power field (HPF), the G2 tumors may shown between 2 and 20 mitosis per HPF. The G3 tumors include the PDNEC, are divided into small and large-cell variants. While the large-cell variant is more common and characterized by large cells with prominent nucleoli and variable cytoplasmic volume, the small-cell variant shows high nucleus-to-cytoplasm ratio. Moreover, in G3 tumors the number of mitosis per HPF is >20 [5]. The increase of the mitotic index and the decrease of the cytoplasmic volume result in a decrease of the extracellular space with the consequent restriction of water molecules motion, resulting in a decrease in ADC as the tumor grade increases.
Similar to other previous studies, our results have shown that histogram-derived ADC parameters decrease as tumor grade increases. mADC, ADC75, ADC90, and ADC95 were statistically significantly higher in G1 compared to G2 (p < 0.05) and that all histogram-de-rived parameters (mADC, ADC5, ADC10, ADC25, ADC50, ADC75, ADC90, ADC95) were statistically
significantly higher in G1 tumors compared to G3 tu-mors (p < 0.05). Concerning G2 and G3 tutu-mors, we found an overlap of ADC between these grades and we were not able to show a statistically significant differ-ence. While this might be due to statistical chance, as our study could be underpowered by the small sample size (4 patients with G2 and 3 patients with G3 tumors), there may be an underlying histopathological reason. Despite the higher number of mitosis and nucleus-to-cytoplasma ratio, the G3 tumors may be characterized by intra-lesional necrosis [5], and this may impact the ADC val-ues. Even if macroscopic necrotic and cystic areas were excluded from the ROIs, microscopic necrotic areas might have been included.
Despite the different classification, in the study of Wang et al., the mean ADC values of PanNET ranged from 770 9 10-6mm2
/s (well differentiated endocrine carcinoma) to 2750 9 10-6mm2/s (well differentiated endocrine tumor with benign behaviour). Even though this analysis was based on a single ROI measurement, the results are similar to those of our study, as the mADC ranged from 474 9 10-6 mm2/s (G3) to 1970 9 10-6 mm2/s (G1). The lower values obtained in our study for mADC compared to the ones reported by Wang et al., can be explained by the fact that we included higher maximum b-values and a higher minimum b value (b = 150 s/mm2).
A
B
C
0 10 0 20 0 30 0 Fr eq ue nc y 0 1000 2000 3000 ADC x 10-6 mm2/sD
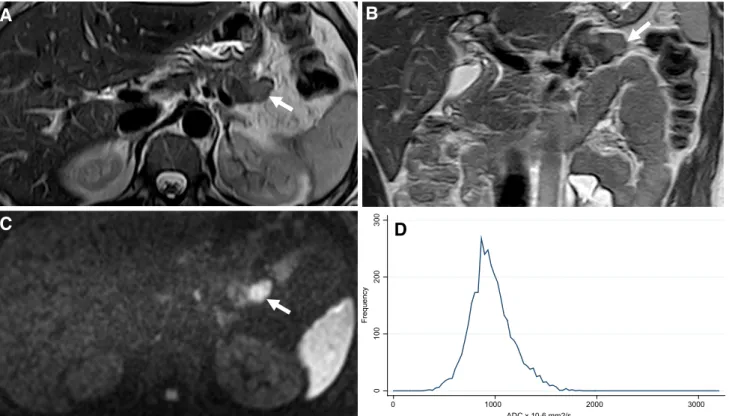
Fig. 2. Magnetic resonance images of a G2 PanNET from a 29-year-old female patient. Axial (A) and coronal (B) T2 weighted show a slight hyperintense exophytic lesion (arrow)
in the pancreatic tail. Note tumor restriction on Axial DWI at b = 1000 s/mm2 (C). D shows histogram distribution of ADC75 with a mean value of 975 9 10-6mm2/s.
The histogram-based analysis yields additional dif-fusion parameters regarding the distribution of ADCs, like skewness and kurtosis. Skewness is a measure of symmetry, or more precisely, the lack of symmetry. A distribution, or data set, is symmetric if it looks the same to the left and right of the center point. A positive skew indicates that the right tail of the distribution is fatter or longer than the left tail.
Kurtosis is a measure of whether the data are peaked or flat relative to a normal distribution. Data sets with high kurtosis tend to have a distinct peak near the mean, decline rather rapidly and have heavy tails [16].
In our results, we found that the skew was positive in all tumor grades but was statistically significantly higher in G3 (1.01 ± 1.140) compared to G1 (0.041 ± 0.466; p < 0.05) and to G2 (0.065 ± -0.387; p = 0.056) tu-mors. This indicates that G3 tumors have a more asymmetric distribution when compared to G1 and G2 tumors. Moreover, we found that the kurtosis was sta-tistically significantly higher in G3 (5.963 ± 4.008) when
compared to G1 (2.802 ± 0.679; p < 0.05) tumors. These results may reflect the marked histopathological heterogeneity of PDNEC included in the G3 group.
Among the limitations of this study, the sample size was small with only 4 patients in G2 and 3 patients in the G3 group. Indeed, we are dealing with relatively rare tumor. Further studies with larger sample size are re-quired in order to increase the statistical power and build adequate predictive models. Furthermore, the repro-ducibility of the method was not assessed. Also 3 patients only had endoscopic biopsy specimens, one of which was classified as G1, therefore, we must acknowledge histopathology in this patient may be inaccurate due to sampling error from biopsy alone.
In conclusion, our results show that histogram-de-rived quantitative diffusion-weighted parameters may reflect the tumor structure and heterogeneity allowing the differentiation between G1 and G2/G3 grade of PanNET. Further studies with larger sample size are required in order to build predictive models.
A
B
C
0 10 20 30 Fr eq ue nc y 0 1000 2000 3000 ADC x 10-6 mm2/sD
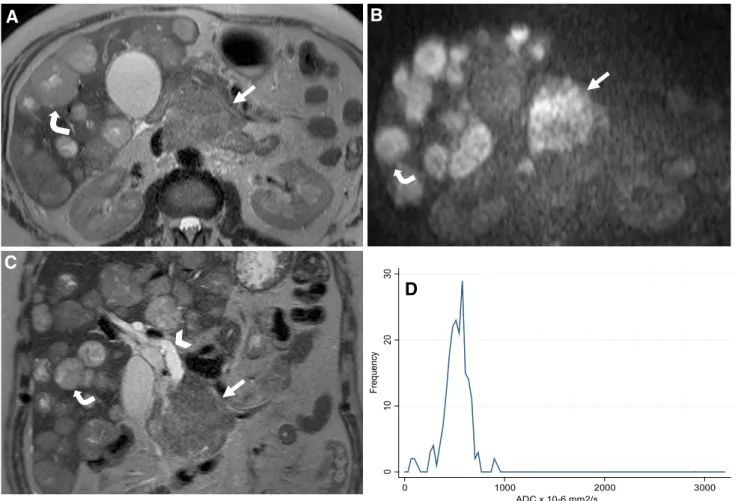
Fig. 3. Magnetic resonance images of a G3 PanNET from a 45-year-old male patient. Axial T2 weighted A shows a large heterogeneous hyperintense lesion (arrow) in the head, isth-mus, and body of the pancreas. Also note nodular metastasis of the liver (curved arrow). Axial DWI at b = 1000 s/mm2B
shows marked restriction from the tumor (arrow) and from the hepatic metastases (curved arrow). Coronal T2-weighted image also shows dilatation of the extra-hepatic bile duct. D shows the histogram distribution of ADC75 with a mean value of 745 9 10-6mm2/s.
References
1. Zhou C, Zhang J, Zheng Y, Zhu Z (2012) Pancreatic neuroen-docrine tumors: a comprehensive review. Int J Cancer 131(5):1013– 1022
2. Fraenkel M, Kim MK, Faggiano A, Valk GD (2012) Epidemiology of gastroenteropancreatic neuroendocrine tumours. Best Pract Res Clin Gastroenterol 26(6):691–703
3. Turaga KK, Kvols LK (2011) Recent progress in the understand-ing, diagnosis, and treatment of gastroenteropancreatic neuroen-docrine tumors. CA Cancer J Clin 61(2):113–132
4. Piani C, Franchi GM, Cappelletti C, et al. (2008) Cytological Ki-67 in pancreatic endocrine tumours: an opportunity for pre-operative grading. Endocr Relat Cancer 15(1):175–181
5. Reid MD, Balci S, Saka B, Adsay NV (2014) Neuroendocrine tu-mors of the pancreas: current concepts and controversies. Endocr Pathol 25(1):65–79
6. Plockinger U, Rindi G, Arnold R, et al. (2004) Guidelines for the diagnosis and treatment of neuroendocrine gastrointestinal tu-mours. A consensus statement on behalf of the European Neu-roendocrine Tumour Society (ENETS). Neuroendocrinology 80(6):394–424
7. Oberg K, Kvols L, Caplin M, et al. (2004) Consensus report on the use of somatostatin analogs for the management of neuroendocrine tumors of the gastroenteropancreatic system. Ann Oncol 15(6):966– 973
8. Pape UF, Jann H, Muller-Nordhorn J, et al. (2008) Prognostic relevance of a novel TNM classification system for upper gas-troenteropancreatic neuroendocrine tumors. Cancer 113(2):256– 265
9. Yamaguchi T, Fujimori T, Tomita S, et al. (2013) Clinical valida-tion of the gastrointestinal NET grading system: Ki67 index criteria of the WHO 2010 classification is appropriate to predict metastasis or recurrence. Diagn Pathol 8:65
10. Ramage JK, Ahmed A, Ardill J, et al. (2012) Guidelines for the management of gastroenteropancreatic neuroendocrine (including carcinoid) tumours (NETs). Gut 61(1):6–32
11. Schmid-Tannwald C, Oto A, Reiser MF, Zech CJ (2013) Diffusion-weighted MRI of the abdomen: current value in clinical routine. J Magn Reson Imaging 37(1):35–47
12. Bakir B, Salmaslioglu A, Poyanli A, Rozanes I, Acunas B (2010) Diffusion weighted MR imaging of pancreatic islet cell tumors. Eur J Radiol 74(1):214–220
13. Wang Y, Chen ZE, Yaghmai V, et al. (2011) Diffusion-weighted MR imaging in pancreatic endocrine tumors correlated with histopathologic characteristics. J Magn Reson Imaging 33(5):1071– 1079
14. Bull JG, Saunders DE, Clark CA (2012) Discrimination of paedi-atric brain tumours using apparent diffusion coefficient histograms. Eur Radiol 22(2):447–457
15. Kang Y, Choi SH, Kim YJ, et al. (2011) Gliomas: Histogram analysis of apparent diffusion coefficient maps with standard- or high-b-value diffusion-weighted MR imaging—correlation with tumor grade. Radiology 261(3):882–890
16. Ahn SJ, Choi SH, Kim YJ, et al. (2012) Histogram analysis of apparent diffusion coefficient map of standard and high B-value diffusion MR imaging in head and neck squamous cell carcinoma: a correlation study with histological grade. Acad Radiol 19(10): 1233–1240
17. Hayashida Y, Hirai T, Morishita S, et al. (2006) Diffusion-weighted imaging of metastatic brain tumors: comparison with histologic type and tumor cellularity. AJNR Am J Neuroradiol 27(7):1419– 1425
18. Heo SH, Shin SS, Kim JW, et al. (2013) Pre-treatment diffusion-weighted MR imaging for predicting tumor recurrence in uterine cervical cancer treated with concurrent chemoradiation: value of histogram analysis of apparent diffusion coefficients. Korean J Radiol 14(4):616–625
19. Downey K, Riches SF, Morgan VA, et al. (2013) Relationship between imaging biomarkers of stage I cervical cancer and poor-prognosis histologic features: quantitative histogram analysis of diffusion-weighted MR images. AJR Am J Roentgenol 200(2):314– 320
20. Brenner R, Metens T, Bali M, Demetter P, Matos C (2012) Pan-creatic neuroendocrine tumor: added value of fusion of T2-weigh-ted imaging and high b-value diffusion-weighT2-weigh-ted imaging for tumor detection. Eur J Radiol 81(5):e746–e749
21. Dale BM, Braithwaite AC, Boll DT, Merkle EM (2010) Field strength and diffusion encoding technique affect the apparent dif-fusion coefficient measurements in difdif-fusion-weighted imaging of the abdomen. Invest Radiol 45(2):104–108
22. Bender R, Lange S (2001) Adjusting for multiple testing—when and how? J Clin Epidemiol 54(4):343–349
23. Kumar R, Indrayan A (2011) Receiver operating characteristic (ROC) curve for medical researchers. Indian Pediatr 48(4):277–287