2017
UNIVERSIDADE DE LISBOA FACULDADE DE CIÊNCIAS
Northern Hemisphere blockings and their impacts over the
European continent – historical overview and associated
mechanisms
Doutoramento em Ciências Geofísicas e da Geoinformação Especialidade de Meteorologia
Pedro Miguel Ribeiro de Sousa
Tese orientada por: Dr. Ricardo Machado Trigo
Dr. David Barriopedro
Júri: Presidente:
● Doutor João Carlos da Costa Catalão Fernandes Vogais:
● Doutor Ricardo Francisco García-Herrera ● Doutor Mário Jorge Modesto Gonzalez Pereira
● Doutor Carlos do Carmo de Portugal e Castro da Câmara ● Doutor Ricardo Machado Trigo
Documento especialmente elaborado para a obtenção do grau de doutor
i
Acknowledgments
First of all, I would like to thank my supervisors.
My most sincere thank you to Dr. Ricardo Machado Trigo and to Dr. David Barriopedro, for their close monitoring of my work, for the teaching through all this process, and of course for their patience! I also acknowledge their constructive criticism which has supported an important development of my investigation skills throughout these years. Thanks to all these facts this thesis has reached its end, and I hope in a satisfactory way for all.
Secondly, I would like to thank my family.
Special emphasis to my parents, which throughout all my life have encouraged my beliefs and my life goals. Amongst these, of course my passion for Meteorology is included. And undoubtedly they have motivated me to perform my academic education until this point of finishing a PhD.
I must also extend my gratitude to all the researchers who have participated in the investigation and peer-review processes throughout my PhD. Without their participation, ideas and effort, none of the published papers presented in this thesis would reach such a satisfactory level.
Finally, a special thank you to all my friends.
A warm salutation to all my dearest friends, ranging from work colleagues to long-time friends from my childhood who remain close to me. Friends are a really important part and balance in my life, balance without I am sure I would not be able to succeed in my professional and academic life!
iii
Abstract
Blocking high pressure systems are large-scale atmospheric circulation patterns with meteorological impacts that vary across regions and seasons, depending on the blocking location, spatial characteristics and temporal length. While blocking episodes are an important component of intra-seasonal and inter-annual variability at mid-latitudes, particularly in Europe, previous studies have mostly focused on characterizing European blocking impacts on either winter or summer seasons. In this thesis, a thorough characterization of Euro-Atlantic blocking occurrence within different longitudinal sectors (Atlantic, European and Russian) was performed, followed by a comprehensive analysis of their seasonal impacts on temperature and on the precipitation regimes of the European continent and specific sub-regions, with particular emphasis on Iberia, and on extreme events. In order to distinguish high-latitude blocking from other common high pressure systems affecting Europe, namely sub-tropical ridges, a novel ridge detection scheme was developed. Ridges do not require a wave-breaking occurrence as blockings do, although they are frequent precursors of wave-breaking, which may lead to blocking. Thus, as an additional novelty, this thesis also characterizes the distinctive seasonal impacts associated with sub-tropical ridges occurring at different longitudinal sectors of the Euro-Atlantic region. Finally, an assessment of the involved mechanisms behind the temperature and precipitation responses to blocking is also carried out. This included for precipitation the role of cyclonic activity (storm-tracks and cut-off lows), moisture transport, and large-scale atmospheric instability, while for temperature the focus was on the role played by horizontal advection, subsidence and imbalances in various radiation budgets.
This distinction clarifies that most extreme heat episodes in southern Europe and Mediterranean areas should not be attributed to blockings, but rather to ridges. In central and northern areas of the continent, both regimes are responsible for warm conditions in summer, due to enhanced radiative heating and increased subsidence. During winter, blocking and ridges lead to opposite temperature responses. Blocking reinforces cold northerly advection in its eastern flank, thus promoting European cold winter spells, especially those located in the eastern Atlantic and western Europe, while mild Atlantic flows associated to ridge patterns result in warmer conditions.
Regarding the impacts on precipitation, blocking and ridges are associated with a marked north-south dipole for the three considered longitudinal sectors of occurrence. While blocking patterns force a split of the storm-track, ridges are associated with a stronger zonal flow at higher latitudes. Thus, negative (positive) precipitation anomalies during blocks occur at higher (lower) latitudes. Enhanced atmospheric instability and cyclonic activity south of blocking centers relate very well with increased rainfall in southern Europe, including Iberia, where torrential regimes are more relevant in the precipitation totals. This dipole is reversed during ridges, which lead to dry conditions in southern Europe. The seasonal analysis further reveals that winters characterized by high frequencies of blocking (ridge) occurrence present above (below) average snow covered soils. Blocking/ridge impacts on temperature and precipitation have also additional effects on meteorological and climate extreme events with large socio-economic impacts. Thus, the results show a blocking/ridge role at different time-scales in controlling a significant part of wildfire
inter-iv
annual variability in Mediterranean areas. Meteorological pre-conditioning raises vegetation stress during dry winters, while increased ridge and blocking occurrence in summer fosters meteorological conditions which are prone to fire ignition and spread. Finally, outputs from state-of-the-art General Circulation Models raise the challenge to develop further these automated schemes for blocking/ridges detection, as their representation in climate models is crucial to understand impacts towards the later decades of the 21st century.
Summing up, the main novelties and achievements of this thesis are: 1) the clear disentanglement between blocks and ridges; 2) the seasonal analyses of specific regional impacts resulting from different locations of blocking/ridge structures; 3) the detailed analysis of dynamical/physical forcing mechanisms associated to each considered weather pattern.
Keywords: Atmospheric blocking, Sub-tropical ridges, Climate variability, Europe, Atlantic, Impacts, Precipitation, Temperature, Droughts, Wildfires.
v
Resumo
Apesar de não existir uma definição unanimemente aceite para o conceito de bloqueio atmosférico, este pode ser descrito como uma supressão do fluxo zonal devido à presença de um sistema de alta pressão. Esta circulação anticiclónica, normalmente localizada nas latitudes onde se observa a corrente de jato polar, apresenta uma dimensão espacial de larga-escala, é geralmente quase-estacionária, e tem um tempo de vida útil entre vários dias a várias semanas. Os sectores orientais dos oceanos Atlântico e Pacífico são geralmente as regiões de ocorrência preferencial de bloqueios no Hemisfério Norte. A ocorrência de bloqueios atmosféricos está diretamente associada a condições prolongadas de tempo seco e estável nas regiões diretamente localizadas sob o sistema de altas pressões. O seu posicionamento geralmente origina uma divisão em dois ramos da corrente de jato. Esta perturbação do habitual padrão zonal resulta em alterações significativas das condições meteorológicas a outras latitudes (tanto meridional como setentrional) distintas da zona diretamente afetada pela posição central do bloqueio.
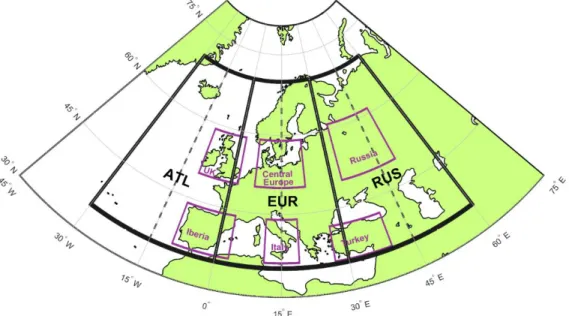
Torna-se necessária assim uma compreensão mais detalhada da climatologia associada aos bloqueios atmosféricos centrados no setor Euro-Atlântico, com especial ênfase aos impactos específicos associados às diferentes localizações que os seus centros de ação possam ter. Apesar de serem um fenómeno que ocorre à escala sinóptica, os bloqueios podem implicar impactos climáticos muito distintos à escala regional, ou mesmo local. Desta forma, um dos principais objetivos desta tese centra-se na elaboração de uma climatologia completa da sua ocorrência, e na respetiva caracterização dos impactos climáticos regionais resultantes da ocorrência de bloqueios em diferentes sectores longitudinais: Atlântico (ATL; 30W-0W), Europeu (EUR; 0E-30E) e Russo (RUS; 30E-60E).
Tendo-se verificado na literatura uma certa confusão entre bloqueio de alta latitude e outros sistemas comuns de alta pressão que afetam a Europa, nomeadamente as cristas sub-tropicais, foi considerado prioritário obter um novo catálogo de cristas de alta pressão para o setor Euro-Atlântico. Desta forma, um segundo objetivo central da tese foi o do desenvolvimento de um novo algoritmo automático de deteção de cristas sub-tropicais, que permita assim realizar uma clara distinção fenomenológica e dos impactos destes dois padrões atmosféricos (bloqueios versus cristas). Assim, a compreensão das condições sinópticas e dos mecanismos físicos envolvidos em cada um destes padrões é também tema central desta tese. No caso da precipitação, esta análise de mecanismos incluiu o papel da atividade ciclónica (storm-tracks e cut-off lows), do transporte de humidade e da instabilidade atmosférica em larga escala. Para avaliar os impactos na temperatura analisou-se a contribuição da advecção horizontal, da subsidência e das alterações nos vários balanços radiativos.
A desagregação bloqueios-cristas permite distinguir fenomenologias por vezes confundidas na literatura, nomeadamente aquando da análise de episódios de calor extremo no sul da Europa. Verifica-se dos resultados obtidos que, devido a uma clara distinção no posicionamento latitudinal dos centros de ação entre bloqueios e cristas, as respostas na temperatura associadas a cada padrão são também bem distintas, sendo estas diferenças particularmente notáveis no inverno. De uma forma geral, nesta estação, os bloqueios (essencialmente os centrados nos
vi
sectores ATL e EUR) resultam em valores das temperaturas do ar bastante abaixo da média, provocadas pela advecção de ar frio de latitudes mais elevadas ao longo do flanco este dos anticiclones. Em oposição, as cristas originam anomalias positivas na temperatura na maior parte do continente europeu, essencialmente como resultado do transporte de massas de ar de origem Atlântica, e de uma redução do arrefecimento radiativo, associado ao aumento da nebulosidade. Durante o verão, ambos os padrões atmosféricos estão associados a temperaturas acima da média em vastas áreas da Europa central e do norte. Em contrapartida, nas regiões mais a sul, e em particular na área da bacia do Mediterrâneo, as cristas controlam a ocorrência de dias extremamente quentes (usualmente identificados como ondas de calor). No verão é também de salientar o papel dominante do aquecimento radiativo solar (sob condições de céu limpo) como principal impulsionador destas anomalias positivas de temperatura em dias de ocorrência de bloqueio/crista, particularmente para os sistemas localizados sobre áreas continentais.
Relativamente aos impactos nos regimes de precipitação, existe um claro dipolo norte-sul ao analisar as anomalias associadas a dias de bloqueio/crista. A ocorrência de bloqueios leva a uma redução da precipitação na metade norte do continente Europeu (em algumas áreas superior a 50%) devido ao bloqueio dos sistemas depressionários de médias-latitudes (e do correspondente transporte de humidade) provenientes do Atlântico. No entanto, esta configuração sinóptica leva a um aumento da precipitação (relativamente à média) nas zonas mais a sul, fundamentalmente relacionado com o desvio do storm-track nesta direção, e a um consequente aumento da instabilidade atmosférica e da convecção. Este padrão resulta numa clara mudança nas distribuições de regimes de precipitação nos países do sul da Europa, e demonstra também a ligação entre bloqueios atmosféricos e os regimes de precipitação torrencial na área do Mediterrâneo. Em padrões de fluxo zonal intenso as anomalias da precipitação são no geral opostas às encontradas durante bloqueios, originando um deficit de precipitação no sul da Europa. No contexto dos vários regimes possíveis de fluxo zonal forte, as cristas sub-tropicais estão associadas a condições particularmente secas nos países do sul da Europa. Isto naturalmente também se aplica à Península Ibérica, onde os totais anuais de precipitação dependem largamente da atividade frontal de origem Atlântica (em particular nos meses de inverno), sendo esta afastada da região durante a ocorrência de cristas nos sectores ATL e EUR. Neste contexto, mostra-se crucial o recurso a bases de dados de alta-resolução com uma densidade de estações muito mais elevada, permitindo uma análise regional mais detalhada para o domínio da Península Ibérica.
Os bloqueios centrados em latitudes elevadas, em particular os que ocorrem no sector ATL, são responsáveis por invernos com maior cobertura de neve no continente Europeu (até cerca de 50% mais dias com a superfície coberta de neve na Europa central), devido a uma maior frequência de dias frios sob os fluxos de norte associados à circulação anticiclónica. Por outro lado, a ocorrência de cristas nos sectores ATL e EUR (que estão associadas a dias de inverno bastante amenos) impõe uma frequência muito mais baixa de dias com neve no solo.
Foi também concluído que os padrões de bloqueio/crista exercem um efeito regulador importante na variabilidade inter-anual de incêndios florestais. Mostra-se que o feedback
vii
existente entre a ocorrência destes padrões atmosféricos, a ocorrência de secas, e os incêndios florestais, acontece a diferentes escalas temporais. Nos meses antecedentes à época de incêndios, uma frequência superior ao normal de cristas (bloqueios) é responsável por valores de precipitação abaixo (acima) da média no sul da Europa, aumentando a vulnerabilidade da vegetação. Durante a própria época de incêndios, este padrão atmosférico está associado a condições anomalamente quentes e secas que promovem a ignição e fácil propagação do fogo.
Finalmente, no contexto das alterações climáticas, verificou-se que nas últimas décadas a frequência de cristas sub-tropicais aumentou bastante no sul da Europa. As projeções futuras dos Modelos de Circulação Geral sugerem uma expansão para norte das altas pressões sub-tropicais (associadas à expansão da célula de Hadley). Por outro lado, não existem sinais dinâmicos de alterações muito significativas na frequência e localização dos bloqueios de alta latitude no sector Euro-Atlântico, exceto uma ligeira tendência de deslocamento para nordeste na sua região preferencial de ocorrência. Pretende-se como trabalho futuro utilizar também uma abordagem dinâmica (não apenas baseada em campos de anomalia) para o algoritmo de deteção de cristas, que permitirá uma maior confiança na extrapolação para cenários futuros.
Palavras-chave: Bloqueios atmosféricos, Cristas sub-tropicais, Variabilidade climática, Europa, Atlântico, Impactos, Precipitação, Temperatura, Secas, Incêndios.
ix
Contents
List of Acronyms and Abbreviations xi
List of Figures xiii
List of Tables xvii
1. Introduction 1
1.1. Large-scale variability and the European climate . . . 3
1.1.1. Inter-decadal and inter-annual temperature variability . . . 4
1.1.2. European temperature extremes . . . 7
1.1.3. European precipitation regimes . . . 10
1.1.4. Drought conditions throughout the 20th century . . . 11
1.2. Atmospheric blocking: climatology and associated impacts . . . 14
1.2.1. Blocking definition . . . 14
1.2.2. Euro-Atlantic blocking climatology . . . 17
1.2.3. Blocking life cycle: onset, maintenance and decay . . . 21
1.2.4. Sub-tropical ridges. . . 25
1.2.5. Blocking and ridge impacts . . . 27
1.3. Goals and structure of the thesis . . . 29
2. European temperature responses to blocking 31
Summary . . . 32
2.1. Paper in Climate Dynamics . . . 33
2.1.1. Introduction . . . 33
2.1.2. Data and Methods . . . 35
2.1.3. Results . . . 38
2.1.3.1 Blocking and ridge seasonal distribution . . . 38
2.1.3.2 Seasonal temperature responses . . . 39
2.1.3.3 Synoptic and forcing mechanisms . . . 43
2.1.3.4 Changes in regional temperature distribution . . . 50
2.1.4. Discussion and Conclusions . . . 55
x
3. Blocking impacts on European precipitation regimes 63
Summary . . . 64
3.1. Paper in Climate Dynamics. . . 65
3.1.1. Introduction . . . 66
3.1.2. Data and Methods . . . 68
3.1.3. Changes in mean precipitation rates . . . 71
3.1.4. Synoptic and dynamics associated to different blocking locations . . . 74
3.1.5. Shifts in precipitation distributions . . . 82
3.1.6. Discussion and Conclusions . . . 87
3.1.7. Supplementary material . . . 90
3.2. Dry fingerprint of ridge patterns in southern Europe . . . 95
3.3. Impacts on European snow-cover . . . 98
4. Blocking impacts on Iberian precipitation and temperature 101
Summary . . . 102
4.1. Paper in Climate Dynamics . . . 103
4.1.1. Introduction . . . 104
4.1.2. Data . . . 106
4.1.3. Seasonal impacts of blocking in Iberian precipitation. . . 109
4.1.4. Synoptic forcing . . . 114
4.1.5. Extreme Value Analysis . . . 119
4.1.6. Discussion . . . 125
4.1.7. Supplementary material . . . 127
4.2. High-resolution Iberian rainfall deficits during ridge patterns . . . 129
4.3. High-resolution Iberian temperature responses at a finer scale . . . 130
5. Conclusions and open threads for Future work 135
Summary . . . 136
5.1. Conclusions . . . 137
5.2. Open threads for Future work . . . 138
5.1.1. The feedbacks between blocking, droughts and wildfires . . . 139
5.1.2. Future scenarios of blocking variability in the 21st century . . . . 144
5.3. Perspectives . . . 149
References 151
xi
List of Acronyms and Abbreviations
AMO Atlantic Multidecadal Oscillation
ATL Atlantic sector (30W-0W)
CMIP3 Coupled Model Intercomparison Project (phase 3)
CMIP5 Coupled Model Intercomparison Project (phase 5)
COL Cut-Off Low
DG Dole and Gordon blocking index
EA East Atlantic pattern
EA/WR East Atlantic / Western Russia pattern
ECA&D European Climate Assessment and Dataset
EFD European Fire Database
ENSO El Niño - Southern Oscillation
EPNP East Pacific North Pacific pattern
ESM Eddy Straining Mechanism
EUR European sector (0E-30E)
FUME Forest fires Under the Mediterranean Environment
GCM General Circulation Model
GP Generalized Pareto
IP Iberian Peninsula
IPO Inter-Decadal Pacific Oscillation
IVT Integrated water Vapor Transport
KStest Kolmogorov-Smirnov test
LHF Latent Heat Flux
LI Lifted Index
LMM Late Maunder Minimum
NAM Northern Annular Mode
NAO North Atlantic Oscillation
xii
NCAR National Center for Atmospheric Research
NH Northern Hemisphere
NOAA National Oceanic and Atmospheric Administration
PDF Probability Density Function
PDO Pacific Decadal Oscillation
PMAX Maximum daiyly precipitation
PNA Pacific North American pattern
PT Potential Temperature
PTOT Total event/episode precipitation
PV Potential Vorticity
RCP4.5 Representative Concentration Pathway for greenhouse gases (4.5 W.m-2 radiative forcing)
RCP8.5 Representative Concentration Pathway for greenhouse gases (8.5 W.m-2 radiative forcing)
RUS Russian sector (30E-60E)
RUCL Rutgers Univeristy Climate Lab
SCA Scandinavian pattern
SPEI Standardized Precipitation Evapotranspiration Index
SPRE Strong Persistent Ridge Events
SST Sea Surface Temperature
SSW Sudden Stratospheric Warming
TM Tibaldi and Molteni blocking index
TN Minimum temperature
TN10 Days with minimum temperature below the 10th percentile of climatology
TX Maximum temperature
TX90 Days with maximum temperature above the 90th percentile of climatology
UK United Kingdom
WMO World Meteorological Organization
WP West Pacific pattern
WWII World War II
xiii
List of Figures
Fig. 1.1 – Map of updated Köppen-Geiger climate classification for Europe . . . 3
Fig. 1.2 – Comparison between NH temperature anomaly trends and the NAO and AMO indices . . . 5
Fig. 1.3 – Main large-scale circulation modes in the NH . . . 6
Fig. 1.4 – Dominant large-scale circulation modes influencing temperature variability in Europe . . . 7
Fig. 1.5 – Reconstruction of the warmest/coldest summers in Europe (1500-2010) . . . 9
Fig. 1.6 – Dominant large-scale circulation modes influencing precipitation variability in Europe . . . 11
Fig. 1.7 – Annual series of drought conditions in distinct European regions . . . 12
Fig. 1.8 – Percentages of Mediterranean areas under wet/dry conditions during the 20th century . . . 13
Fig. 1.9 – Typical synoptic configurations for Omega blocks and Rex blocks . . . 14
Fig. 1.10 – Schematic of the automated blocking detection method used throughout the thesis . . . 16
Fig. 1.11 – Blocking center location frequencies in the NH . . . 18
Fig. 1.12 – Histograms for blocking episodes duration in the NH . . . 19
Fig. 1.13 – Preferred blocking genesis and decay locations in the NH . . . 20
Fig. 1.14 – Schematics for different types of wave-breaking . . . 22
Fig. 1.15 – Distribution of winter blocking genesis, tracks and lysis during different NAO phases . . . . 23
Fig. 1.16 – Schematics for the Eddy Straining Mechanism and the Selective Absorption Process . . . 24
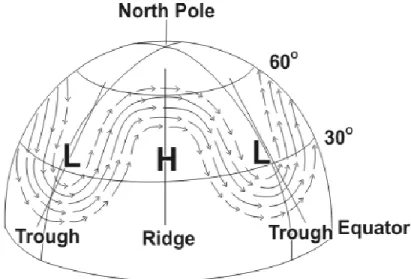
Fig. 1.17 – Idealized atmospheric circulation around a sub-tropical ridge in the NH . . . 26
Fig. 1.18 – Synoptic configurations for ridge events with or without wave-breaking . . . 27
Fig. 1.19 – Temperature and precipitation responses in Europe during winter blocks . . . 28
Fig. 2.1 – Geographical representation of the considered sectors of blocking/ridges occurrence . . . 36
Fig. 2.2 – Absolute and anomalous Z500 composites for blocking/ridge episodes in each sector . . . 39
Fig. 2.3 – Composites for winter TN and TX during blocking and ridge days . . . 40
Fig. 2.4 – Composites for summer TN and TX during blocking and ridge days . . . 42
Fig. 2.5 – Dominant forcing mechanisms associated to European temperature anomalies . . . 44
Fig. 2.6 – Winter surface radiative fluxes budgets during blocking and ridge days . . . 46
Fig. 2.7 – Summer surface radiative fluxes budgets during blocking and ridge days . . . 48
xiv
Fig. 2.9 – Changes in European winter TN and TX distributions during blocking and ridge days . . . 51
Fig. 2.10 – Changes in European summer TN and TX distributions during blocking and ridge days . . . 53
Fig. 2.11 – Changes in European extreme temperature days during blocking and ridge days . . . 55
Fig. 2.12 – Composites for winter TN and TX considering smaller sub-sectors of occurrence . . . 58
Fig. 2.13 – Composites for summer TN and TX considering smaller sub-sectors of occurrence . . . 58
Fig. 2.14 – Detailed contribution of different forcing terms for temperature changes during winter . . . . 59
Fig. 2.15 – Detailed contribution of different forcing terms for temperature changes during summer . . . 60
Fig. 2.16 – Anomalies in the winter mean lapse-rate during blocking and ridge days . . . 61
Fig. 2.17 - Changes in TN and TX distributions for Turkey and Russia . . . 62
Fig. 2.18 - Changes in extreme temperature days for Turkey and Russia . . . 62
Fig. 3.1 – Sectors of Euro-Atlantic blocking occurrence . . . 69
Fig. 3.2 – Seasonal daily anomalies and absolute values for Z500 during blocking days . . . 70
Fig. 3.3 – Annual composites for daily precipitation anomalies during blocking and zonal days . . . 72
Fig. 3.4 – Differences in seasonal precipitation anomalies between blocking and zonal days . . . . 74
Fig. 3.5 – Changes in the frequency of cyclone locations during blocking and zonal days . . . 75
Fig. 3.6 – Changes in spatial patterns of the IVT and the LI during blocking and zonal days . . . 77
Fig. 3.7 – Seasonal changes in the IVT and LI spatial patterns during blocking and zonal days . . . 79
Fig. 3.8 – Changes in the mean LHF spatial patterns during blocking and zonal days . . . 81
Fig. 3.9 – Shifts in precipitation distributions for each synoptic pattern in the UK . . . 83
Fig. 3.10 – Shifts in precipitation distributions for each synoptic pattern in the Iberian Peninsula . . . 85
Fig. 3.11 – Shifts in summer precipitation distributions for each synoptic pattern in Russia . . . 86
Fig. 3.12 – Shifts in precipitation distributions for each synoptic pattern in Turkey . . . 87
Fig. 3.13 – Changes in the number of dry days during blocking and zonal patterns . . . 90
Fig. 3.14 – Forward trajectories of air parcels during ATL blocking days . . . 91
Fig. 3.15 – Shifts in winter precipitation distributions for each synoptic pattern in NW Iberia . . . 92
Fig. 3.16 – Shifts in summer precipitation distributions for each synoptic pattern in NW Iberia . . . 93
Fig. 3.17 – Shifts in precipitation distributions for each synoptic pattern in Central Europe . . . 93
Fig. 3.18 – Shifts in precipitation distributions for each synoptic pattern in Italy . . . 94
Fig. 3.19 – Shifts in winter precipitation distributions for each synoptic pattern in Turkey . . . 94
xv
Fig. 3.21 – Seasonal composites for daily precipitation anomalies during ridge days . . . 96
Fig. 3.22 – Seasonal composites for daily precipitation anomalies during zonal days . . . 97
Fig. 3.23 – Mean percentage of days with snow covered soil during European winter . . . 98
Fig. 3.24 – Changes in the number of snow covered soil days during blocking and ridge days . . . 99
Fig. 4.1 – Climatology of blocking occurrence in the ATL and EUR sectors . . . . 108
Fig. 4.2 – Seasonal patterns of Z500 departures for ATL and EUR blocks . . . 109
Fig. 4.3 – Iberian precipitation seasonal anomalies during blocking days using different datasets . . . . . 110
Fig. 4.4 – High-resolution precipitation anomalies in Iberia for blocked and zonal patterns . . . 112
Fig. 4.5 – Changes in the rainy days in Iberia during blocked and zonal patterns . . . 114
Fig. 4.6 – Changes in the IVT and the LI for ATL and EUR blocked/zonal days . . . 115
Fig. 4.7 – Changes in the frequency of cyclone locations for ATL and EUR blocked/zonal days . . . 117
Fig. 4.8 – Changes in the frequency of COL locations for ATL and EUR blocked/zonal days . . . 118
Fig. 4.9 – Extreme precipitation efficiency for blocking/zonal days in Iberia . . . 120
Fig. 4.10 – Regional boxes chosen to perform the GP fit for Iberian precipitation . . . 121
Fig. 4.11 – Choosing the best Extreme Value distribution fit – L-Moment Ratio diagrams . . . 123
Fig. 4.12 – Seasonal patterns of Z500 departures for smaller sub-sectors of blocking occurrence . . . 127
Fig. 4.13 – Precipitation anomalies in Iberia in the days prior to blocking occurrence . . . 127
Fig. 4.14 – Probability-probability plots for the GP fit during blocking days . . . 128
Fig. 4.15 – Probability-probability plots for the GP fit during zonal days . . . . 128
Fig. 4.16 – Winter and summer precipitation anomalies in Iberia during ridge days . . . . 129
Fig. 4.17 – Anomalies in winter TN and TX in Iberia during blocking and ridge days . . . 131
Fig. 4.18 – Anomalies in summer TN and TX in Iberia during blocking and ridge days . . . 132
Fig. 5.1 – Links between late spring SPEI and the previous month’s blocking/ridge frequencies . . . 140
Fig. 5.2 – Summer blocking/ridge enhancement due to prolonged surface moisture deficits . . . . 142
Fig. 5.3 – Intra-annual evolution of drought conditions in severe wildfire years . . . 143
Fig. 5.4 – Inter-annual variability in the frequency of winter blocking and ridges . . . 145
Fig. 5.5 – Inter-annual variability in the frequency of summer blocking and ridges . . . 146
Fig. 5.6 – Past and projected changes in winter Z500 at different latitudes . . . 147
xvii
List of Tables
Table 1.1 – Ranked coldest top 10 months and winters in Central England (1659-2013) . . . 7 Table 4.1 – Number of extreme rainy days in different areas of Iberia under each weather pattern . . . . 122 Table 4.2 – Confidence levels of the GP fits for the maximum event precipitation . . . 124 Table 4.3 – Confidence levels of the GP fits for the total event precipitation . . . 124 Table 5.1 – Links between summer burnt areas and the previous month’s blocking/ridge frequencies . . 141 Table 5.2 – Links between summer burnt areas and concurrent blocking/ridge frequencies . . . 141
1. Introduction
1
Chapter 1
Introduction
Contents
1.1 Large-scale variability and the European climate
1.1.1 Inter-decadal and inter-annual temperature variability 1.1.2 European temperature extremes
1.1.3 European precipitation regimes
1.1.4 Drought conditions throughout the 20th century
1.2 Atmospheric blocking: climatology and associated impacts 1.2.1 Blocking definition
1.2.2 Euro-Atlantic blocking climatology
1.2.3 Blocking life cycle: onset, maintenance and decay 1.2.4 Sub-tropical ridges
1.2.5 Blocking and ridge impacts 1.3 Goals and structure of the thesis
1. Introduction
1. Introduction
3
1.1 Large-scale variability and the European climate
Although Europe lies within the northern temperate climate zone, its relative large extension encloses a wide range of different climates (Barry and Chorley, 2010). Kottek et al (2006) have developed an updated version of the Köppen-Geiger climatic classification map that is shown here for the European continent (Fig 1.1). While oceanic climate classifications predominate in western sectors, temperate and cool continental climates are characteristic of eastern and northern countries. The Mediterranean basin is dominated by warm and temperate Mediterranean classes, which are characterized by wet winter and dry and hot summers (see Fig. 1.1). The prevailing westerly zonal flow and the associated Jetstream control a large fraction of the European climate, although disruptions of the Jetstream frequently alter significantly the usual precipitation and temperature distributions. A large part of the inter-annual variability in European weather is modulated by a few synoptic structures (e.g. the Azores high, Iceland low, Jetstream, storm-tracks). Amongst them, quasi-stationary high pressure systems referred to as blocking, are one of the main weather regimes disrupting the mean European conditions (Rex, 1950a,b).
Fig. 1.1 European map of updated Köppen-Geiger climate classification. Adapted from Kottek et al.,
1. Introduction
4
In order to frame a large-scale phenomenon such as blocking, in terms of climatology and impacts over the European continent, as intended throughout this thesis, it is firstly required to present the main large-scale atmospheric variability modes that affect the study area at different time scales. In the following sub-sections, the links between these circulation modes (as well as other remote atmospheric and oceanic phenomena) and the European climate variability at different time-scales (from a long-term perspective to inter-annual variations), are briefly described, taking also into account the Mediterranean environment.
1.1.1 Inter-decadal and inter-annual temperature variability
At long temporal scales, the rate of global warming in the post-industrial era is unprecedented (Luterbacher et al., 2004; Mann et al. 2009; Ljungqvist et al., 2012) and leads to a generalized consensus on an anthropogenic fingerprint (Cook et al., 2013; Fischer and Knutti, 2015). An apparent hiatus in this steep recent warming trend has been discussed in recent years (e.g. Seneviratne et al., 2014). However, the successive record temperature years at the global scale, including 2014, 2015 and 2016 have now undermined the concept of hiatus (e.g. Su et al., 2017). Superimposed on this long-term trend, the mean temperature in the Northern Hemisphere (NH) during the 20th century has been characterized by a multi-decadal warming-cooling-warming pattern (Li et al., 2013), with the latter being particularly notable through the early stages of the 21st century. The work by Peña-Ortiz et al. (2015) corroborates a similar behavior in the European region, as the authors refer to a shortening of the summer season in Europe throughout the 1950-1978 period, and a notable lengthening in the post-1979 period. To understand the multi-decadal changes within the long-term temperature trend it is mandatory to take into account the effects of internal variability, including several oscillatory phenomena associated with Sea Surface Temperature (SST) anomalies, such as the Atlantic Multi-decadal Oscillation (AMO) or the Pacific Decadal Oscillation (PDO). A close relation between the AMO phase and the mean temperature of the NH and the European continent has been reported by several authors (Li et al., 2013; Mann et al., 2014; Peña-Ortiz et al., 2015; Zampieri et al., 2016), with the cooling phases of the AMO signal likely offsetting some of the anthropogenic warming (see Fig. 1.2). Gámiz-Fortis et al. (2011) have shown that the Sea Surface Temperature (SST) of the Atlantic Ocean is able to account for about 12% of the north-western European land surface temperature variance. These authors also stress that the AMO influence on European temperature is not only regional-dependent, but also non-stationary in time, as links change significantly throughout the decades.
1. Introduction
5
Fig. 1.2 a) The 11-year running mean (red line) Northern Hemisphere temperature (NHT) anomalies
from the HadCRUT4 dataset, relative to the base period 1961−1990. The black line shows the global atmospheric CO2 concentrations. b) The 11-year running means of the de-trended Northern
Hemisphere Temperature (DNHT), the North Atlantic Oscillation (NAO) and the Atlantic Multi-decadal Oscillation (AMO). The pink shaded areas in (a) and (b) show the 2-sigma uncertainty ranges. From Li et al. (2013).
At the inter- and intra-annual temporal scales, multi-decadal variability modes, such as the AMO and PDO are not critical due to the intrinsic mismatch of temporal scales. Instead, emphasis must be oriented toward large-scale teleconnection patterns which in turn modulate atmospheric circulation conditions at shorter spatio-temporal scales. With this aim, a number of different methodological approaches have been developed to derive the most important large-scale patterns of atmospheric circulation, particularly those affecting Europe and North America, as summarized in major review works (e.g. Wallace and Gutzler, 1981; Yarnal, 1993; Barry and Carleton 2001). Besides the methodology to extract the relevant atmospheric patterns, many authors have been particularly interested in evaluating the associated impacts on the surface climate at the continental and regional scales. In Europe, some of the most important circulation patterns are connected with anomalies of the North Atlantic eddy-driven Jetstream, particularly
1. Introduction
6
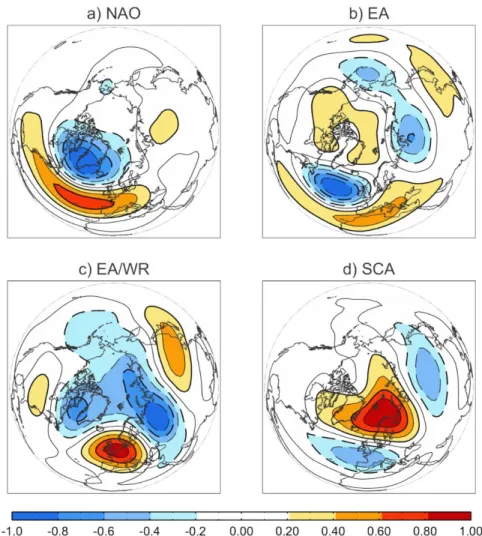
for winter. These most relevant circulation modes are depicted in Fig.1.3, namely: a) North Atlantic Oscillation (NAO); b) East Atlantic (EA); c) East Atlantic / Western Russia (EA/WR); d) Scandinavian (SCA) patterns. In other seasons, the climate of the region is also influenced by remote patterns from subtropical latitudes, as well as global phenomena, often involving atmosphere-ocean interactions (García-Herrera and Barriopedro, 2017).
Fig. 1.3 Spatial patterns of regression for the Principal Components Analysis of NH geopotential
height fields at 500 hPa during winter.
The NAO (Fig. 1.3a) is the leading mode of atmospheric circulation variability over the Euro-Atlantic sector, andis characterized by a seesaw of atmospheric mass between the Iceland Low and the Azores High (e.g., Hurrell and Deser 2009). On intra-seasonal time-scales, the NAO is associated with variations in the latitude of the North Atlantic Jetstream and storm-tracks, while on the inter-annual time-scales it characterizes changes in their strength (Woollings et al., 2014). Regarding the European temperature responses to NAO, characterized by warmer conditions in central and northern Europe during its positive phase, it has been shown that besides its phase, the exact location of the NAO centers of action is more determinantin southern than in central and northern Europe (e.g. Castro-Díez et al., 2002). Also, the particularities of the summer NAO -characterized by a meridional dipole with low pressures over Greenland and high
1. Introduction
7
pressures over the UK - have also been explored. For example, its positive phase promotes cold and wet summers in central and eastern Mediterranean (Bladé et al. 2012; Mariotti and Dell’Aquila 2012). Other atmospheric circulation patterns (e.g., SCA, EA and EA/WR) become also quite relevant in terms of inter-annual variability of temperature at the European and regional scales (e.g. Trigo et al., 2008; García-Herrera and Barriopedro, 2017). Fig. 1.4 shows the most relevant modes of variability for this variable in European areas, including the Mediterranean basin.
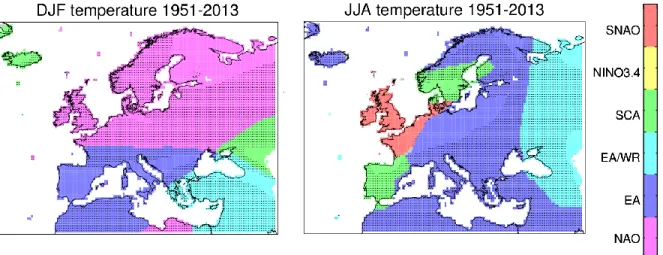
Fig. 1.4 Spatial distribution of the dominant large-scale phenomenon influencing temperature
inter-annual variations during winter (DJF, left panel) and summer (JJA, right panel) seasons of the 1951-2013 period. Colors identify the large-scale phenomenon with the largest Pearson correlation coefficient with seasonal-mean temperature data. Dots highlight areas displaying significant correlations with more than one teleconnection pattern. The following large-scale phenomena are considered in the analysis: North Atlantic Oscillation (NAO), East Atlantic pattern (EA), East Atlantic / Western Russian pattern (EA/WR), Scandinavian pattern (SCA), El Niño index (NINO3.4) and the high-summer NAO (SNAO). Adapted from García-Herrera and Barriopedro (2017).
As mentioned above, atmospheric teleconnections are closely related to the occurrence of specific weather regimes, such as atmospheric blocks, albeit often not explicitly. As better described in Section 1.2, atmospheric blocking is associated with disruptions of the usual westerly flow from a few days to weeks, thus causing significant changes in the synoptic environment (Trigo et al., 2004; Silmann and Croci-Maspolli, 2009), and consequently on the regional temperature in Europe. This topic will be discussed in detail in Chapter 2.
1.1.2 European temperature extremes
There is a vast literature focusing on European temperature extremes, including both cold and hot extremes, regional impacts, and the atmospheric circulation patterns which enhance them (e.g. Barriopedro et al., 2011, Horton et al., 2015). Several studies have pointed that anomalies in the North Atlantic atmospheric flow are crucial to modulate winter, spring and autumn
1. Introduction
8
occurrences of both cold nights and warm days in Europe (e.g. Andrade et al., 2012; Cattiaux et al., 2012). More specifically, atmospheric blocking is tightly linked with the occurrence of extreme temperature events (Trigo et al., 2004; Buehler et al., 2011; Pfahl, 2014), although the majority of the studies focus on cold extremes during the winter season only.
In recent years, some exceptional extreme cold winter episodes have occurred in Europe, such as the 2009-2010 winter (Cattiaux et al., 2010), driven by record persistent negative phases of the NAO and enhanced blocking conditions. The late stages of the 2011-2012 winter were also exceptionally cold over large parts of Europe, and took place after the occurrence of a Sudden Stratospheric Warming episode (WMO, 2012). Further back in time, a close link between anomalously cold winters in Europe and enhanced blocking occurrence had already been explored by Lejenäs (1989), presenting the winter of 1941-1942 as a vivid example. The blocking-driven frigid conditions were associated with some of the most poignant episodes of World War II, particularly the dramatic siege of Leningrad. Similarly, the historical cold winter of 1962-1963, one the bitterest seasons of the 20th century in the UK (see Table 1.1), was recently explored by Burt (2013), who reported prolonged cold temperatures that were are only comparable to episodes occurring in one of the coldest periods of the last millennium, i.e. during the so-called Late Maunder Minimum (LMM, ca. 1685–1715 - Wanner et al. 1995; Luterbacher et al. 2001, 2004; Xoplaki et al. 2005). Several studies have suggested that the LMM exhibited recurrent winter anticyclonic conditions over eastern Europe (Luterbacher et al. 2001; Jacobeit et al. 2003; Pauling et al. 2006). More specifically, Wanner et al. (1995) indicated an enhanced blocking frequency in the 1690’s decade, and Kington (1999) indicated that in the 1698 winter, the circulation over the British Isles was dominated by blocking conditions.
Table 1.1 Ranked coldest top 10 months and winters in Central England, for the period 1659-2013. From Burt (2013).
1. Introduction
9
Fig. 1.5 European summer temperatures for 1500-2010. Statistical frequency distribution of
best-guess reconstructed and instrument-based European ([35°N, 70°N], [25°W, 40°E]) summer land temperature anomalies (degrees Celsius, relative to the 1970-1999 period) for the 1500-2010 period (vertical lines). The five warmest and coldest summers are highlighted. Gray bars represent the distribution for the 1500-2002 period, with a Gaussian fit in black. (Bottom) The running decadal frequency of extreme summers, defined as those with temperature above the 95th percentile of the 1500-2002 distribution. A 10-year smoothing is applied. Dotted line shows the 95th percentile of the distribution of maximum decadal values that would be expected by random chance. From
Barriopedro et al. (2011).
Some of the most remarkable extreme temperature episodes in Europe correspond to recent major summer heatwaves, sometimes coined mega-heatwaves (Barriopedro et al. 2011; Miralles et al., 2014). The striking heatwave of 2003 affected large parts of western and central Europe, and caused substantial socio-economic impacts, including excessive mortality, damages in agricultural crops (Poumadere et al., 2005; García-Herrera et al., 2010) or intensive wildfires (e.g. Trigo et al., 2006b). This persistent episode, culminating in the first two weeks of August, reached summer temperature anomalies as large as 5ºC (Black et al., 2004). Another outstanding episode occurred in the summer of 2010 - the warmest summer at the European scale since at
1. Introduction
10
least 1500 (Barriopedro et al. 2011). This prolonged episode caused unprecedented catastrophic wildfires, and increased mortality in Russia. These mega-heatwaves lasted for a period longer than usual and achieved record-breaking temperatures over extensive swathes of land, thus being also unusual from a full summer seasonal perspective (Fig. 1.5). While the exceptional 2010 Russian event was unambiguously associated with persistent blocking over the area (e.g., Barriopedro et al. 2011; Dole et al. 2011), the characterization of the weather conditions that occurred during the mega-heatwave of 2003 was not so clear, with some studies pointing to blocking systems (e.g., Trigo et al., 2005) and others suggesting an anomalous northward intrusion of sub-tropical ridges (e.g., García-Herrera et al. 2010). Given the outstanding effects of the 2003 event, it is of paramount importance to characterize these two weather systems and disentangle their associated impacts. This question will be further addressed in Section 1.2.
1.1.3 European precipitation regimes
A wide range of approaches to characterize atmospheric circulation and its links with European precipitation regimes is available in the literature, ranging from teleconnection patterns to weather type catalogues (e.g., Barry and Carleton 2001). The role of the NAO has been recurrently analyzed, with its positive phase being associated to a stronger Jetstream and wetter conditions in central and northern areas of Europe (e.g. Trigo et al., 2008), and drier than average conditions in southern areas of the European continent (Lavers and Villarini, 2013). This dipole of positive (negative) correlation between the NAO and precipitation in northern (southern) regions represents the leading canonical correlation mode between atmospheric circulation and European precipitation inter-annual variability (e.g., Trigo et al., 2008). This signature is particularly relevant in autumn, winter and spring, with weaker links obtained in summer, where the NAO effects are more restricted to northern areas of the continent and the Balkans (Folland et al., 2009; Bladé et al. 2012). Vicente-Serrano and López-Moreno (2008) have analyzed the nonstationary influence of the NAO in European precipitation, pointing to inter-decadal shifts in the location of the NAO pressure centers, and to a general trend towards a strengthening of the NAO-precipitation relationship over most of Europe during the 20th century.
Other teleconnection indices have been widely linked with anomalous European precipitation, such as the SCA (related to high-latitude blocking occurrence over Scandinavia), or the EA pattern (Trigo et al., 2008; García-Herrera and Barriopedro, 2017). Figure 1.6 shows the European areas affected by some of the most relevant modes of variability for precipitation inter-annual variability. The role of global phenomena such as ENSO should also not be disregarded (Pozo-Vázquez et al., 2005; Bulic et al., 2012). Taking into account the reasonable predictability of the ENSO, several authors have explored this link in order to improve the skill of seasonal forecast for Europe. However, this is not easy to achieve, as the influence of the ENSO signal on the European climate is seasonal- and regional-dependent, not linear with respect to the magnitude of the ENSO event, and depends on other inter-annual and even inter-decadal variability modes (e.g. Brönnimann, 2007).
1. Introduction
11
At shorter time scales, several authors have linked Weather Types daily classifications with precipitation regimes. For example, Cortesi et al. (2014) used a Lamb classification to analyze the spatial variability of Iberian precipitation, following pioneering works in this topic, such as Trigo and DaCamara (2000). Circulation Weather Types have often been used to characterize regional responses, as they are usually defined and calibrated on relatively small domains, thus reflecting atmospheric configurations at synoptic. Differently, European precipitation responses to large-scale atmospheric systems, such as blocking, can be explored by describing blocking-related synoptic conditions (Trigo et al., 2004). Using this approach, European blocking has been found to exert a large influence on winter precipitation over large areas of Europe (Trigo et al., 2004). For seasons other than winter, the impacts of blocking remain unexplored. In addition, a regional classification of blocking is needed, since blocking occurrence within different longitudinal sectors can lead to very distinct synoptic configurations. These questions will be addressed in Chapter 3, paying special attention to the precipitation responses over the Iberian Peninsula in Chapter 4.
Fig. 1.6 Spatial distribution of the dominant large-scale phenomenon influencing precipitation
inter-annual variations during winter (DJF, left panel) and summer (JJA, right panel) seasons of the 1951-2013 period. Colors identify the large-scale phenomenon with the largest Spearman correlation coefficient with seasonal-mean precipitation data. Dots highlight areas displaying significant correlations with more than one teleconnection pattern. The following large-scale phenomena are considered in the analysis: North Atlantic Oscillation (NAO), East Atlantic pattern (EA), East Atlantic / Western Russian pattern (EA/WR), Scandinavian pattern (SCA), El Niño index (NINO3.4) and the high-summer NAO (SNAO). Adapted from García-Herrera and Barriopedro (2017).
1.1.4 Drought conditions throughout the 20th century
Droughts are complex events with severe environmental, economic and social impacts. From a meteorological and hydrological point of view, droughts can be defined as shortages in water availability throughout prolonged periods, which may be considered at different time-scales, depending on the specific water resource we are interested in (Vicente-Serrano et al., 2010).
1. Introduction
12
In Europe, droughts have recurrently affected wet areas, such as western and central Europe (Rebetez et al., 2006), eastern Europe (Spinoni et al., 2013) or Scandinavia (Hisdal et al., 2006). Spinoni et al. (2015) have shown that droughts have been more frequent in northern Europe and Russia in the 1950s and 1960s, whilst for central areas it was during the 1970s, and for southern European regions in the later decades of the 20th century (see Fig. 1.7). In agreement with such
assessment, Lloyd-Hughes and Saunders (2002) stated that the secular trend in rainfall has been positive in the region from the Alps to northern Scandinavia, while a drying tendency is found for eastern Europe and Mediterranean regions.
Fig. 1.7 Annual series of areas in drought conditions (12-month scale) for different European
regions. The bold lines represent the 5-year moving weighted averages. Adapted from Spinoni et al.
(2015).
Overall, most concerns have been centered in semi-arid regions, such as southern Europe, and in particular, over the Mediterranean basin (Hoerling et al., 2012; Vicente-Serrano et al., 2014). The observed drying trends (particularly notable in the late 20th century) have persisted during the beginning of the 21st century. Major drought episodes have occurred in the western
Mediterranean during 2005 (García-Herrera et al., 2007) and 2012 (Trigo et al., 2013a), with an almost continuous drought in the eastern Mediterranean and the contiguous unstable area of the Fertile Crescent (Trigo et al., 2010; Kelley et al., 2015). This has raised concerns on water availability in the region, especially taking into account the drying and warming projected scenarios for the Mediterranean area (e.g. Giorgi and Lionello, 2008), with the resulting increases in evapotranspiration demand and drought severity (Vicente-Serrano et al. 2010).
1. Introduction
13
Fig. 1.8 Percentages of area under wet (blue) and dry (orange) conditions in the Mediterranean
basin during the 20th century. From Sousa et al. (2011).
Sousa et al. (2011) studied the trends and extremes in drought conditions in the Mediterranean and a few subareas during the 20th century (Fig. 1.8). They found that the positive phase of the NAO during winter is the main large-scale circulation pattern driving severe moisture scarceness in southwestern Europe, while the SCA pattern becomes more relevant for central Mediterranean areas (in agreement with the precipitation assessment provided in Fig. 1.6). The link between water balance and sustained anomalies in European, which are strongly connected to perturbations in the mean zonal flow, suggests that atmospheric blocking may play a role in the hydrological balance. This issue will be further discussed in Chapter 5.
1. Introduction
14
1.2. Atmospheric blocking: climatology and associated
impacts
1.2.1 Blocking definition
There is no universally accepted definition for atmospheric blocking, although it can be fundamentally described as a suppression of the normal westerly flow in mid-to-high latitudes due to the presence of a relatively stationary high-pressure system. In this sense, several features are generally accepted as specific characteristics of a standard blocking system, as summarized by Barriopedro et al. (2010a), namely:
1) a large-scale high pressure system with a quasi-stationary anticyclonic circulation located on the usual track of the prevailing westerlies;
2) spatio-temporal signatures typical of the large-scale, with lifetimes spanning from a few days to several weeks;
The traditional definition of blocks consists in a split-flow regime, with an associated low-pressure system located southwards of the blocking structure (Rex 1950b). However, such a dipole is not observed during the so-called Omega block, where the flow reversal is tightly connected to a high-latitudinal extension of the sub-tropical ridge belt, and negative anomalies in the geopotential height field are located southwest and southeast of the blocking center (Barriopedro et al., 2006). Two examples of these typical blocking patterns are depicted in Fig. 1.9.
Fig. 1.9 The 500-hPa height field showing typical blocking patterns: (a) Omega block (6 Mar 1948)
1. Introduction
15
The exact definition of blocking has been a matter of wide discussion in the scientific community, and several indices and methodologies for detection have been developed. As expected, the use of different definitions may result in discrepancies in the blocking climatologies, namely in their frequency and location (Barriopedro et al., 2010a). Most of the approaches have been based on the 500 hPa geopotential height (Z500) or, on dynamical fields (vertically integrated Potential Vorticity, PV, or Potential Temperature on the dynamical tropopause, PT). Generally speaking, these algorithms impose certain criteria in terms of minimum spatial extension and temporal duration (some criteria are objective and other subjective). Still, there are profoundly different rationales in these methodologies, particularly in what concerns the use of absolute vs. anomaly (departure) fields. As such, blocking methodologies can be classified into two groups:
1) The flow reversal or wave-breaking approach, which identifies blocks as an easterly geostrophic flow around a reference Jetstream latitude, using absolute Z500 or PT fields (e.g., Tibaldi and Molteni, 1990; Trigo et al., 2004; Barriopedro et al., 2006);
2) Persistent departures from the climatological mean of the Z500 or PV fields (e.g. Dole and Gordon, 1983; Knox and Hay, 1985; Schwierz et al., 2004).
These methodologies, originally proposed by Tibaldi and Molteni (1990) and Dole and Gordon (1983) and, hereafter TM and DG, respectively, have been modified with further features and criteria in subsequent works (e.g. Barriopedro et al. 2006, 2010a; Masato et al., 2011).
All methods present specific caveats and shortcomings. Regarding the DG index, some of the main criticisms are based on the difficulty of defining proper thresholds for blocking detections, and the fact that a variety of synoptic situations which cannot be defined as blocking may be detected as so, such as northward shifts of the jet or amplifications of subtropical or subpolar anticyclones. Methodologies based on departure fields, such as DG have also the disadvantage of requiring longer time-series, in order to create robust climatological reference fields (Barriopedro et al., 2010a).
On the other hand, the 1-D nature of the TM methodology is a limiting factor, not allowing the 2-D description of the blocking structure. Another limitation of this method has been ascribed to the eventual identification of blockings due to the occurrence of cut-off lows. Also, early stages of block development and some Omega blocks can be missed using this approach, due to the too demanding extension and flow reversal criteria. Several modifications to the original algorithm have been introduced in order to minimize such problems, including a 2-D extension of the TM method (e.g., Barriopedro et al. 2006; Woollings et al. 2008; Davini et al. 2012a). Using this 2-D diagnosis of blocking, Davini et al. (2012a) explored the distinction between high-latitude and low-latitude blocking, noting that the latter structures are unable to divert or completely block the zonal flow. This example highlights the need to distinguish high- and low-latitudinal high pressure systems and to explore their dynamical characteristics, as detailed in the following sub-sections.
Throughout this thesis, the climatology of high-latitude blocking and the impacts on the European continent will be addressed relying on the catalogue developed by Barriopedro et al.
1. Introduction
16
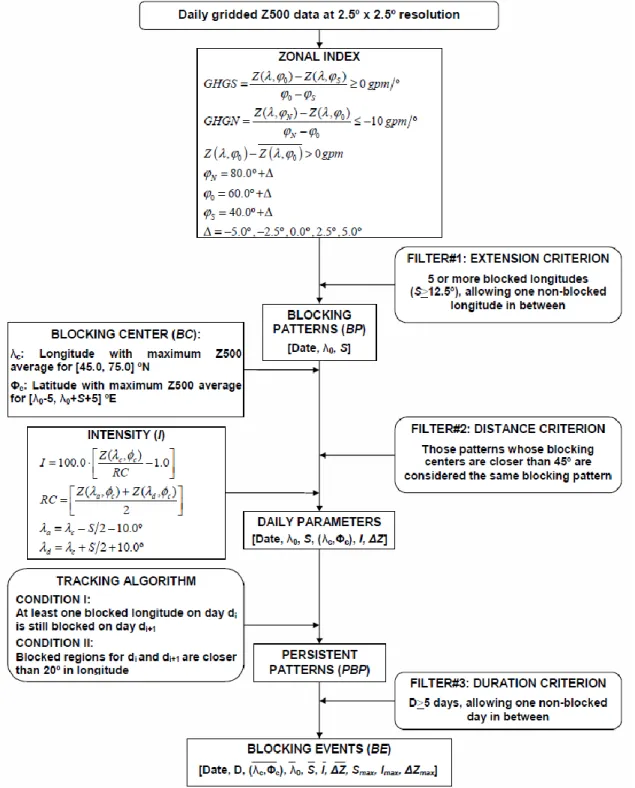
(2006), which results from a 2-D adapted version of the Tibaldi and Molteni (1990) index. A schematic of this automated detection algorithm is presented in Fig. 1.10, using daily Z500 data on a 2.5º x 2.5º grid as input.
Fig. 1.10 Schematic of the automatic blocking detection method used throughout the thesis. From Barriopedro et al. (2006).
1. Introduction
17
According to the scheme from Fig. 1.10, two Z500 gradients (GHGN and GHGS) have been simultaneously computed for each longitude on the NH and for each day of study, where Z(λ,ϕ) is the Z500 at a given longitude λ and latitude ϕ. GHGS is proportional to the zonal geostrophic wind component and provides a measure of the zonal flow intensity for each longitude, while GHGN is imposed in order to exclude non blocked flows. A given longitude is considered blocked when both GHGN<-10gpm/º and GHGS>0gpm/º for at least one of the five Δ values, evaluated around a reference latitude Φ0, and simultaneously the Z(λ,Φ0) anomaly is positive. A large-scale instantaneous blocking pattern is detected when there are at least five blocked longitudes. The method includes a tracking algorithm to follow the daily evolution of these blocking patterns by demanding a minimum overlapping between them, and a blocking event is said to occur when the blocking pattern persists for at least five days.
This detection scheme also incorporates a procedure to detect the 2-D center of each blocking pattern (defined as the gridpoint with the maximum Z500 within the anticyclonic flow), and the blocking intensity. The final catalogue includes individual blocking events, tracked on a daily basis, with daily information about their central location, longitudinal extension and intensity. In this thesis, this daily catalogue is used to identify blocking occurrence in different longitudinal sectors, according to their central location, as it will be described in detail further ahead in Section 2.1
Furthermore, taking advantage of the Z500 gradients (GHGN and GHGS), a catalogue of strong zonal westerly flows is also computed, by simply identifying days with zonal flow as those characterized by GHGS<22.5gpm/º, following the approach developed in Trigo et al. (2004). This distinction between zonal and blocked days will be exploited in the following Chapters.
1.2.2 Euro-Atlantic blocking climatology
Some fundamental characteristics of blocking climatology in the NH, and in the particular frame of the Euro-Atlantic sector, are discussed in this section. For this purpose, the blocking catalogue described in Section 1.2.1 has been used, and several diagnostics such as frequency of occurrence, mean duration, mean extension, and blocking life-cycles are herein presented. The comprehension of these blocking climatological features is an important first step to understand their associated impacts on different meteorological fields at local and regional scales, as it will be discussed throughout the remaining chapters of this thesis.
There are two preferential areas of blocking occurrence in the NH, which overlap with the climatological regions of wave amplification and the exit zones of the principal storm-tracks (i.e., the eastern sides of the Atlantic and Pacific oceans, e.g., Barriopedro et al. 2010a). This is clear in Fig. 1.11, which shows the annual and seasonal frequencies of the blocking centers. The largest frequencies are located in the longitudes surrounding the Greenwich Meridian (between the British Isles and Scandinavia), and near the international date line in the Pacific area. Even though they occur throughout the whole year, blocking is more frequent during winter and spring (e.g. Tibaldi et al., 1994, Barriopedro et al., 2006; Masato et al., 2011). In summer, there is a
1. Introduction
18
smoother distribution, with a larger tendency for blocking to occur in continental areas and at higher latitudes. In the Euro-Atlantic region, this northeastward migration of blocking locations leads to a third smaller maximum close to the Urals mountain range, a feature already known (Tibaldi and Molteni, 1990; D’Andrea et al., 1998). In autumn, Pacific blocking occurrence decreases, while it persists in the Euro-Atlantic region, although less frequently when compared to winter and spring. Overall, these preferred locations at the seasonal scale are in agreement with those found in other works that used either subjective identification of blocks or detection schemes based on the TM approach (Treidl et al. 1981; Wiedenmann et al. 2002).
Annual
Winter Spring
Summer Autumn
Fig. 1.11 Climatological mean blocking center frequency (in percentage of days per year/season),
1. Introduction
19
The duration distribution of NH blocking episodes presents the well-known one side tailed distribution (Fig. 1.12). This is observed through the whole year, although long-lasting blocks (more than 20 days) are more frequent in winter and spring. A similar seasonal behavior is observed for the spatial extension of the blocking patterns (not shown), with blocking covering larger areas during the coldest seasons of the year.
Annual
Winter Spring
Summer Autumn
Fig. 1.12 Climatological distributions of blocking episodes duration in the Northern Hemisphere for
1. Introduction 20 Annual Winter Spring Summer Autumn
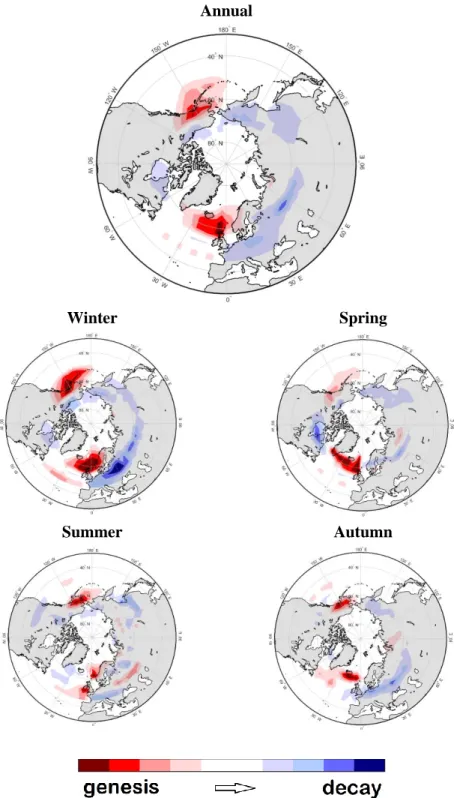
Fig. 1.13 Climatologically preferred blocking genesis and decay locations for the period 1950-2012.
Red (blue) areas represent locations where the difference between the percentage of days with blocking centers in the early and mature stages is positive (negative). The two first (last) days of detection within the life cycle of each blocking event were considered for early (mature) stages.
![Fig. 1.5 European summer temperatures for 1500-2010. Statistical frequency distribution of best- best-guess reconstructed and instrument-based European ([35°N, 70°N], [25°W, 40°E]) summer land temperature anomalies (degrees Celsius, r](https://thumb-eu.123doks.com/thumbv2/123dok_br/15180728.1015862/31.918.162.748.109.653/european-temperatures-statistical-frequency-distribution-reconstructed-instrument-temperature.webp)