www.ann-geophys.net/32/147/2014/ doi:10.5194/angeo-32-147-2014
© Author(s) 2014. CC Attribution 3.0 License.
Annales
Geophysicae
Variations in the occurrence of SuperDARN F region echoes
M. Ghezelbash1, R. A. D. Fiori2, and A V. Koustov1
1University of Saskatchewan, Saskatoon, Canada
2Geomagnetic Laboratory, Natural Resources Canada, Ottawa, Canada
Correspondence to:M. Ghezelbash ([email protected])
Received: 29 July 2013 – Revised: 6 December 2013 – Accepted: 14 January 2014 – Published: 20 February 2014
Abstract.The occurrence of F region ionospheric echoes ob-served by a number of SuperDARN HF radars is analyzed statistically in order to infer solar cycle, seasonal, and diur-nal trends. The major focus is on Saskatoon radar data for 1994–2012. The distribution of the echo occurrence rate is presented in terms of month of observation and magnetic lo-cal time. Clear repetitive patterns are identified during pe-riods of solar maximum and solar minimum. For years near solar maximum, echoes are most frequent near midnight dur-ing winter. For years near solar minimum, echoes occur more frequently near noon during winter, near dusk and dawn during equinoxes and near midnight during summer. Sim-ilar features are identified for the Hankasalmi and Prince George radars in the northern hemisphere and the Bruny Island TIGER radar in the southern hemisphere. Echo oc-currence for the entire SuperDARN network demonstrates patterns similar to patterns in the echo occurrence for the Saskatoon radar and for other radars considered individually. In terms of the solar cycle, the occurrence rate of nightside echoes is shown to increase by a factor of at least 3 toward solar maximum while occurrence of the near-noon echoes does not significantly change with the exception of a clear depression during the declining phase of the solar cycle.
Keywords. Ionosphere (auroral ionosphere; ionospheric ir-regularities) – radio science (ionospheric propagation)
1 Introduction
The SuperDARN HF radars monitor global-scale plasma convection patterns by measuring the Doppler velocity of coherent echoes received from the F region ionosphere. An abundance of such echoes is a critical factor for producing re-liable convection maps. It has been established that the rate of
echo detection with the SuperDARN radars varies with radar location, time of day, season and solar cycle (e.g., Milan et al., 1997; Ruohoniemi and Greenwald, 1997; Koustov et al., 2004; Kane et al., 2012). It has been reported that solar il-lumination conditions (Bristow et al., 2011), interplanetary magnetic field (IMF) magnitude and orientation (Ballatore et al., 2000), occurrence of magnetic storms (Kumar et al., 2011), and substorms (Wild and Grocott, 2008) affect echo detection. The characteristics of the variations seem to be somewhat different in the northern and southern hemi-spheres; for example, the southern hemisphere radars show much stronger equinoctial maxima (Koustov et al., 2004). Changes in propagation conditions for radio waves to reach ionospheric irregularities and irregularity production factors have been discussed as reasons for variations in echo occur-rence. Although these factors have been identified, their rel-ative role is not well understood and there is no unifying ex-planation of echo occurrence trends encompassing most of the data.
2 Data selection and processing
2.1 Approach
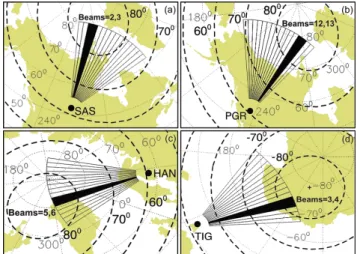
To assess echo occurrence rates for the SAS radar, we consid-ered data in beams 2 and 3 which are directed toward the ge-omagnetic pole, Fig. 1a. These meridionally oriented beams were chosen to reduce variability in echo occurrence due to different orientation of the beams with respect to the average convection pattern. Beams 2 and 3 are orientated near the ge-ographic meridian resulting in very little difference between MLT and local time (LT). Only observations in the standard operation mode (2 min or 1 min scans) were considered. In practice, there were usually at least 10–15 days of measure-ments for each month.
Echo occurrence rate was computed as a ratio of the num-ber of registered echoes in every 45 km radar resolution cell to the total number of observations in this cell. Ratios were averaged for each 10 min of observations in magnetic lo-cal time and binned in 1-degree bins of magnetic latitude. Magnetic local time was computed by taking into account the geographic coordinates of the center of a radar cell and universal time. Only ionospheric echoes stronger than 3 dB were counted. Our approach is similar to that of Koustov et al. (2004). For presentation, obtained occurrence rate values were further averaged over 1 h intervals of each month.
In this study, data from 3 other SuperDARN radars, de-signed to monitor auroral zone latitudes, are presented. These are the Prince George (PGR) and Hankasalmi (HAN) radars in the northern hemisphere (Fig. 1b, c, respectively), and the Bruny Island TIGER (TIG) radar in the southern hemisphere, Fig. 1d. For these radars we also selected beams oriented roughly along the magnetic meridians, Fig. 1b–d. This en-sures that the differences between MLT and LT are minimal, which is not the case for those SuperDARN radars whose fields of view are oriented in an east–west direction. The PGR, HAN and TIG radars were selected because they had been operated continuously for several years over the consid-ered period. Occurrence rates for these radars were computed in the same way as for the SAS radar. Echo occurrence data for the entire SuperDARN network will also be presented. Here the total number of points on each individual 2 min con-vection map was considered.
2.2 Latitudinal profile of echo detection
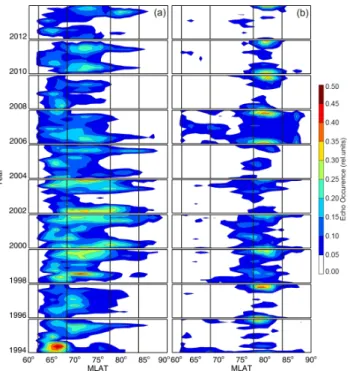
Figure 2 shows SAS dusk (17:00–19:00 MLT) and noon (11:00–13:00 MLT) echo occurrence rates at all available magnetic latitudes for observations between 1994 and 2012, for every second (even) year. Data presentation was lim-ited to even years of observations to simplify the plot; fewer data allows one to more easily recognize both general trends within the solar cycle and minor variations within an individ-ual year. Similar plots were produced for other time sectors. For the dusk sector, the latitudinal spread of enhanced echo
Fig. 1.Field of views of the(a)Saskatoon (SAS),(b)Prince George
(PGR), and(c)Hankasalmi (HAN) SuperDARN radars in the
north-ern hemisphere and(d)Bruny Island TIGER (TIG) SuperDARN
radar in the southern hemisphere. The beams considered (labeled by numbers) are shaded by black.
occurrence is larger than for other time sectors, and this is why these data are presented in Fig. 2a. For the noon sec-tor, Fig. 2b, latitudinal coverage is smaller and changes from year to year are not as strong as for the dusk sector. Figure 2 indicates it is important to consider observations in various sectors separately.
According to Fig. 2a, at low MLATs of < 68◦where echoes are most likely coming from the E region the maxima are rec-ognizable as “patches” of light blue-greenish color. These are not as strong (with the exception of 1994) as echo occurrence patches with red color at higher latitudes, which correspond to F region echoes.
Fig. 2.Saskatoon SuperDARN radar echo occurrence rates at all available magnetic latitudes in the dusk sector (17:00–19:00 MLT) and noon (11:00–13:00 MLT) for the even years in the period of 1994–2012.
3 Data presentation
3.1 Hourly occurrence rates
Figure 3 is a contour plot of hourly-averaged (over each month) occurrence rate for SAS radar observations during (a) minimum solar cycle activity (2008–2010) and (b) maxi-mum solar cycle activity (2000–2002) in terms of month and MLT. For solar minimum (Fig. 3a), there is a clear pattern of a change in the location of maximum echo occurrence. In each year the pattern resembles a diamond having peak oc-currence near noon in the winter months and near midnight in the summer months. Echoes occur less frequently dur-ing summer months near noon and winter/equinox months near midnight. The pattern is repetitive from one year to an-other. The pattern is less developed for dawnside observa-tions (00:00–12:00 MLT), as is evident by the stronger oc-currence rates (light blue and green) on the duskside of the plot (12:00–24:00 MLT). One can notice, although not very clearly, that blobs of enhanced echo occurrence in Fig. 3a are located close to equinoctial dusk time (months 3 and 9, at 18:00 MLT).
There is a different pattern for solar maximum (Fig. 3b). Echo occurrence also follows a diamond-like structure. The boundary between high and low echo occurrence rate mark the edges of the diamond; regions of low echo occurrence (blue color) and high echo occurrence constitute the inte-rior and exteinte-rior of the diamond, respectively. Overall, echo
Fig. 3.Saskatoon SuperDARN radar echo occurrence for periods
of(a)minimum solar activity (2008–2010) and(b)maximum solar
activity (2000–2002) as a function of MLT time. Data in beams 2,
3 and magnetic latitudes of F region echo detection (68◦–84◦) were
considered. The dashed and solid white lines represent the
termina-tor line at the earth’s surface for MLAT = 72◦and 82◦,
correspond-ing roughly to the expected centers of echo bands for one-half-hop and 1.5-hop propagation modes, respectively. The white dotted line shows seasonal variation of an ionospheric point with constant
so-lar zenith angle of 108◦(corresponding to a sunset at the height of
∼300 km) at MLAT = 72◦ (a similar line for MLAT = 82◦ differs
from the dotted line insignificantly and not shown).
occurrence rate is larger in all regions compared to Fig. 3a. Echo occurrence rates are maximized (dominance of red color) on the nightside (∼18:00–06:00 MLT). During win-ter months maximum echo occurrence extends toward noon hours. Largest occurrence rates are observed during equinoc-tial dusk-to-midnight hours. These equinocequinoc-tial maxima are more evident than those in Fig. 2a because they are more ex-tended in MLT.
3.2 Solar cycle effects in the noon and midnight sectors
Data of Fig. 3 indicate that the echo occurrence rates vary with the magnetic local time of observations, and the char-acter of the “season-MLT” pattern changes as the solar cycle progresses. The contrast in absolute values of occurrence is very obvious for the midnight sector and not so in the noon sector. We investigate this effect in more details.
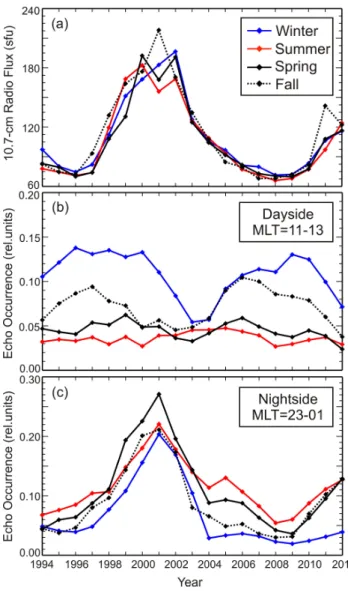
Figure 4 shows season-averaged occurrence rates for ev-ery year of SAS observations since 1994 along with season-averaged 10.7 cm flux of solar radiation, characterizing the solar cycle phase. Data for near noon (11:00–13:00 MLT) and near midnight (23:00–01:00 MLT) are presented sepa-rately. Near noon (Fig. 4b), data for summer (red line) and spring equinox (black solid line) months do not indicate a long-term trend. In contrast, winter observations (blue line) show a depression in occurrence rate in 2003–2004, imme-diately following the solar cycle maximum (∼2001–2002), on the declining phase of the solar cycle 23. Interestingly enough, toward the solar cycle 24 maximum (2012), the oc-currence rate drops again. For the fall equinox (black dotted line), the occurrence rates are depressed during years of solar cycle maximum, anti-correlating with the 10.7 cm radio flux changes.
Near midnight (Fig. 4c), variations of the echo occurrence are the same for all seasons with about a 3-fold increase to-ward the solar cycle maximum. It is interesting that the oc-currence rates are largest during summer months for periods of solar cycle minimum and summer and equinoctial months for periods of solar cycle maximum. We note that the dusk and dawn sector data show the smallest solar cycle increase.
3.3 Results for other radars and the entire SuperDARN network
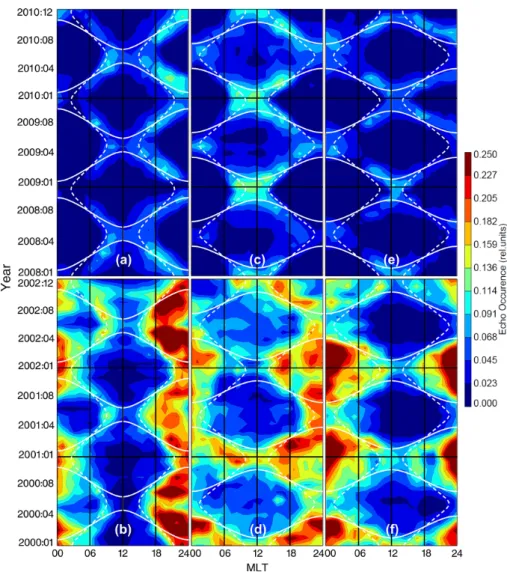
Recently, Kane et al. (2012) investigated the TIG (Bruny Is-land) SuperDARN radar data in the southern hemisphere and identified a pattern of enhanced F region echo occurrence on the month–MLAT plane. The pattern (that they termed “butterfly”) is very similar to the pattern we report here for the SAS radar with an offset in appearance because the first month of the year is summer in the southern hemisphere while it is winter in the northern hemisphere. There are some SAS–TIG differences that will be discussed here. To identify these differences, TIG data were processed similarly to the SAS data (Fig. 3a, b) for the same time periods. We consid-ered data in meridionally oriented beams of 3 and 4 (Fig. 1d). The results are shown in Fig. 5a, b. Figure 5 is a contour plot of hourly-averaged (over each month) occurrence rate for TIG radar observations during (a) minimum solar cycle activity (2008–2010) and (b) maximum solar cycle activity (2000–2002) periods in terms of month and MLT. The dif-ferences between observations of SAS (Fig. 3a, b) and TIG (Fig. 5a, b) are as follows.
Fig. 4.Season-averaged(a)10.7 cm radio flux;(b)SAS radar echo occurrence for observations near noon hours (11:00–13:00 MLT);
(c)SAS echoes near midnight hours (23:00–01:00 MLT). All data
in the period of 1994–2012 were considered. The 10.7 cm radio flux data were provided by National Geophysical Data Center (http:// www.ngdc.noaa.gov/).
1. During solar minimum years (2008–2009), the TIG radar shows less contrast in occurrence rates be-tween near-noon winter and near-midnight summer echoes and between rates for the 00:00–12:00 MLT and 12:00–24:00 MLT sectors. The TIG data often show a clear enhancement of echo occurrence during equinoctial months for both dawn and dusk hours. The TIG data show local depressions in echo occurrence around noon.
3. The TIG data do not show as drastic a change in the shape of the echo occurrence pattern over the solar cy-cle.
Another difference between TIG and SAS, identifiable from long-term data records (beyond what is shown in Fig. 5) is that although TIG shows a decrease in near-noon echo oc-currence rates away from the solar cycle maximum, a subse-quent recovery toward the next solar cycle 24 maximum (as is seen for SAS in Fig. 4, blue line) does not happen.
Despite the above differences between the SAS and TIG data, the overall pattern of echo occurrence on the “month– MLT” plane is the same, especially for solar minimum con-ditions.
A natural question is whether the pattern is a common fea-ture for other SuperDARN radars. We processed data for a number of other northern hemisphere radars and found very similar features for the PGR, HAN, Rankin Inlet and Inuvik radars. As additional examples, we present PGR and HAN radar data in Fig. 5c–f. For the solar minimum period, both plots show a “diamond-like” pattern. The winter near-noon maxima are much stronger for PGR, and are shifted to the pre-noon hours. HAN occurrences are the smallest out of the three northern hemisphere radars considered, but the pat-tern is remarkably the same. For the solar maximum period, the patterns on both plots show strong occurrence enhance-ment during winter near-midnight hours. On a finer scale, the patterns of these near-midnight enhancements are some-what different. The PGR pattern is closer to that of TIG with local depressions in occurrence during the middle of winter (November–December). The HAN pattern is closer to that of SAS with a strong enhancement during the entire winter. The HAN radar shows the strongest contrast between sum-mer near-noon and winter near-midnight echo occurrences. Judging by color in Fig. 5c–f, the 00:00–12:00 MLT occur-rences are slightly smaller, overall, than 12:00–24:00 MLT occurrences for PGR and they are about the same for HAN.
Since the inferred pattern of seasonal and MLT/LT vari-ations in echo occurrence seems to be similar for at least several northern hemisphere and one southern hemisphere SuperDARN radars, we hypothesized that it might be seen in data for the entire network. To explore this hypothesis, we plot in Fig. 6 total number of grid points in terms of month and MLT over the years of minimum and maximum of the solar activity. In Fig. 6 (and later in Fig. 7) the data are binned differently as compared to our previous diagrams. “Grid points” are the standard SuperDARN bins of geomag-netic latitude and longitude (1◦ in MLAT and
∼111 km in MLON) as introduced by Ruohoniemi and Baker (1998). Figure 6 was obtained by counting total number of echoes in 1 h MLT sectors at all magnetic latitudes for all northern hemisphere radars. Note that data were initially filtered to remove contributions from E region echoes by only consid-ering echoes at ranges of > 630 km.
Data for solar cycle minimum (2008 and 2009) show a “diamond-like” pattern of increased number of points, con-sistent with the pattern of increased echo occurrence in Figs. 3a and 5a, c, e. Here the pattern for 2010 is more con-fusing, but afternoon–dusk “shoulders” of a diamond-like pattern are recognizable by red sloped regions. For solar cy-cle maximum, the pattern of Fig. 6b is reminiscent of that shown in Figs. 3b and 5b, d, f for the occurrence rate, with clear enhancements during winter near-midnight hours. A decrease in the number of near-noon summer echoes is ob-vious for both cases. Since all the SuperDARN radars and all radar beams and magnetic latitudes were considered in producing of Fig. 6, the data suggest that the existing Su-perDARN radars have a more-or-less common pattern in the variation of echo occurrence with MLT, season and solar cy-cle.
4 Discussion
Despite the significant database accumulated for the SAS radar, its echo occurrence rates have not been investigated in many aspects. Huber (1999) explored Saskatoon radar data for 1997 and reported that wintertime F region echoes are mostly detected in two time sectors: near noon and later in the afternoon close to the dusk sector. Hosokawa et al. (2001) merged SAS data with data from other Canadian radars for periods of solar minimum and showed that winter and sum-mer time echoes are more frequent on the dayside and night-side, respectively. They also noticed a separate region of enhanced echo detection in the afternoon–dusk sector and related those to the sectors of favorable conditions for the gradient drift instability operation in the ionospheric trough which is highly expected at these latitudes and during these hours. Koustov et al. (2004) considered SAS observations near midnight for years 1996–2001 (i.e., from the minimum to the maximum of solar cycle 23). The paper focused on two discrete bands of magnetic latitude, 70.5◦and 75.5◦. The authors found evidence for equinoctial maxima; they were more obvious at the solar minimum and at lower latitudes. Danskin (2004) reported that Hankasalmi midnight echoes are more frequent for summer months during solar minimum and winter months during solar maximum. During transi-tional years, equinoctial maxima were evident. Liu (2010) considered data averaged over 24 h for 2007 and showed that at far ranges of echo detection, through 1.5-hop propagation mode, the SAS equinoctial maxima are much stronger than at near ranges of echo detection, through one-half-hop prop-agation mode. Overall the seasonal variation was not found to be strong.
Fig. 5.Echo occurrence rates for periods of minimum solar activity (2008–2010, top row) and maximum solar activity (2000–2002, bottom
row) as a function of MLT time for the Bruny Island (TIG,aand b), Prince George (PGR,cand d) and Hankasalmi (HAN, eandf)
SuperDARN radars. Roughly meridional beams for each radar were considered as indicated in Fig. 1b, c, d. Only magnetic latitudes of F region echo detection were considered. The dashed and solid white lines represent the terminator line at the earth’s surface for, roughly, the expected centers of the one-half-hop and 1.5-hop echo bands.
maxima of occurrence located along a diamond with corners located near noon for winter months and near midnight for summer months. We note that Milan et al. (1997) consid-ered a limited data set of the early Hankasalmi SuperDARN observations and found that during winter, the radar echoes at MLAT = 80◦are mostly detected during daytime with two local maxima, one during pre-noon hours and another during post noon hours. The maxima appear to become more sep-arated in terms of time towards summer time. The plots of Fig. 3 for SAS and Fig. 5c–f for HAN and PGR are thus con-sistent with the finding of Milan et al. (1997). Our analysis of the entire HAN database showed one interesting and impor-tant difference in the HAN plots: the overall echo occurrence is comparable or even slightly larger on the dawnside (00:00– 12:00 MLT) than on the duskside (12:00–24:00 MLT).
Fig. 6.Contour plot for the total number of grid points on Super-DARN convection maps (cumulative over all magnetic latitudes of
echo detection) for observations in the periods of(a)minimum solar
activity (2008–2010) and(b)maximum solar activity (2000–2002)
as a function of MLT time.
by Ruohoniemi and Greenwald (1997). Figure 3 shows that the winter–summer contrast in echo occurrence is larger dur-ing solar maximum. This is consistent with the fact that the winter anomaly becomes stronger during solar maximum. In terms of the MLT/LT effect, a decrease of winter echo occur-rence away from the near-noon hours can be related to the decrease of the electron density in the dark polar cap winter ionosphere (Ghezelbash, 2013).
In terms of diurnal variation, the SAS radar showed en-hanced echo occurrence during noon–dusk hours. Kane and Makarevich (2010) explained a similar effect for the TIG radar by improved propagation conditions (refraction) dur-ing these hours. Similar explanations can be used for the SAS data presented in the current study. As mentioned, the HAN radar does not show such a strong contrast between pre-noon and afternoon occurrences (Fig. 5e, f). This seems to be inconsistent with the explanation of Kane and Makare-vich (2010), but we discovered that within the HAN field of view (FoV), F region electron density is typically larger during pre-noon hours (the density data for the Sodankyla ionosonde, within the HAN FoV, can be found in Ghezel-bash, 2013).
Thus the near-noon SAS data indicate that propagation condition is the most important factor for echo detection in this sector of observation. Milan et al. (1998) argued that near noon the echo band covers about the same MLATs ir-respective of whether the echoes are received through a one-half-hop or 1.5-hop propagation path. In a sense, the radar echo band reflects the physical boundaries in the ionosphere within which there are enhanced fluctuations of the electron density (ionospheric irregularities). This effect, with more extended database, covering both years of the solar cycle
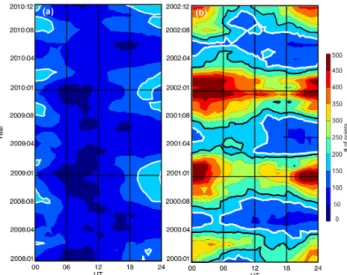
Fig. 7.Contour plot for the hourly-averaged number of grid points
on individual 2 min SuperDARN convection maps for periods of(a)
minimum solar activity (2008–2010) and(b)maximum solar
activ-ity (2000–2002) as a function of UT time. The white line is the con-tour with the number of points at 150 (both panels) and 200 (panel
b); in regions with a lower number of points a SuperDARN
convec-tion map based on the data is expected to be globally unreliable.
minimum and maximum, is well seen in the data of Fig. 2b. Figure 2b indicates that the band of near-noon echoes does not shift much within the solar cycle. The TIG data are also consistent with this conclusion except the band becomes much wider during solar cycle maximum. We believe that the SAS, HAN, PGR and TIG observations do not contradict our conclusion on the primary role of propagation conditions as we investigate the overall echo occurrence at all latitudes.
If the occurrence of near-noon echoes is indeed strongly controlled by propagation factors, we have to relate the de-pression in occurrence of noon winter and spring equinox echoes near/right after the solar cycle maximum (Fig. 3) re-ported in this study with a deterioration of propagation condi-tions. We are not aware of evidences that would support this conclusion. If we adopt the notion by Milan et al. (1998), mentioned above, we must conclude that the irregularity pro-duction deteriorates during these periods as well. It is hard to understand why this would happen. Information on electric field variations and plasma gradient creation over the solar cycle is needed to assess this possibility.
electric field on the gradient-drift instability in the F region, see e.g., Tsunoda, 1988). Both the effects and the explana-tion are applicable to our case for the SAS radar. Also, less frequent echo occurrence in the post-midnight and morning sectors can occur due to enhanced radio wave D region ab-sorption associated with substorm activity in the midnight sector. All these effects can explain the asymmetry in echo occurrence for the 00:00–12:00 MLT and 12:00–24:00 MLT periods.
An interesting question is on the role of the termina-tor/sunset lines in the occurrence pattern on the “month– MLT” plane. For periods of solar minimum, the terminator line is within/close to the region of maximum echo detection rate for the one-half-hop propagation mode, Figs. 3 and 5. The 300 km sunset line reflects a significant drop in echo oc-currence (transition from dark blue to light blue). This prob-ably means that the ionosphere near the terminator (the so called “grey” ionosphere as known to radio amateurs) pro-vides the best propagation conditions for HF radio waves, and this is the major factor in the frequent detection of HF echoes. The 1.5-hop propagation mode signals are mostly observed in the dark ionosphere but still for the periods with smallest solar zenith angle (Figs. 3 and 5). Having no direct sunlight is advantageous in terms of “hiding” the ionosphere (essentially, the polar cap ionosphere) from the harmful ef-fect of the solar radiation on irregularity production, an efef-fect that was very clearly articulated by Ruohoniemi and Green-wald (1997) for the Goose Bay radar. On the other hand, no solar radiation and a less dense ionosphere would not al-low for sufficient refraction and strong enough backscattered echo power (e.g., Bristow et al., 2011). The high echo de-tection rates near-noon (mostly through 1.5-hop propagation mode) means there is a certain balance between these factors. For periods of solar maximum, Kane et al. (2012) noticed that the terminator line is not really a special line on the oc-currence plots as echoes are equally frequently detected well prior and well after the sunset. This is despite the fact that only quiet days were selected in their paper. In our analy-sis all observations were considered, and the terminator line is a separation line between the sectors of highest and rel-atively low echo occurrence. The 300 km sunset line does not indicate a significant change in echo occurrence during nighttime of 2001–2002, from the fall equinox to winter and to spring equinox. This result is consistent with that of Kane et al. (2012). For other two winter times of Fig. 3b (January– March 2000, September 2000–March 2001 and September– December 2002) the line is not far from the periods of a sharp decrease in echo occurrence (a transition for red to yel-low). This is different from the report by Kane et al. (2012). Our results imply that during the solar cycle maximum there are additional factors (besides transition from sunlit to dark ionosphere) controlling the onset of F region echoes. Kous-tov et al. (2004) argued that increases in the occurrence of strong plasma gradients and electric fields are potentially two additional factors for nighttime observations. Unfortunately,
there is no obvious way to check the validity of this hy-pothesis although there are several indirect arguments. First of all, it is well established that the cross polar cap poten-tial, that drives the ionospheric plasma globally, correlates well with the IMFBz component (e.g., Fiori et al., 2009).
Near-solar cycle maximum, large IMFBzvalues occur more
frequently and one would expect generally faster convection flows/electric fields in the ionosphere. Secondly, it is known that particle precipitation and aurora occurrence are more fre-quent during solar cycle maximum.
Another interesting question is whether the F region echo occurrence shows equinoctial maxima. Koustov et al. (2004) reported the effect to be strongest for Syowa East (SYE) and Halley (HAL) radars in the southern hemisphere and less pronounced for the HAN and North American radars in the northern hemisphere for observations near midnight. Data presented in this study allow us to look at the issue with more details.
radar, then, statistically speaking, time sectors with bet-ter/worse radar coverage can be identified for individual con-vection maps, no matter how many SuperDARN radars are operational. One can infer from Fig. 6 that the sectors of weaker occurrence are located near noon for summer time observations during solar maximum periods. For the so-lar minimum conditions, the echoes occur less frequently near midnight for winter months and near noon for summer months. Having periods with decreased echo coverage for the entire network does not mean that an increase in the number of SuperDARN radars is not needed; it only points to regions where SuperDARN convection patterns will be less reliable. In fact, an increase in the number of SuperDARN radars is highly desirable. To illustrate this statement, Fig. 7 plots the average number of points per SuperDARN convection map in terms of month and UT of observation for the same pe-riods considered in this paper. We note that the number of points per map is a very important parameter in SuperDARN work. While studying the SuperDARN cross polar cap po-tential, Mori and Koustov (2013) discovered that for this pa-rameter not to be affected by the startup convection model (and thus to have a globally reliable convection pattern) one has to have at least 200 points on each map. We attempted to put the 200 point contour on both plots of Fig. 7 but discov-ered that for the minimum of solar activity period the clos-est reasonably identifiable contour was 150 points. The 150 point contour has therefore been enhanced in Fig. 7a. For solar maximum conditions we selected the 200-point con-tour (Fig. 7b). In Fig. 7b, near the solar cycle maximum (2000–2003), maps consistently have > 200 points, with the exception of summer months. The situation changes dramat-ically for periods of solar minimum (Fig. 7a). Here maps are only expected to be reliable for near midnight in the winter periods and for early morning (right after midnight) in the near-equinoctial periods. We have to stress here that the pat-tern on Fig. 7 is effectively a longitude/geographic variation, given that the data are now averaged over all available MLTs. Therefore, the variations in this figure are not due to geophys-ical differences betwee the local time, but are likely to be due to the uneven distribution of radars with longitude (first of all, a significant gap in Russian sector of Arctic). Data of Fig. 7a, b thus clearly indicate that further improvement of the quality of the SuperDARN convection mapping can only be achieved through the installation of additional radars. This process is under way with recent installation of new radars in both hemispheres. This expansion improves radar coverage of higher and lower magnetic latitudes. Although this is a very important development, our analysis indicates that im-provement of the longitudinal coverage is more desirable, as far as global convection pattern monitoring is concerned.
5 Conclusions
In this study we investigated the F region echo occurrence rates for a number of SuperDARN HF radars with an empha-sis on the Saskatoon SuperDARN radar data for 1994–2012. We showed the following:
1. Echo occurrence experiences significant diurnal, sea-sonal and solar cycle variations. Patterns of echo oc-currence in terms of month and MLT of observation are highly repetitive. For solar cycle minimum con-ditions, the pattern has maxima during winter noon hours, equinoctial dusk/dawn hours and summer mid-night hours. For solar cycle maximum conditions, the pattern changes drastically with most echoes being ob-served during nighttime for all seasons with more ex-tended periods of time during winter.
2. While nighttime echo occurrence increases by at least a factor of 3 toward the solar cycle maximum, the near-noon echo occurrence does not significantly change for summer and fall equinox and there is a very clear de-pression on the declining phase of the solar cycle for winter and spring equinox.
3. By considering the number of grid points available for the entire SuperDARN network in various MLT sec-tors and all magnetic latitudes, we showed that the pat-tern of increased number of points in “month–MLT” coordinates is essentially the same as the pattern of in-creased echo occurrence of the Saskatoon radar alone. This means that the network has decreased coverage for all MLTs of summer time during periods of solar maximum and near midnight for winter months and near noon for summer months during periods of solar minimum.
Acknowledgements. The Saskatoon SuperDARN radar operation is jointly funded by the Canadian Space Agency and NSERC (Canada). The research is supported by an NSERC Discovery grant to A. V. Koustov. Operation of northern hemisphere SuperDARN radars is supported by funding agencies of Canada, France, Japan, the UK and the US. Operation of the Bruny Island TIGER radar in the southern hemisphere is supported by a consortium of institu-tions: La Trobe University, University of Newcastle, Monash Uni-versity, Australian Antarctic Division, ISR Division DSTO and IPS Radio and Space Services. The 10.7 cm radio flux data are provided by National Geophysical Data Center (http://www.ngdc.noaa.gov/). The authors thank P. V. Ponomarenko for numerous comments, help in computations and suggestions in the process of this work. Criti-cism and suggestions of the reviewers are appreciated.
Topical Editor K. Hosokawa thanks D. Danskin and one anony-mous referee for their help in evaluating this paper.
References
Ballatore, P., Villain, J. P., Vilmer, N., and Pick, M.: The influence of the interplanetary medium on SuperDARN radar scattering oc-currence, Ann. Geophys., 18, 1576–1583, doi:10.1007/s00585-001-1576-2, 2000.
Bristow, W. A., Spaleta, J., and Parris, R. T.: First observations of ionospheric irregularities and flows over the south geomagnetic pole from the Super Dual Auroral Radar Network (SuperDARN) HF radar at McMurdo Station, Antarctica, J. Geophys. Res., 116, A12325, doi:10.1029/2011JA016834, 2011.
Danskin, D. W.: HF auroral backscatter from the E and F re-gions, Ph.D. Thesis, University of Saskatchewan, available at: http://hdl.handle.net/10388/etd-10242003-121305 (last access: 17 February 2014), 2004.
Fiori, R. A. D., Koustov, A. V., Boteler, D., and Makarevich, R. A.: PCN magnetic index and average convection velocity in the polar cap inferred from SuperDARN radar measurements, J. Geophys. Res., 114, A07225, doi:10.1029/2008JA013964, 2009.
Ghezelbash, M.: Occurrence and causes of F-region echoes for the Canadian PolarDARN/SuperDARN radars, M.Sc. Thesis, University of Saskatchewan, available at: http://hdl.handle.net/ 10388/ETD-2013-03-949 (last access: 17 February 2014), 2013. Hosokawa, K., Iyemori, T., Yukimatu, A. S., and Sato, N.: Source of field-aligned irregularities in the subauroral F region as observed by the SuperDARN radars, J. Geophys. Res., 106, 24713–24731, 2001.
Huber, M.: HF radar echo statistics and spectral studies using Su-perDARN, M.Sc. Thesis, University of Saskatchewan, 1999.
Kane, T. A. and Makarevich, R. A.: HF radar observations of the F region ionospheric plasma response to Storm Sudden Commencements, J. Geophys. Res., 115, A07320, doi:10.1029/2009JA014974, 2010.
Kane, T. A., Makarevich, R. A., and Devlin, J. C.: HF radar obser-vations of ionospheric backscatter during geomagnetically quiet periods, Ann. Geophys., 30, 221–233, doi:10.5194/angeo-30-221-2012, 2012.
Koustov, A. V., Sofko, G. J., André, D., Danskin, D. W., and Benke-vitch, L. V.: Seasonal variation of HF radar F region echo oc-currence in the midnight sector, J. Geophys. Res., 109, A06305, doi:10.1029/2003JA010337, 2004.
Kumar, V. V., Makarevich, R. A., Kane, T. A., Ye, H., Devlin, J. C., and Dyson, P. L.: On the spatiotemporal evolution of the iono-spheric backscatter during magnetically disturbed periods as ob-served by the TIGER Bruny Island HF radar, J. Atmos. Sol.-Terr. Phys., 73, 1940–1952, 2011.
Liu, H.: Study of the high-latitude ionosphere with the Rankin In-let PolarDARN radar, M.Sc. Thesis, University of Saskatchewan, available at: http://hdl.handle.net/10388/etd-03232010-114923 (last access: 17 February 2014), 2010.
Milan, S. E., Yeoman, T. K., Lester, M., Thomas, E. C., and Jones, T. B.: Initial backscatter occurrence statistics from the CUTLASS HF radars, Ann. Geophys., 15, 703–718, doi:10.1007/s00585-997-0703-0, 1997.
Milan, S. E., Yeoman, T. K., and Lester, M.: The dayside auroral zone as a hard target for coherent HF radars, Geophys. Res. Lett., 25, 3717–3720, 1998.
Mori, D. and Koustov, A. V.: SuperDARN cross polar cap po-tential dependence on the solar wind conditions and com-parisons with models, Adv. Space Res., 52, 1155–1167, doi:10.1016/j.asr.2013.06.019, 2013.
Ruohoniemi, J. M. and Baker, K. B.: Large-scale imaging of high-latitude convection with Super Dual Auroral Radar Network HF radar observations, J. Geophys. Res., 103, 20797–2081, 1998. Ruohoniemi, J. M. and Greenwald, R. A.: Rates of scattering
occur-rence in routine HF radar observations during solar cycle maxi-mum, Radio Sci., 32, 1051–1070, 1997.
Tsunoda, R. T.: High latitude irregularities: A review and synthesis, Rev. Geophys., 26, 719–760, 1988.