UNIVERSIDADE DE LISBOA
Lisbon School of Economics & Management
THREE ESSAYS ON PUBLIC INVESTMENT
VERSUS PRIVATE INVESTMENT
Inácia Carvalho Dias Ferreira Pimentel Pacheco Pereira
Orientador: Prof. Doutor Miguel St. Aubyn
Tese especialmente elaborada para obtenção do grau de
Doutor em Economia
UNIVERSIDADE DE LISBOA
Lisbon School of Economics & Management
THREE ESSAYS ON PUBLIC INVESTMENT VERSUS PRIVATE INVESTMENT
Inácia Carvalho Dias Ferreira Pimentel Pacheco Pereira
Orientador: Prof. Doutor Miguel Pedro Brito de St. Aubyn
Tese especialmente elaborada para obtenção do grau de Doutor em Economia
Júri:
Presidente:Doutor Nuno João de Oliveira Valério, Professor Catedrático e Presidente do Conselho Científico do Instituto Superior de Economia e Gestão da Universidade de Lisboa
Vogais:
Doutor Paulo Manuel Marques Rodrigues, Professor Catedrático Convidado, Nova School of Business & Economics da Universidade Nova de Lisboa
Doutor António Manuel Pedro Afonso, Professor Catedrático, Instituto Superior de Economia e Gestão da Universidade de Lisboa
Doutor Miguel Pedro Brito de St. Aubyn, Professor Catedrático, Instituto Superior de Economia e Gestão da Universidade de Lisboa
Doutor Manuel António da Mota Freitas Martins, Professor Auxiliar com Agregação, Faculdade de Economia da Universidade do Porto
Doutor Jorge Miguel Lopo Gonçalves Andraz, Professor Auxiliar com Agregação, Faculdade de Economia da Universidade do Algarve
To my mother and my father for supporting me unconditionally. To my dear husband Duarte, love of my life.
vii
Acknowledgements
First of all I would like to express my gratitude to my advisor Professor Miguel St. Aubyn for his constant support, knowledge and immense patience with me. This thesis would not be possible without him.
A heartfelt thanks to Professor Paulo Rodrigues an exceptional human being not only in his academic and research skills, but above all one of the greatest people I ever had the chance to meet. His immense wisdom, his good will and willingness to help others were and will be an inspiration to me.
Two of the three essays included in this dissertation were written in coauthorship. Apart from my coauthors Professor Miguel St. Aubyn and Professor Paulo Rodrigues, I am also immensely grateful to my dear colleague: Nuno Ribeiro. I am sure that the quality of these essays would not be the same without all the work of my coauthors.
A heartfelt thank you to Inês Drumond, deputy director of the Stability Department at Banco de Portugal, for her encouragement, care and motivation.
I would also like to thank Vanessa Smith and Alessandro Galesi for making their codes available and also thank the valuable help from Alessandro Galesi, who was always willing to clarify my questions.
I gratefully acknowledge the four-year financial support from Fundação para a Ciência e Tecnologia, which was essential for proceeding with the PhD.
I thank my friend Rita Abegão and João Nuno Silva for always being there when I needed them, and also my dear friend João Miguel Falcão for sharing this journey with me.
No acknowledgments would be complete without thanking my family.
My husband Duarte, thank you for all your patience, support, and love. We make a great team together. I love you!
viii
To my son Duarte and to my daughter Francisca, thank you for making me the happiest and proudest mother on Earth. I hope that when you grow older I can make you as proud of me as I am of you. I love you so much that you cannot imagine!
Last, I have to thank my parents. To my dear mother for always being there when I need her, for expressing her love for me every single day of my life, for being a great example as a mother, and as a woman and for being the best grandmother my children could have. To my dear father for his intelligence that inspires me every day, for always supporting all my decisions, for being the sweetest father and for being the best grandfather my children could have. This thesis is dedicated to you, mom and dad.
ix
Abstract
The capacity of public consumption, public investment, and private investment to influence the economic activity has been a research topic for decades, however, there is no consensus about the qualitative effects of fiscal policy. The main goal of this dissertation is to deepen the understanding about what role public intervention, through PPPs, public consumption, and public investment, may play in boosting economic activity and to compare it with the results from innovations in private investment.
In the first essay the macroeconomic impact of investment in PPPs, public and private investment in Portugal was tested using a VAR model. The results show that public and private investment has a positive effect in GDP while investment in PPP reduces the Portuguese output. Moreover, an increase in PPP investment crowds-out both private and public investment, while public investment presents a crowding-in effect in both private investment and investment in PPP; and private investment shows the same crowding-in effect in both investment in PPP and public investment. In the second essay, a VAR was applied to a panel data for 14 OECD countries to investigate the dynamic impact of public consumption, public investment, and private investment on the average output of these countries. We find that public consumption plays an active role only in those economies which suffered severe economic consequences in the recent crisis. On the contrary, private investment allows a boost in the output of all the countries under analysis. Finally, in the third essay, a GVAR approach was used to test for the cross-country spillover effects of an increase in public and private investment in 16 countries. The findings show statistically significant cross-border effects mainly in neighboring countries, with the magnitude of the impacts being modest.
xi
Contents
Acknowledgements . . . . . . . .
1. Introduction . . . .
2. The impact of investment in Public Private Partnerships on Public, Private Investment and GDP in Portugal . . . .
2.1. Introduction . . . .
2.2. Literature Review . . . .
2.3. Econometric methodology . . . .
2.3.1 VAR specification . . .
2.3.2 Macroeconomic rates of return . . .
2.3.3 Crowding-in and crowding-out effects . . .
2.4. Empirical Results . . . . . . .
2.4.1 Data . . .
2.4.2 VAR estimation . . .
2.4.3 Rates of return . . .
2.4.4 Crowding-in and crowding-out effects . . . vii 1 8 8 10 13 13 15 16 17 17 17 18 19
xii
2.5.Conclusions . . . .
2.6 Appendix . . .
3. The Dynamic Impact of Government Spending and Public Private Investment on Output: Panel VAR Evidence from 14 OECD Countries . . .
3.1. Introduction . . . .
3.2. Econometric methodology . . . .
3.2.1 Data . . .
3.2.2 Structure of the model . . .
3.2.3 Unit Root Tests . . .
3.2.4 Lag Length Decision . . .
3.3. Dynamic Analysis . . .
3.3.1 Impulse Response Functions . . .
3.3.2 Variance Decomposition . . .
3.3.3 Robustness tests . . .
3.4. Conclusions . . .
3.5. Appendix . . .
4. The Impact of Public Investment on Peripheral Economies: A Global VAR Analysis. . .
4.1. Introduction . . . .
4.2. GVAR approach - Literature Review . . . .
4.3. Econometric methodology . . . . 21 24 28 28 30 31 32 34 34 35 35 43 44 45 46 53 53 55 58
xiii
4.3.1 Structure of the GVAR model . . .
4.4. Estimation . . .
4.4.1 Data . . .
4.4.2 Trade and Financial Weights . . . .
4.4.3 Unit Root Tests . . .
4.4.4 Estimation of the Country-specific . . . . . . .
4.4.5 Testing for Weak Exogeneity . . .
4.4.6 Impact Elasticities . . .
4.4.7. Robustness of the GVAR results to time-varying weights . . . .
4.5. Dynamic Analysis . . . .
4.5.1. Generalized Impulse Response Functions . . . .
4.5.1.1. Shock to Public Investment . . .
4.5.1.2. Shock to Private Investment . . .
4.6. Conclusions . . . . 4.7. Appendix . . . . . . 5. Concluding remarks . . . . 58 60 60 61 61 62 62 63 63 64 64 65 69 73 75 84
xiv
List of tables
2.1 Unit root tests, variables in first differences: Augmented Dickey-Fuller . . .
2.2 Residual normality tests . . . . . . .
2.3 Accumulated responses to shocks in PPP, public and private investment . . .
2.4 Crowding-in or crowding-out effects resulting from an impulse in the investment in PPP . . . .
2.5 Crowding-in or crowding-out effects resulting from an impulse in public investment .
2.6 Crowding-in or crowding-out effects resulting from an impulse in private investment .
2.7 Total amount of investment in PPP between 1990-2009 in percentage of the 2009 GDP of each country . . .
2.8 List of concessions used to calculate the PPP investment . . .
2.9 Partial and total rates of returns originated by an impulse in investment in PPP . . .
2.10 Partial and total rates of returns originated by an impulse in public investment . .
2.11 Partial and total rates of returns originated by an impulse in private investment . .
3.1 Panel Unit Root Test – Im, Pesaran . . . .
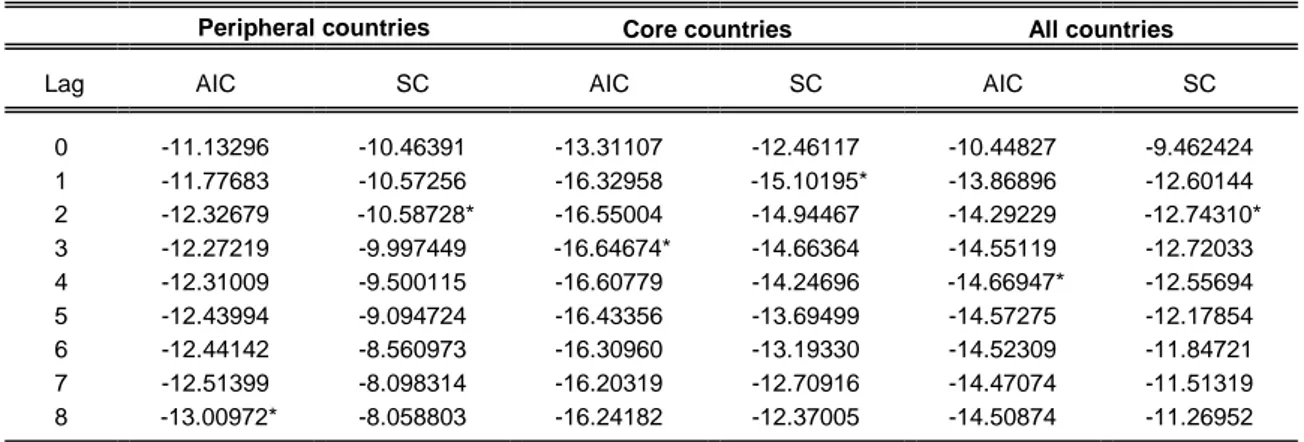
3.2 Lag Order Selection Criteria . . .
3.3 VAR Residual Serial Correlation LM Tests . . . .
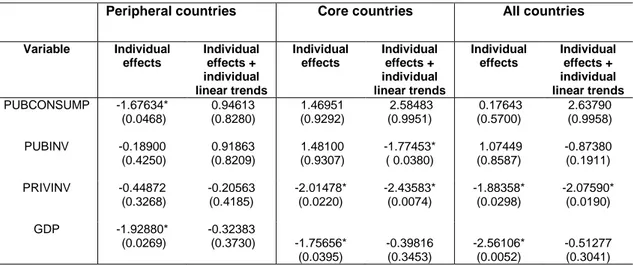
3.4 Panel VAR Estimates - Peripheral countries . . . . 17 18 19 19 20 20 24 25 26 26 27 34 35 35 46
xv
3.5 Panel VAR Estimates - Core countries . . . .
3.6 Panel VAR Estimates - All countries . . . .
3.7 Variance Decomposition - Peripheral countries . . .
3.8 Variance Decomposition – Core countries . . . .
3.9 Variance Decomposition – All countries . . .
4.1 Trade weights . . . .
4.2 Augmented Dickey-Fuller (ADF) Unit Root Test Statistic for Domestic Variables (Based on AIC Order Selection) . . .
4.3 Weighted Symmetric ADF unit root test statistics for domestic variables (Based on AIC Order Selection) . . .
4.4 Augmented Dickey-Fuller (ADF) unit root test statistics for foreign variables (Based on AIC Order Selection) . . .
4.5 Weighted Symmetric ADF unit root test statistics for foreign variables (Based on AIC Order Selection) . . .
4.6 F-statistic for testing the weak exogeneity of country-specific foreign variables . . .
4.7 Contemporaneous effects of foreign variables on their country-specific counterparts
4.8 Number of cointegration relationships in the individual VARX* models . . . 47 48 50 51 52 75 76 77 78 79 80 81 82
xvi
List of figures
2.1 Responses to shocks in PPP investment . . .
2.2 Responses to shocks in public investment . . .
2.3 Responses to shocks in private investment . . . .
2.4 Countries’ percentage shares of value of projects of European PPPs, 1990-2009 aggregate . . . .
3.1 Responses to shocks in public consumption – Peripheral Countries . . .
3.2 Responses to shocks in public investment – Peripheral Countries . . . .
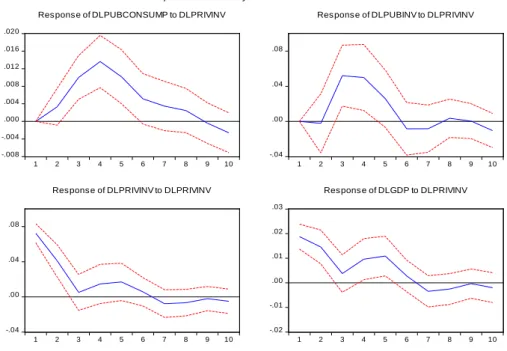
3.3 Responses to shocks in private investment – Peripheral Countries . . .
3.4 Responses to shocks in public consumption – Core Countries . . . .
3.5 Responses to shocks in public investment – Core Countries . . . .
3.6 Responses to shocks in private investment – Core Countries . . .
3.7 Responses to shocks in public consumption – All Countries . . .
3.8 Responses to shocks in public investment – All Countries . . . . .
3.9 Responses to shocks in private investment – All Countries . . . . .
4.1 GIRFs of GDP to a 1 s.e. positive shock to Germany’s Public Investment . . . . .
4.2 GIRFs of Private Investment to a 1 s.e. positive shock to Germany’s Public Investment . . .
4.3 GIRFs of Public Investment to a 1 s.e. positive shock to Germany’s Public Investment . . . . 22 23 23 27 36 37 38 39 40 40 41 42 42 65 66 66
xvii
4.4 GIRFs of GDP to a 1 s.e. positive shock to Portugal’s Public Investment . . .
4.5 GIRFs of Private Investment to a 1 s.e. positive shock to Portugal’s Public Investment . . . .
4.6 GIRFs of Public Investment to a 1 s.e. positive shock to Portugal’s Public Investment . . . .
4.7 GIRFs of GDP to a 1 s.e. positive shock to Germany’s Private Investment . . .
4.8 GIRFs of Private Investment to a 1 s.e. positive shock to Germany’s Private Investment . . .
4.9 GIRFs of Public Investment to a 1 s.e. positive shock to Germany’s Private Investment . . . . .
4.10 GIRFs of GDP to a 1 s.e. positive shock to Portugal’s Private Investment . . .
4.11 GIRFs of Private Investment to a 1 s.e. positive shock to Portugal’s Private Investment . . . .
4.12 GIRFs of Public Investment to a 1 s.e. positive shock to Portugal’s Private Investment . . . . .
4.13 GIRF of Oil Price to a 1 s.e. positive shock to Germany’s Public Investment . . . .
4.14 GIRF of Oil Price to a 1 s.e. positive shock to Portugal’s Public Investment . . . .
4.15 GIRF of Oil Price to a 1 s.e. positive shock to Germany’s Private Investment . . .
4.16 GIRF of Oil Price to a 1 s.e. positive shock to Portugal’s Private Investment . . . . 67 68 68 69 70 71 72 72 73 82 83 83 83
1
Chapter 1
Introduction
The capacity of public consumption, public investment, and private investment to influence economic activity has been a research topic for decades. In fact, in advanced economies an increase in public investment is one of the few remaining policies available to push economic growth, and in developing economies an increase in infrastructure investment will allow the much needed expansion of these countries’ productive capacity.
A large body of empirical literature has been investigating the impact of public capital on the private sector and on the economy as a whole. However, there is no consensus about the qualitative effects of fiscal policy: the integration properties of the variables, the fact that production functions are estimated with differenced data, or if pooled regressions carried out with fixed effects can heavily influence the results, Dreger and Reimers (2014). As pointed out by Perotti (2007), so far the literature has not been able to provide robust stylized facts on the effects of fiscal policy shocks. While Keynesian economists predict an increase in private consumption and investment and, consequently, a boost in economic performance following an innovation on government spending, neoclassicals argue that after a positive shock to government consumption there will be a withdrawal of resources from the private sector that is expected to reduce private consumption and investment.
From a theoretical perspective, an increase in public investment can have two opposite effects on private investment, e.g. Aschauer (1989b) and Mittnik and Neumann (2000). On the one hand, an increase in public investment needs to be financed. If public and private sectors compete, at least partially, for the same resources, the costs for private investment will rise, causing a decrease in private investment, thereby leading to a crowding-out effect. Conversely, in a crowding-in scenario, an increase in public investment can create more favorable conditions for private sector investment, especially through the development of facilities that can increase private capital productivity.
2
One way to finance public investment is through Public Private Partnerships (PPP). It is well known that in the 1980s and 1990s an extensive privatization program took place in the countries of Western Europe. These privatizations were based on the idea that the private sector shows higher efficiency standards in the management of companies in comparison to public management. However, some reservations remained about the private sector’s capacity to ensure the management of natural monopolies and large infrastructure with high sunk costs more efficiently than the public sector. In the latter case, PPP imposed itself, more recently, as an alternative method for financing investment projects traditionally funded by taxation and executed in the sphere of public sector.
Against this background, the main goal of this dissertation is to deepen the understanding about what role public intervention, through PPPs, public consumption, and public investment, may play in boosting economic activity and to compare it with the results from innovations in private investment. In fact, in an economic environment such as the European Monetary Union (EMU), in which fiscal policy is the only instrument that governments have to offset idiosyncratic shocks, it is crucial to determine the capacity of public consumption and public investment to influence the economic activity of a country. Moreover, the recovery of the euro area over the last decade has been slow, weak, and uneven. After the 2007-2008 crisis some euro area countries accumulated large and persistent current account deficits, while other member states presented high and persistent surpluses. This situation leads to questioning the role of current account surplus countries in the European economy recovery.
To investigate these questions we use three different econometric methodologies. First, we use of a VAR-model technology. This type of model makes it possible to identify a shock to a variable, which is an innovation that may occur independently from other variables. It also has the advantage of allowing the evaluation of the dynamic effects of all variables in the analysis and overcomes the issue of endogeneity of the regressors. Next, we use a panel VAR in which, as in a VAR, all variables are treated as endogenous and interdependent. However, the panel VAR approach allows for unobserved individual heterogeneity, adding a cross sectional dimension to the model. In fact, the dynamic interdependencies, the static interdependences, and the cross sectional interdependencies distinguish the panel VARs typically used in macroeconomics and financial analyses from the initial work of Holtz Eakin, et al. (1988), in which interdependencies were disregarded and sectoral homogeneity was assumed. As put by Canova and Ciccarelli (2013) “a panel VAR is similar to large scale VARs where dynamic and statistic interdependencies are allowed for. It differs because cross sectional
3 heterogeneity imposes a structure on the covariance matrix of the error terms.” In this case, annual data were used instead of quarterly observations, as there is no quarterly calendar for fiscal policy, and for that reason shocks identified with annual data may be closer actual shocks. The main drawback of annual data is the exclusion of within-year responses to shocks and also the fact that fewer observations are available. Being so, to increase the precision of our estimates a panel VAR data was used. Moreover, this study relies on macroeconomic time series data alone for shock identification, not imposing any restriction of the responses of the key variables to shocks to public consumption, public investment, and private investment.
Last, we use a Global Vector Autoregressive (GVAR) modeling approach introduced by Pesaran, Schuermann, and Weiner (2004). This type of model combines individual country-specific models, in which domestic variables are related to country-specific foreign variables that match the relative importance of the rest of the world for the country under consideration, providing an effective way to deal with the curse of dimensionality. Though GVAR models are linear, they allow for a range of different interdependencies between variables and countries, such as theory consistent long-run relationships, short-run spillover effects, or cross-sectional dependence in the error structure. Thus, they offer a fair degree of flexibility in modeling business-cycle dynamics of the world economy in a coherent fashion. In the cases of both the VAR and the Panel VAR approach, the impacts of the shocks were analyzed taking into account the results from the Impulse Response Functions (IRF) and Variance Decomposition. In a GVAR context of multi-countries and several variables, General Impulse Response Functions (GIRFs) are preferable to the standard IRFs proposed by Sims (1980), which assume orthogonal shocks. It is known that if IRFs are calculated using different orders of variables, then the shape of the IRFs will be different. In fact, if the model is estimated using a reduced number of variables, a relationship between the variables can be inferred based on economic theory. However, this approach is not valid for the GVAR model since it typically contains a large number of variables. Moreover, traditional IRFs are difficult to use in a GVAR since there is no realistic way to order the countries in the model.
This dissertation comprises three essays on the relationship between public and private investment based on macroeconomic evidence.
The first essay was written in co-authorship with Miguel St. Aubyn and Nuno Ribeiro and tests the macroeconomic impact of investment in PPPs, public and private investment in Portugal, through a VAR model with four variables: public investment, private investment, PPP investment, and GDP, for the period 1998-2013. The focus on Portugal is due to
4
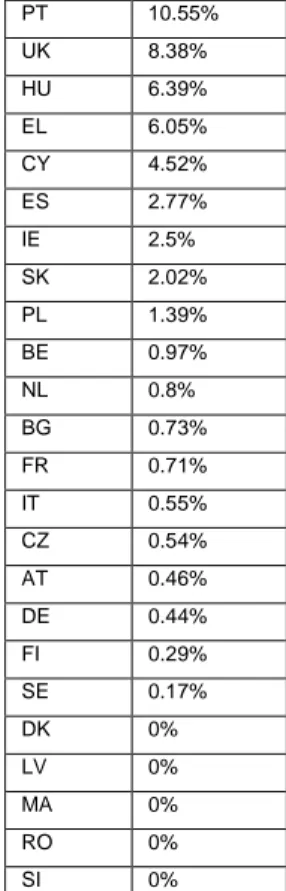
two main reasons. First, Portugal is the European country that between 1990 and 2009 spent the highest amount of money in PPP as a percentage of its GDP (10.55%), representing 7% of the value expended in European PPPs and being the third largest PPP market by value in Europe, as can be seem in Table 2.7 and Figure 2.4. Second, the Economic Adjustment Programme for Portugal demanded a study of the impact in the country’s economy of the investment made in PPPs:
The annual review of PPPs and concessions will be accompanied by an analysis of credit flows channelled to PPPs through banks (loans and securities other than shares) by industry and an impact assessment on credit allocation and crowding out effects. This particular element will be done in liaison with the Bank of Portugal. , in European Economy, Occasional Papers, June 2011, page 70.
Being so, an assessment of crowding-in/crowding-out effects of investment in PPPs is carried out.
We also calculate the macroeconomic rates of return on investment in PPP, public investment, and private investment seeking to quantify the impact of each of these components of investment in GDP. In fact, from a macroeconomic point of view, it is important to have a criterion for assessing the desirability of the investment financed through PPPs, in contrast to public investment and private investment. To date, studies about PPP are very polarized between those in favor and those against PPP, have been mainly of a microeconomic nature, and come to very different conclusions. Pollit (2002) write that “in a sample of ten major PFI case evaluations undertaken, the best deal was
probably obtained in every case, and good value for money was probably achieved in eight of the ten cases.”. On the contrary, Pollock, Shaoul, and Vickers (2002), Monbiot
(2002), Bloomfield, Westerling, and Carey (1998), Greve (2003), and Walker and Walker (2000) studied PPPs in the United Kingdom, United States, Europe, and Australia, respectively and were unanimous in concluding that PPP were not the best option if VfM is taken into account. Presently, the focus of investigation related to PPP has been changing. In fact, a new purpose is to understand the reasons why governments choose PPPs for investment in public infrastructures (Greve and Hodge 2008).
The main novelty of our paper is the use of a VAR-model technology applied to investment in PPPs with four variables: PPP investment, public investment, private investment and GDP. As mentioned above, this type of model allows us to identify a shock to a variable, an independent innovation, with the advantages of allowing the evaluation of dynamic effects and of overcoming the endogeneity issue. The results show that public and private investment has a positive effect in GDP while investment in
5 PPP reduces the Portuguese GDP. Regarding the crowding-in/crowding-out effects, an increase in PPP investment crowds-out both private and public investment, while public investment presents a crowding-in effect in both private investment and investment in PPP; and private investment shows the same crowding-in effect in both investment in PPP and public investment.
The second essay seeks to provide evidence on the effects of selected key macroeconomic variables to shocks to public consumption, public investment, and private investment for two distinct groups of countries that were formed according to their capacity to refinance their government debt or to bail out over-indebted banks on their own during the recent crisis of 2008-2014. Although so far the literature has been unable to provide robust stylized facts on the effects of fiscal policy shocks, it is a fact that VAR shocks to government spending seem to be associated with a rise in output. For instances, using a mixed structural VAR/event approach, Blanchard and Perotti (2002) concluded that positive government spending shocks have a positive effect on output, on hours, consumption, and real wages. Follow-up work, such as Galí, López-Salido and Vallés (2007) extended the standard new Keynesian model to allow for the presence of rule-of-thumb consumers, showing that consumption rises as a consequence to a shock in government spending. In turn, Fatas and Mihov (2002) found strong evidence in favor of the hypothesis that large governments reduce the volatility of both private and total output. However, Mountford and Uhlig (2005) and Edelberg et al. (1999) provide evidence that the response of private consumption is close to zero and not statistically significant over the entire horizon of the impulse response. Linnemann (2005) questioned if there is really a mismatch between business cycle theories and the evidence, showing that the evidence can be explained by a standard real business cycle type model. In this study, a VAR was applied to a panel data for 14 OECD countries to investigate the dynamic impact of public consumption, public investment, and private investment on the average output of these countries.
Relying on macroeconomic time series data alone for shock identification, from the results of the Impulse Response Functions and Variance Decomposition, we find that countries do not react in the same way to an impulse in public consumption, public investment and private investment. In fact, public consumption plays an active role only in those economies which suffered severe economic consequences in the recent crisis. On the contrary, private investment allows a boost in the output of all the countries under analysis. This paper relies on macroeconomic time series data alone for shock identification, thereby not imposing any restriction of the responses of the key variables to shocks to public consumption, public investment, and private investment.
6
Finally, in the third essay, written in co-authorship with Miguel St. Aubyn and Paulo Rodrigues, a GVAR approach was used to test for the cross-country spillover effects of an increase in public and private investment in 16 countries. The impact of these innovations in a central European economy (Germany) and in a peripheral one (Portugal) on the majority of the European countries, USA, and Japan were examined and quantified by employing GIRFs. The GVAR framework has been applied to various fields, such as the role of credit and credit risk diversification, which were two of the subjects; see for instance Dees, di Mauro, Pesaran, and Smith (2006), Eickmeier and Ng (2011), Xu (2012), or Pesaran, Schuermann, and Treutler (2006). Monetary union membership counterfactualscenarios were presented by Pesaran, Smith and Smith (2007) and by Dubois, Hericourt, and Mignon (2009). Cashin, Mohaddes, Raissi, and Raissi (2012) employed a set of sign restrictions on the generalized impulse responses of a GVAR model to distinguish supply-driven from demand-driven oil price shocks and to study the time profile of their macroeconomic effects in different countries. Chudik and Fidora (2012) also explored the subject of supply shocks using a GVAR model.
Inflation was another topic analyzed applying a GVAR; for details check Galesi and Lombardi (2009). Anderton, Galesi, Lombardi, and di Mauro (2010) calculated the impact of increased imports from low-cost countries on manufacturing import prices and estimated Phillips curves to explore whether the inflationary process in OECD countries changed over time. The US role as a potentially globally dominant economy was investigated by Dées and Saint-Guilhem (2011). Chudik and Smith (2013) extended the literature on the role of a globally dominant economy, once again the US, by comparing two models: one that treats the US as a globally dominant economy, and a standard version of a GVAR model that does not separate the impact of the US variables from the cross-section average of foreign economies, as in Dées, di Mauro, Pesaran, and Smith (2007). From a global imbalances perspective, Bettendorf (2012) showed that real GDP is a relatively unimportant variable compared to real exchange and interest rates and to the oil price, and also provides a counterfactual analysis of the US trade balance. Bussière, Chudik, and Sestieri (2012) studied the effects of demand shocks and shocks to relative prices on global imbalances. To the best of our knowledge the GVAR approach has not yet been used to test for cross-border spillover effects of an increase in public and private investment in the Euro area. Overall, we find that even if Germany increases its public investment, it will not have the desired positive impact on peripheral economies. The findings show statistically significant cross-border effects mainly in neighboring countries, with the magnitude of the impacts being modest
7 The three essays were written in such a way that they can be read separately. For this reason, there is some overlap between chapters regarding the background information.
8
Chapter 2
The impact of investment in Public Private
Partnerships on Public, Private Investment, and
GDP in Portugal
Co-authors:
Miguel St. Aubyn, ISEG
Nuno Ribeiro, Financial Stability Department, Banco de Portugal
2.1. Introduction
In the 1980s and 1990s an extensive privatization program took place in the countries of Western Europe. These privatizations were motivated by the idea that the private sector shows higher efficiency standards in the management of companies in comparison to public management. However, there remained some reservations about the private sector’s capacity to ensure the management of natural monopolies and large infrastructure with high sunk costs more efficiently than the public sector. In the latter case, Public-Private Partnerships (PPP) became popular, more recently, as alternatives to the traditional way of financing investment projects through taxation and execution in the public sector sphere.
This paper studies the impact of investment in Public Private Partnerships on public and private investment and GDP in Portugal. The focus on Portugal is due to two main reasons: Portugal is the European country that between 1990 and 2009, spent the greatest amount of money in PPP as a percentage of its GDP (10.55%), representing 7% of the value expended in European PPPs and being the third largest PPP market by value in Europe (see Table 2.7. and Figure 2.4. in the Appendix); and the memorandum
9 of understanding for Portugal demanded a study of the impact in the country’s economy of the investment made in PPPs.
Our assessment of crowding-in/crowding-out effects of investment in PPPs is therefore undertaken. We calculate macroeconomic rates of return on investment in PPP, public investment, and private investment, seeking to quantify the impact of each of these components of investment in GDP.
Macroeconomic theory suggests that an increase in investment in PPPs in public investment can have two opposite effects on private investment (Aschauer 1989b, and Mittnik and Neumann 2000). On the one hand, an increase in public investment in PPPs is partly funded in the capital markets, which would lead to a reduction in the funds available to private investors and to an increase in interest rates charged by lenders. This would lead to a decrease in the rate of return on private investment, thus causing crowding-out of this. Conversely, an increase in public investment in PPPs can create more favorable conditions for investment by the private sector, especially through the development of road infrastructure, railway, airports, among others. In this case, there is crowding-in in private investment.
From a macroeconomic point of view, it is important to have a criterion for assessing the desirability of the investment financed through PPPs, in contrast to public investment and private investment.
The main novelty of this paper is the use of a VAR-model technology applied to investment in PPPs with four variables: PPP investment, public investment, private investment, and GDP. This type of model allows us to identify a shock to a variable, which is an independent innovation that may occur in other variables. It also has the advantage of allowing the evaluation of the dynamic effects of all variables in the analysis and overcoming the issue of endogeneity of the regressors.
The rest of this chapter is organized as follows. Section 2.2 briefly reviews general literature about PPP and studies that have applied a VAR approach to study the impact of public and private investment on the economy. Section 2.3 describes the econometric methodology underlying our empirical application, namely, VAR specifications, macroeconomic rates of return, and the computation of crowding-in and crowding-out effects. Section 2.4 discusses the empirical results of this study. Section 2.5 summarizes the main findings, and, finally, the Appendix provides information on the list of concessions used to calculate the PPP investment.
10
2.2. Literature Review
Studies about PPP are very polarized between those in favor and those against PPP.
The term PPP has been used more frequently in the literature since the 1990s.
The public-private partnerships (PPP) phenomenon has been with us for a long time. The phrase first became used by a specialist audience in the 1970s, and books were being written about such partnerships even in the 1980s (e.g. Rose, 1986), although it was the 1990s before it was widely recognized, when the Private Finance Initiative was launched by the John Major administration in the UK, and the acronyms ‘PPP’ became common currency. However, the actual phenomenon goes much further back into history. (Bovaird 2010).
It is used to refer to different types of contracts between the public and private sector. (Argy 1999).
However there is some consensus concerning the key elements of a PPP. As can be found in Commission of the European Communities (2004), the main elements that characterize a PPP are:
(…) the relatively long duration of the relationship, involving cooperation between the public partner and the private partner (…); (…)the method of funding the Project, in part from the private sector, sometimes by means of complex arrangements between the various players(…); (…)the distribution of risks between the public partner and private partner(…).
Other definitions can be found in Van Ham and Koppenjan (2001) and Lossa and Martimort (2008).
Broadbent and Laughlin (1999) were pioneers in this field of investigation, raising five main questions for the study of PPPs in England, namely:
Is PFI a form of privatisation of the public sector? What is the nature of PFI and who is regulating its application? How are definitions of PFI in terms of value for money and risk transfer derived and operationalised? How are PFI decisions made in different areas of the public sector and what
are the effects of these decisions? What is the merit and worth of PFI?The question of value
for money (VfM) has been largely discussed concerning PPPs. Hodge and Greve (2008)
argue that:
Value for Money is a purposely vague concept and one designed to reorient the language of debate away from traditional concerns such as choosing the “cheapest” competitive construction bid which meets the public interest, towards discussion of whole-of-life costs, risk transfers and risk-adjusted discounted rates for specific large projects.
The studies carried out to evaluate PPPs performance have been until now mainly of a microeconomic nature and come to very different conclusions. Pollit (2002) says that “in
11
obtained in every case, and good value for money was probably achieved in eight of the ten cases.” Pollock, Shaoul, and Vickers (2002), Monbiot (2002), Bloomfield, Westerling,
and Carey (1998), Greve (2003), and Walker and Walker (2000) studied PPPs in the United Kingdom, United States, Europe, and Australia, respectively and were unanimous in concluding that PPP where not the best option if VfM is taken into account.
Also concerning econometric studies related to PPPs, Hammami, Ruhashyankiko, and Yehoue (2006) carried out a first attempt “to analyze the determinants of PPPs in
infrastructure projects using the World Bank’s Private Participation in Infrastructure (PPI) database on projects for developing countries during 1990-2003”.
Presently, the focus of investigation related to PPP has been changing. In fact, a new purpose is to understand the reasons why governments choose PPPs to investment in public infrastructures. “In other words, our renewed agenda items should tackle why
governments choose to introduce PPP despite the fact that projects can be financed through traditional methods” Greve and Hodge (2008). In 1996 Terry said that “Private financing promised a way to provide infrastructure without increasing the public sector borrowing ratio.” Hodge (2002) calls the attention to the fact that the duration of a PPP
can cover more than one parliamentary term and Flinders (2005) argues that
”Governments continue to display such an apparently blind commitment to PPPs.”.
More recently Greve and Hodge (2008) up dated the study carried by Broadbent and Laughlin (1999). In their opinion the most relevant questions related to PPPs are:
1. What is the merit/worth of PPPs?
2. In what circumstances do PPPs provide an effective and efficient tool for governments in terms of simply VfM [value for money] and innovation?
3. In what circumstances do PPPs provide governments with a successful governance tool to overcome traditional governance failures?
4. How can PPPs be best regulated in the public interest in the future?
5. What role to date have Auditors General undertaken in PPP evaluation, and how might we meta-summarize their assessment to date?
6. Why and how are PPPs promoted in some jurisdictions and not in others? 7. What is the nature and consequence of a global “PPP industry”?
8. What is the place of PPPs in development activities?
12
This paper analyzes the investment in PPP in a macroeconomic perspective since it studies the aggregated effects of investment in PPP in other macroeconomic aggregates, such as, public investment, private investment, and GDP. An assessment of crowding-in/crowding-out effects of investment in PPPs is carried out and macroeconomic rates of return on investment in PPP, public investment, and private investment were calculated and aimed at quantifying the impact of each of these components of investment in GDP.
In fact, since Aschauer’s work (1989a, 1989b) there has been interest in analyzing the effects of public investment on aggregate economic activity and also to investigate whether public investment crowds-in/crowds-out private investment.
Voss (2002) and Mittnik and Neaumann (2001) estimated the effects of public investment on GDP and the crowding-in/crowding-out effects using a VAR approach. Voss (2002) estimated a VAR model with GDP, public investment, private investment, the real interest rate, and deflators of private and public investment for the US and Canada for the period of 1947-1997 and concluded that public investment crowds-out private investment. Mittnik and Neaumann (2001) used a VAR model with GDP, private investment, public investment, and public consumption for six industrialized economies. They concluded that public investment tends to exert positive effects on GDP, and that there is no evidence of crowding-out effects.
Pereira and Andraz (2005) used data for Portugal between 1976 and 1998 using a VAR-model considering private-sector output, employment, investment, and public investment. Empirical results at the aggregate level indicate that public investment positively affects private investment, employment, and output.
More recently, Afonso and St. Aubyn (2009), using annual data from 14 European Union countries, Canada, Japan, and the United States evaluated the macroeconomic effects of public and private investment with a VAR analysis. The results point to the existence of positive effects of public investment and private investment on output. On the other hand, the crowding-in effect of public investment on private investment varies across countries, while the crowding-in effects of private investment on public investment are more generalized.
13
2.3. Econometric Methodology
2.3.1 VAR specification
A four variable VAR model was estimated. The variables included in the VAR are the logarithmic growth rates of real Public Private Partnerships investment (IPPP), real public investment (IPub), real private investment (IPriv), and real output (Y).The list of concessions used to calculate the PPP investment can be seen in Table 2.8 of the Appendix. Public investment was calculated by the difference between the Gross Fixed Capital Formation series (GFCF) from Public Administration and the investment from reclassified PPP as belonging to Public Administration. Regarding private investment, it results from the difference between the GFCF made by the private sector and the investment from the non-reclassified PPP.
The VAR model can be presented as:
𝑋𝑋𝑡𝑡 = 𝑐𝑐 + ∑𝑝𝑝𝑖𝑖=1𝐴𝐴𝑖𝑖𝑋𝑋𝑡𝑡−1+ 𝜀𝜀𝑡𝑡 (1)
where 𝑋𝑋𝑡𝑡 denotes the (4x1) vector of four endogenous variables given by 𝑋𝑋𝑡𝑡 = [∆𝑙𝑙𝑙𝑙𝑙𝑙𝐼𝐼𝐼𝐼𝐼𝐼𝐼𝐼𝑡𝑡 ∆𝑙𝑙𝑙𝑙𝑙𝑙𝐼𝐼𝐼𝐼𝐼𝐼𝐼𝐼𝑡𝑡 ∆𝑙𝑙𝑙𝑙𝑙𝑙𝐼𝐼𝐼𝐼𝐼𝐼𝐼𝐼𝐼𝐼𝑡𝑡 ∆𝑙𝑙𝑙𝑙𝑙𝑙𝑌𝑌𝑡𝑡 ], c is a (4x1) vector of intercept terms, A
is the matrix of autoregressive coefficients of order (4x4), and 𝜀𝜀𝑡𝑡 =
�𝜀𝜀𝑡𝑡𝐼𝐼𝑝𝑝𝑝𝑝𝑝𝑝 𝜀𝜀𝑡𝑡𝐼𝐼𝑝𝑝𝐼𝐼𝐼𝐼 𝜀𝜀𝑡𝑡𝐼𝐼𝑝𝑝𝐼𝐼𝑖𝑖𝐼𝐼 𝜀𝜀𝑡𝑡𝑌𝑌� is a vector of random disturbances that contains the reduced
form OLS residuals.
It is possible to identify orthogonal shocks, 𝜂𝜂, for each variable in (1), by imposing a set of restrictions, and to compute these orthogonal innovations via the random disturbances:
𝜂𝜂𝑡𝑡 = 𝐵𝐵𝜀𝜀𝑡𝑡 (2)
The estimation of (1) allows the determination of 𝐶𝐶𝑙𝑙𝐼𝐼(𝜀𝜀). Therefore, with orthogonal restrictions and by means of an adequate normalization, we have 𝐶𝐶𝑙𝑙𝐼𝐼(𝜂𝜂) = 𝐼𝐼, where 𝐼𝐼 = (4𝑋𝑋4) identity matrix , and we can write:
𝐶𝐶𝑙𝑙𝐼𝐼(𝜂𝜂𝑡𝑡) = 𝐶𝐶𝑙𝑙𝐼𝐼(𝐵𝐵𝜀𝜀𝑡𝑡) = 𝐵𝐵𝐶𝐶𝑙𝑙𝐼𝐼(𝜀𝜀𝑡𝑡)𝐵𝐵′ (3)
14
B has 16 parameters that need to be identified, since B is a square (𝑛𝑛𝑋𝑋𝑛𝑛) matrix, which in this case has dimension four. From (4) only 12 parameters can be determined, by imposing orthogonality, essentially from the four variances and from the eight covariances. Four more restrictions are needed for the complete identification of the model. The use of a Choleski decomposition of the matrix of covariances of the residuals, which requires all elements above the principal diagonal to be zero, provides the necessary additional six restrictions, and the system is then exactly identified.
A lower triangular structure to 𝐵𝐵−1can be imposed,
𝐵𝐵−1= 𝐷𝐷 = � 𝑑𝑑11 0 0 0 𝑑𝑑21 𝑑𝑑22 0 0 𝑑𝑑31 𝑑𝑑32 𝑑𝑑33 0 𝑑𝑑41 𝑑𝑑42 𝑑𝑑43 𝑑𝑑44 � (5)
which makes it possible to write the residuals 𝜀𝜀𝑡𝑡 as a function of the orthogonal shocks in each of the variables:
𝜀𝜀𝑡𝑡 = 𝐷𝐷𝜂𝜂𝑡𝑡
The variables in the VAR were ordered from what is theoretically considered the most exogenous variable to the least exogenous one, with PPP investment ordered first, followed by public investment, private investment, and output. Being so, a shock in PPP investment may have an instantaneous effect on all of the other variables. However, PPP investment does not respond contemporaneously to structural disturbances in the other variables. A shock in public investment, the second variable, does not have an instantaneous impact on PPP investment, only on private investment and output. In fact, this ordering implies that private investment responds to PPP and public investment in a contemporaneous way, but not to shocks to the other variables. Indeed, one can recall that governments typically announce their spending and investment plans in advance. Therefore, economic agents can incorporate this information in their decisions.
15
2.3.2 Macroeconomic rates of return
Six different rates of return were computed based on the results from impulse response functions:
• the partial rate of return of investment in PPP; • the partial rate of return of public investment; • the partial rate of return of private investment;
• the rate of return of total investment deriving from an impulse to PPP investment; • the rate of return of total investment deriving from an impulse to public
investment;
• the rate of return of total investment deriving from an impulse to private investment;
The partial rate of return of investment in PPP is computed as in Pereira (2000). Following an orthogonal impulse to investment in PPP the long-run accumulated elasticity of Y with respect to investment in PPP, IPPP, was computed deriving from the accumulated impulse response functions of the VAR:
𝜀𝜀𝐼𝐼𝐼𝐼𝐼𝐼𝐼𝐼 =∆𝑙𝑙𝑙𝑙𝑙𝑙 𝐼𝐼𝐼𝐼𝐼𝐼𝐼𝐼∆𝑙𝑙𝑙𝑙𝑙𝑙𝑌𝑌
This long-run elasticity is the ratio between the accumulated change in the growth rate of output and the accumulated change in the growth rate of PPP investment.
It is known that: ∆𝑌𝑌 ∆𝐼𝐼𝐼𝐼𝐼𝐼𝐼𝐼 = 𝜀𝜀𝐼𝐼𝐼𝐼𝐼𝐼𝐼𝐼 𝑌𝑌� 𝐼𝐼𝐼𝐼𝐼𝐼𝐼𝐼 �������
Being so, the partial rate of return of investment in PPP is obtained by solving:
(1 + 𝐼𝐼)20= ∆𝑌𝑌
∆𝐼𝐼𝐼𝐼𝐼𝐼𝐼𝐼
Note that it is not possible to decompose the variation of the product that is due separately to a change in investment in PPP and the consequent change in public
16
investment and/or private investment. Thus, the isolated reading of the partial rate of return can bias the analysis of the total impact in the product of a variation of investment in PPP. We used 20 years to compute both rates of return, as we assumed an average life of 20 years for a capital good.
The partial rates of return of public and private investment were computed using the same technology mentioned above.
Following Pina and St. Aubyn (2006) the rate of return of total investment deriving from an impulse to PPP investment was obtained as a solution for:
(1 + 𝐼𝐼)20= ∆𝑌𝑌 ∆𝐼𝐼𝐼𝐼𝐼𝐼𝐼𝐼 + ∆𝐼𝐼𝐼𝐼𝐼𝐼𝐼𝐼 + ∆𝐼𝐼𝐼𝐼𝐼𝐼𝐼𝐼𝐼𝐼 = = 1 �𝜀𝜀𝐼𝐼𝐼𝐼𝐼𝐼𝐼𝐼𝐼𝐼𝐼𝐼𝐼𝐼𝐼𝐼�𝑌𝑌 −1 + �𝜀𝜀𝐼𝐼𝐼𝐼𝐼𝐼𝐼𝐼𝐼𝐼𝐼𝐼𝐼𝐼𝐼𝐼�𝑌𝑌 −1 + �𝜀𝜀𝐼𝐼𝐼𝐼𝐼𝐼𝑖𝑖𝐼𝐼𝐼𝐼𝐼𝐼𝐼𝐼𝐼𝐼𝐼𝐼�𝑌𝑌 −1
That is, following a shock in investment in PPP, both the direct impact of this shock and the indirect impact through changes taking place in public and private investment that result from this shock in PPP investment, are taken into account.
The rate of return of total investment deriving from an impulse to public and private and investment was computed using the same technology mentioned above.
2.3.3 Crowding-in and crowding-out effects
The marginal effects of PPP investment on public investment and private investment were derived, respectively, from:
∆𝐼𝐼𝐼𝐼𝐼𝐼𝐼𝐼 ∆𝐼𝐼𝐼𝐼𝐼𝐼𝐼𝐼 = 𝜀𝜀𝐼𝐼𝐼𝐼𝐼𝐼𝐼𝐼 𝜀𝜀𝐼𝐼𝑝𝑝𝐼𝐼𝐼𝐼 𝐼𝐼𝐼𝐼𝐼𝐼𝐼𝐼 ������ 𝐼𝐼𝐼𝐼𝐼𝐼𝐼𝐼 ������� and ∆𝐼𝐼𝐼𝐼𝐼𝐼𝐼𝐼𝐼𝐼 ∆𝐼𝐼𝐼𝐼𝐼𝐼𝐼𝐼 = 𝜀𝜀𝐼𝐼𝐼𝐼𝐼𝐼𝐼𝐼 𝜀𝜀𝐼𝐼𝑝𝑝𝐼𝐼𝑖𝑖𝐼𝐼 𝐼𝐼𝐼𝐼𝐼𝐼𝐼𝐼𝐼𝐼 ������� 𝐼𝐼𝐼𝐼𝐼𝐼𝐼𝐼 �������
17 In this way it is possible to check for the existence of crowding-in or crowding-out effects of PPP investment on public and private investment. These same effects were computed, following the same technology, for changes on public and private investment.
2.4. Empirical Results
2.4.1 Data
Annual data from 1998 to 2013 were used for the Portuguese economy. All variables are presented at constant prices. GDP was transformed into real values using the price deflator of GDP. The price deflator of the general government gross fixed capital formation was used to transform both the investment in PPP and the public investment into real values, and the price deflator of the gross fixed capital formation of the private sector to transform private investment. The data sources for the investment in PPP are UTAP, Brisa, and INE.
2.4.2 VAR estimation
All variables used in the VAR are in logarithmic growth rates and in first differences of the original values. The unit root analysis showed that these first differenced variables are stationary, I(0) time series. Table 2.1 summarizes the results for the unit root test statistics.
Table 2.1. Unit root tests, variables in first differences: Augmented Dickey-Fuller
Augmented Dickey-Fuller
t-Statistic Critical value
dlog (Y) -5.5407 -2.7406
dlog(IPPP) -2.9548 -2.7406
dlog(Ipub) -2.8271 -2.7406
dlog(Ipriv) -4.8176 -2.7406
Note: critical values are for 1% level. No tendency or interception was adopted.
The Akaike and the Schwartz information criteria were used to select the VAR order used in the estimation. Taking into account the length of the data used in the VAR and those tests, a parsimonious model with only one lag was chosen in order to avoid the use of too many degrees of freedom. The null hypothesis of normality of the VAR residuals was not rejected. The diagnostic tests for normality are presented in Table 2.2. For a p-value
18
of 5% the null hypothesis of no serial correlation of the residuals cannot be rejected as can be seen in Table 2.2.
2.4.3 Rates of return
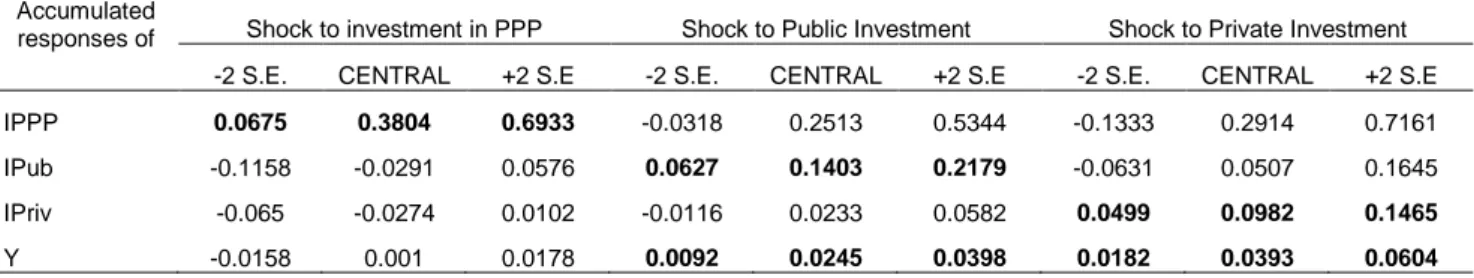
The information on accumulated responses of all VAR variables to a shock in investment in PPP and in public and private investment is presented in Table 2.3. A 95 percent confidence band around estimates is also included and the figures in bold represent the cases in which those confidence bands include positive or negative values only. The conclusion is that impulses in investment in PPP have no statistically significant effects on the other variables at 95 percent level. On the other hand, impulses to private and public investment have a positive and significant impact on output.
Table 2.2 Residual normality tests
Component Skewness Chi-sq df Prob. 1 1.222453 3.486915 1 0.0619 2 -0.072623 0.012306 1 0.9117 3 1.074501 2.693956 1 0.1007 4 -0.028190 0.001854 1 0.9657 Joint 6.195031 4 0.1850 Component Kurtosis Chi-sq df Prob.
1 4.036431 0.626610 1 0.4286 2 2.229281 0.346505 1 0.5561 3 4.694197 1.674344 1 0.1957 4 2.001411 0.581688 1 0.4457 Joint 3.229147 4 0.5202 Component Jarque-Bera Df Prob.
1 4.113525 2 0.1279 2 0.358811 2 0.8358 3 4.368300 2 0.1126 4 0.583542 2 0.7469 Joint 9.424178 8 0.3078
19
Table 2.3. Accumulated responses to shocks in PPP and public and private investment
Accumulated
responses of Shock to investment in PPP Shock to Public Investment Shock to Private Investment
-2 S.E. CENTRAL +2 S.E -2 S.E. CENTRAL +2 S.E -2 S.E. CENTRAL +2 S.E
IPPP 0.0675 0.3804 0.6933 -0.0318 0.2513 0.5344 -0.1333 0.2914 0.7161
IPub -0.1158 -0.0291 0.0576 0.0627 0.1403 0.2179 -0.0631 0.0507 0.1645
IPriv -0.065 -0.0274 0.0102 -0.0116 0.0233 0.0582 0.0499 0.0982 0.1465
Y -0.0158 0.001 0.0178 0.0092 0.0245 0.0398 0.0182 0.0393 0.0604
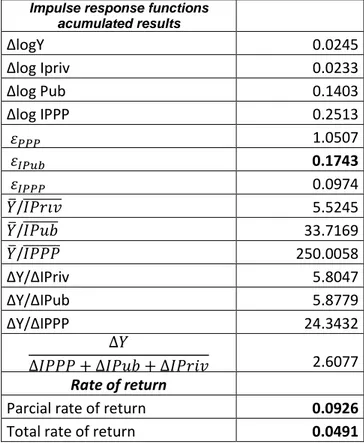
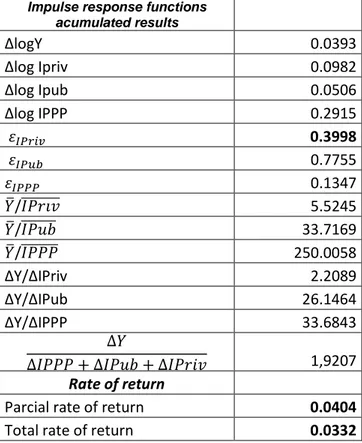
The results for the output elasticity and the partial and total rates of returns of an impulse in investment in PPP, public investment, and private investment, for the period in which data are available, are presented in Tables 2.9, 2.10, and 2.11, respectively, in the Appendix. These three types of investment present a positive output elasticity, with the output elasticity of private investment (0.3998) being higher than the output elasticity of public investment (0.1743) and investment in PPP (0.0026).
Both public and private investments present a positive partial and total rate of return, with the total rate of return of public investment (0.0491) greater than the total rate of return of private investment (0.0332). In the case of the investment in PPP, this rate of return cannot be calculated since its partial rate of return is negative.
2.4.4 Crowding-in and crowding-out effects
The results for the crowding-in and crowding-out effects for the investment in PPP, public investment, and private investment are presented in Tables 2.4, 2.5, and 2.6 respectively. εIPriv
Table 2.4. Crowding-in or crowding-out effects resulting from an impulse in the investment in PPP εIPriv -0.0365 εIPub -0.0344 εIPPP 0.0026 𝐼𝐼𝐼𝐼𝐼𝐼𝐼𝐼𝐼𝐼 ������� 29298.4375 𝐼𝐼𝐼𝐼𝐼𝐼𝐼𝐼 ������� 5217.2500 𝐼𝐼𝐼𝐼𝐼𝐼𝐼𝐼 ������� 997.9375
Crowding-in or crowding-out effects resulting from an
impulse in the investment in PPP
ΔIPriv/ΔIPPP -2.1166
20
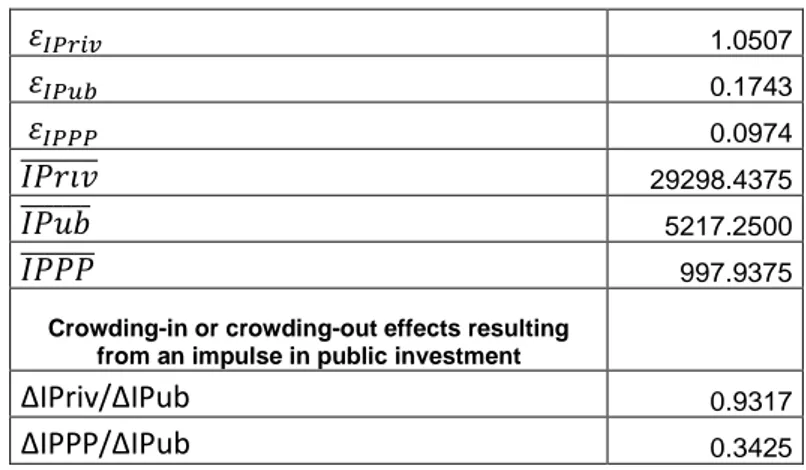
Investment in PPP presents a crowding-out effect in both public and private investment, with the magnitude of the crowding-out effect on private investment (-2.1166) greater than in public investment (-0.4005). On the other hand, public investment crowds-in in both private investment and investment in PPP, showing a greater impact in private investment (0.9317) than in investment in PPP (0.3425). Finally, private investment also shows a crowding-in effect in both investment in PPP and public investment, with the impact in the investment in PPP (0.1011) being slightly greater than in public investment (0.0918).
Table 2.5. Crowding-in or crowding-out effects resulting from an impulse in public investment
𝜀𝜀𝐼𝐼𝐼𝐼𝐼𝐼𝑖𝑖𝐼𝐼 1.0507 𝜀𝜀𝐼𝐼𝐼𝐼𝐼𝐼𝐼𝐼 0.1743 𝜀𝜀𝐼𝐼𝐼𝐼𝐼𝐼𝐼𝐼 0.0974 𝐼𝐼𝐼𝐼𝐼𝐼𝐼𝐼𝐼𝐼 ������� 29298.4375 𝐼𝐼𝐼𝐼𝐼𝐼𝐼𝐼 ������� 5217.2500 𝐼𝐼𝐼𝐼𝐼𝐼𝐼𝐼 ������� 997.9375
Crowding-in or crowding-out effects resulting
from an impulse in public investment
ΔIPriv/ΔIPub 0.9317
ΔIPPP/ΔIPub 0.3425
Table 2.6. Crowding-in or crowding-out effects resulting from an impulse in private investment
𝜀𝜀𝐼𝐼𝐼𝐼𝐼𝐼𝑖𝑖𝐼𝐼 0.3998 𝜀𝜀𝐼𝐼𝐼𝐼𝐼𝐼𝐼𝐼 0.7755 𝜀𝜀𝐼𝐼𝐼𝐼𝐼𝐼𝐼𝐼 0.1347 𝐼𝐼𝐼𝐼𝐼𝐼𝐼𝐼𝐼𝐼 ������� 29298.4375 𝐼𝐼𝐼𝐼𝐼𝐼𝐼𝐼 ������� 5217.2500 𝐼𝐼𝐼𝐼𝐼𝐼𝐼𝐼 ������� 997.9375
Crowding-in or crowding-out effects resulting from an impulse in private investment
ΔIPPP/ΔIPriv 0.1011
21
2.5. Conclusions
Investment in PPP leads to a crowding-out effect in both private and public investment and has a negative impact on GDP. In fact, the partial rate of return of an investment in PPP is negative and the total rate of return associated with investment in PPP cannot be calculated since the accumulated gross growth rate in 20 years is negative.
Public investment presents a crowding-in effect in private investment and in investment in PPP. In fact, in the presence of a positive shock in public investment, the impulse response functions show a positive initial impact in both investment in PPP and GDP. The output elasticity of public investment is positive and statistically significant. The partial rate of return of public investment is greater than its total rate of return due to the fact that in the presence of a shock in public investment the response from the private investment and investment in PPP leads to an increase in output.
Finally, private investment crowds-in in both investment in PPP and in public investment. The output elasticity of private investment is positive and statistically significant. The partial rate of return of private investment is higher than its total rate of return taking into account that the response of both public investment and investment in PPP to a shock in public investment is positive.
The results that point to the existence of crowding-out in private and public investment as a consequence of investment in PPP, together with a negative partial rate of return of PPPs, are evidence that investment in PPP in Portugal, which involved almost exclusively the construction and operation of road infrastructures, is not the most efficient method of financing this kind of investment and/or have facilitated the expansion of road infrastructures beyond the social optimum. In fact, the investment through PPPs does not appear to be the kind of investment leading to the higher productivity that the Portuguese economy needs for a sustained increase in its export capacity and to allow for the correction of the accumulated external imbalances. Empirical results also support the belief that this kind of investment undermined the capacity of private agents and the public sector to carry out their investment activities.
These conclusions are obviously conditioned by the information used, to the concessions analyzed, and to the size of the sample used, the time period, and frequency. In fact, to estimate this VAR model, only 16 annual observations (1998-2013) are available. Using one constant, four variables, and one lag we estimate 5 parameters with only 14 observations. This equates to fewer than 3 observations per parameter. This number of observations is relatively small for drawing conclusions from the model with a high
22
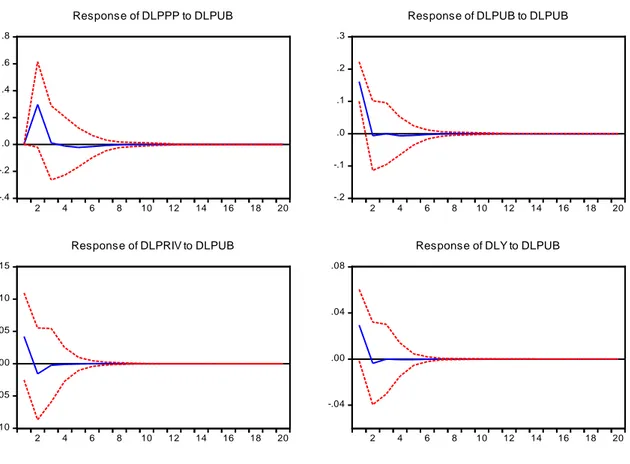
degree of robustness. This small number of observations is also reflected in the impulse response functions shown in Figures 2.1, 2.2, and 2.3. In many cases the impulse response functions are statistically not different from zero.
Figure 2.1. Responses to shocks in PPP investment
-.4 -.2 .0 .2 .4 .6 .8 2 4 6 8 10 12 14 16 18 20 Response of DLPPP to DLPPP -.16 -.12 -.08 -.04 .00 .04 .08 .12 .16 2 4 6 8 10 12 14 16 18 20 Response of DLPUB to DLPPP -.12 -.08 -.04 .00 .04 .08 2 4 6 8 10 12 14 16 18 20 Response of DLPRIV to DLPPP -.06 -.04 -.02 .00 .02 .04 .06 2 4 6 8 10 12 14 16 18 20 Response of DLY to DLPPP
23
Figure 2.2. Responses to shocks in public investment
-.4 -.2 .0 .2 .4 .6 .8 2 4 6 8 10 12 14 16 18 20 Response of DLPPP to DLPUB -.2 -.1 .0 .1 .2 .3 2 4 6 8 10 12 14 16 18 20
Response of DLPUB to DLPUB
-.10 -.05 .00 .05 .10 .15 2 4 6 8 10 12 14 16 18 20
Response of DLPRIV to DLPUB
-.04 .00 .04 .08
2 4 6 8 10 12 14 16 18 20
Response of DLY to DLPUB
Response to Cholesky One S.D. Innovations ± 2 S.E.
Figure 2.3. Responses to shocks in private investment
-.4 -.2 .0 .2 .4 .6 2 4 6 8 10 12 14 16 18 20 Response of DLPPP to DLPRIV -.2 -.1 .0 .1 .2 2 4 6 8 10 12 14 16 18 20
Response of DLPUB to DLPRIV
-.2 -.1 .0 .1 .2 2 4 6 8 10 12 14 16 18 20
Response of DLPRIV to DLPRIV
-.08 -.04 .00 .04 .08 2 4 6 8 10 12 14 16 18 20
Response of DLY to DLPRIV
24
With respect to the VAR model, other specifications were tested that included variables such as the total amount of taxes at constant prices, the long-term interest rate, and the level of employment, revealing no impact on the final results.
2.6. Appendix
Table 2.7. Total amount of investment in PPP between 1990-2009 as a percentage of the 2009 GDP of each country PT 10.55% UK 8.38% HU 6.39% EL 6.05% CY 4.52% ES 2.77% IE 2.5% SK 2.02% PL 1.39% BE 0.97% NL 0.8% BG 0.73% FR 0.71% IT 0.55% CZ 0.54% AT 0.46% DE 0.44% FI 0.29% SE 0.17% DK 0% LV 0% MA 0% RO 0% SI 0%
25
Table 2.8. List of concessions used to calculate the PPP investment
Concession Road sector Concessão Lusoponte Concessão Norte Concessão Oeste Concessão Brisa Concessão Litoral Centro Concessão Beira Interior Concessão Costa de Prata Concessão Algarve Concessão Interior Norte Concessão Beiras Litoral e Alta Concessão Norte Litoral Concessão Grande Porto Concessão Douro Litoral Concessão Grande Lisboa Concessão Túnel do Marão Subconcessão Transmontana Subconcessão Douro Interior Subconcessão Baixo Alentejo Subconcessão Baixo Tejo Subconcessão Litoral Oeste Subconcessão Algarve Litoral Subconcessão Pinhal Interior
Healthcare sector
H. Braga - Gestão do Estabelecimento H. Braga - Gestão do Edifício
H. Cascais - Gestão do Estabelecimento H. Cascais - Gestão do Edifício H. Loures - Gestão do Estabelecimento H. Loures - Gestão do Edifício
H. V Franca - Gestão do Estabelecimento H. V Franca - Gestão do Edifício
Rail sector
Metro Sul Tejo Fertagus
Defense sector
26
Table 2.9. Partial and total rates of returns deriving from an impulse in investment in PPP
Table 2.10. Partial and total rates of returns deriving from an impulse in public investment
Impulse response functions
acumulated results ΔlogY 0.0245 Δlog Ipriv 0.0233 Δlog Pub 0.1403 Δlog IPPP 0.2513 𝜀𝜀𝐼𝐼𝐼𝐼𝐼𝐼 1.0507 𝜀𝜀𝐼𝐼𝐼𝐼𝐼𝐼𝐼𝐼 0.1743 𝜀𝜀𝐼𝐼𝐼𝐼𝐼𝐼𝐼𝐼 0.0974 𝑌𝑌�/𝐼𝐼𝐼𝐼𝐼𝐼𝐼𝐼𝐼𝐼������� 5.5245 𝑌𝑌�/𝐼𝐼𝐼𝐼𝐼𝐼𝐼𝐼������� 33.7169 𝑌𝑌�/𝐼𝐼𝐼𝐼𝐼𝐼𝐼𝐼������� 250.0058 ΔY/ΔIPriv 5.8047 ΔY/ΔIPub 5.8779 ΔY/ΔIPPP 24.3432 ∆𝑌𝑌 ∆𝐼𝐼𝐼𝐼𝐼𝐼𝐼𝐼 + ∆𝐼𝐼𝐼𝐼𝐼𝐼𝐼𝐼 + ∆𝐼𝐼𝐼𝐼𝐼𝐼𝐼𝐼𝐼𝐼 2.6077 Rate of return
Parcial rate of return 0.0926
Total rate of return 0.0491
Impulse response functions
acumulated results ΔlogY 0.0010 Δlog Ipriv -0.0274 ΔlogIPub -0.0291 Δlog IPPP 0.3804 𝜀𝜀𝐼𝐼𝐼𝐼𝐼𝐼𝑖𝑖𝐼𝐼 -0.0365 𝜀𝜀𝐼𝐼𝐼𝐼𝐼𝐼𝐼𝐼 -0.0344 𝜀𝜀𝐼𝐼𝐼𝐼𝐼𝐼𝐼𝐼 0.0026 𝑌𝑌�/𝐼𝐼𝐼𝐼𝐼𝐼𝐼𝐼𝐼𝐼������� 5.5245 𝑌𝑌�/𝐼𝐼𝐼𝐼𝐼𝐼𝐼𝐼������� 33.7169 𝑌𝑌�/𝐼𝐼𝐼𝐼𝐼𝐼𝐼𝐼������� 250.0058 ΔY/ΔIPriv -0.2017 ΔY/ΔIPub -1.1588 ΔY/ΔIPPP 0.6582 ∆𝑌𝑌 ∆𝐼𝐼𝐼𝐼𝐼𝐼𝐼𝐼 + ∆𝐼𝐼𝐼𝐼𝐼𝐼𝐼𝐼 + ∆𝐼𝐼𝐼𝐼𝐼𝐼𝐼𝐼𝐼𝐼 -0.2325 Rate of return
Parcial rate of return -0.0207
27
Table 2.11. Partial and total rates of returns deriving from an impulse in private investment
Impulse response functions
acumulated results ΔlogY 0.0393 Δlog Ipriv 0.0982 Δlog Ipub 0.0506 Δlog IPPP 0.2915 𝜀𝜀𝐼𝐼𝐼𝐼𝐼𝐼𝑖𝑖𝐼𝐼 0.3998 𝜀𝜀𝐼𝐼𝐼𝐼𝐼𝐼𝐼𝐼 0.7755 𝜀𝜀𝐼𝐼𝐼𝐼𝐼𝐼𝐼𝐼 0.1347 𝑌𝑌�/𝐼𝐼𝐼𝐼𝐼𝐼𝐼𝐼𝐼𝐼������� 5.5245 𝑌𝑌�/𝐼𝐼𝐼𝐼𝐼𝐼𝐼𝐼������� 33.7169 𝑌𝑌�/𝐼𝐼𝐼𝐼𝐼𝐼𝐼𝐼������� 250.0058 ΔY/ΔIPriv 2.2089 ΔY/ΔIPub 26.1464 ΔY/ΔIPPP 33.6843 ∆𝑌𝑌 ∆𝐼𝐼𝐼𝐼𝐼𝐼𝐼𝐼 + ∆𝐼𝐼𝐼𝐼𝐼𝐼𝐼𝐼 + ∆𝐼𝐼𝐼𝐼𝐼𝐼𝐼𝐼𝐼𝐼 1,9207 Rate of return
Parcial rate of return 0.0404
Total rate of return 0.0332
Figure 2.4. Countries’ percentage shares of value of projects of European PPPs, 1990-2009 aggregate
Source:Kappeler and Nemoz (2010)
0 10 20 30 40 50 60 UK ES PT EL FR DE IT HU NL PL IE BE AT SK CY CZ FI SE BG DK LV MA RO SI
Countries’ percentage shares of value of projects of European PPPs, 1990-2009 agregate
28
Chapter 3
The Dynamic Impact of Government Spending
and Public Private Investment on Output: Panel
VAR Evidence from 14 OECD Countries
3.1 Introduction
The capacity of public consumption and public investment to influence the economic activity of a country is crucial in an economic environment such as the European Monetary Union (EMU), in which fiscal policy is the only instrument that governments have to offset idiosyncratic shocks. However, there is no consensus about the qualitative effects of fiscal policy. While Keynesian economists predict an increase in private consumption and investment and, consequently, a boost in the economic performance following an innovation on government spending, the neoclassical models suggest that after a positive shock to government consumption there will be a withdrawal of resources from private sector that is expected to reduce private consumption and investment.
A large body of empirical literature has been investigating the impact of public capital on the private sector and on the economy as a whole. However, as pointed out by Perotti (2007), so far the literature has not been able to provide robust stylized facts on the effects of fiscal policy shocks.
Vector autoregression (VAR) shocks to government spending seem to be associated with a rise in output. For instance, using a mixed structural VAR/event approach,