1
Ranking schools: a step toward increased accountability or a mere discriminatory
practice?
Ana Balcão Reis*,
tCarmo Seabra*,
tLuis C. Nunes*,
t*Nova School of Business and Economics,
Universidade Nova de Lisboa,
Campus de Campolide 1099-032 LISBOA
Portugal
Abstract
The purpose of this paper is to contribute to the discussion of the effects of published school rankings based on average scores obtained by students on national exams. We study the effectiveness of this (low-stakes) accountability mechanism; we analyze whether students react to these rankings, by moving in or out of high-schools according to their scores and examine the movements of closing of schools. Our results suggest that families react strongly to published rankings. We also look at the changes in the socio-economic background of students of poorly performing schools in order to evaluate whether the publication of rankings has increased inequality, as feared by many observers. According to our results, published rankings do in fact reinforce stratification by income.
Keywords: school accountability, school rankings JEL: I21, I28, H42
1. Introduction
Over the last decade, many countries and/or states introduced some form of accountability on schools in an attempt to increase their performance. This movement was at least partly generated by the frustration felt by many countries with the results of their heavily financed public education systems. The weaknesses of these results became clearer as the realization of internationally comparable exams, like Pisa and TIMMS was generalized became more widespread.
* Email: [email protected] , [email protected] , [email protected]
t
We would like to thank João Miguel Silva for excellent research assistance. Financial support from Fundação para a Ciência e Tecnologia is gratefully acknowledged.
2 Accountability policies vary considerably, from the so-called low-stakes policies (disclosing information regarding the performance of schools) to high-stakes or consequential systems, whereby the financing conditions of the schools and/or the payments to teachers are made dependent on the outcomes of students. The effectiveness of these accountability systems on the learning conditions of the pupils and also their consequences over equity in society have been a topic of hot debate in the literature. Our purpose is to contribute to this discussion with an empirical analysis of a case study.
In this study we consider the impacts of the public disclosure of school rankings, a low-stakes accountability policy, which may be seen as an important step in the direction of increased accountability of schools, with the goal of improving the performance of schools and students. Nevertheless, it may also have negative consequences in terms of equity if it leads to increased concentration of low-performing students in the worst ranked schools.
We consider the case of Portugal, where every year several newspapers publish rankings of every high school (public and private) based on the average scores obtained by students on national exams. These rankings are based on data furnished by the Ministry of Education, but are the responsibility of the newspapers, which work the raw data. We focus on the rankings of secondary schools published between 2003 and 2010, and study the effect of these rankings in terms of the ability of well classified schools to attract students and of the closing of badly classified ones, and therefore on the evolution of the distribution of school classifications. We distinguish between private and public schools, as we expect that there is more flexibility and freedom of choice in the subset of private schools, allowing for a stronger effect of the rankings on these schools.
The organization of the paper is the following: Section 2 presents a review of the literature. Section 3 briefly describes the data. In Section 4 we check whether students react to these rankings, by moving in or out of high-schools according to their scores. This should help to understand the impact and the vehicle through which the publication of rankings affects schools. In Section 5 school closings are analyzed and we study more thoroughly the impact of the published ranking on the probability that schools close. In Section 6 we deepen the analysis of the consequences of the publication of rankings on social asymmetries by looking at its effect on the concentration of low-income students in low performing schools. Section 7 concludes.
2. Literature Review
Using different data sets and methodological tools, several authors, have shown that accountability policies, even low-stakes ones consisting of the mere disclosure of information concerning students’ grades (such as the one considered in this paper) have significant and positive effects on students’ behavior. Figlio and Lucas, 2004, showed that low-stakes accountability policies have strong effects on parents’ choices and are reflected in changes in housing prices; Figlio and Rouse, 2006, using data from Florida, where a hard-stakes policy was launched, estimated the effects of stigma and threat of vouchers on the performance of schools and concluded that the improvements of poorly performing schools were, in fact, very large; Chakrabarti, 2008, examined the impact of different incentive schemes and showed that
3 the 1999 Florida accountability program unambiguously improved schools’ performance. Hanushek and Raymond, 2004, also reported increased scores for all students, following the introduction of accountability policies in the US, although they found a much weaker impact of low-stakes policies relative to the effects of sequential or high-stakes measures. Using data from Pisa 2003 for more than 180,000 students from 27 OECD countries Schutz et al., 2007 also found a positive relationship between accountability and academic outcomes. Koning and van der Wiel, 2010, which is the only paper we are aware of that also looks at school rankings published by a newspaper in the Netherlands, also concludes that they have a positive impact. In spite of the positive effect of increased accountability reported in the literature, many see the publication of rankings as misleading, stressing that the higher rankings exhibited by private schools derived exclusively from the more favorable background of their students, and not from the better quality of private schools. Moreover, it is feared that the public disclosure of bad outcomes might reinforce the negative performance of those already disadvantaged schools without any sizeable offsetting positive effect on initially “good” schools. The negative impact of the publication of the rankings could be due to cream-skimming of both students and teachers, or to motivational effects as shown, for instance, by Clotfelter et al., 2004. Nevertheless, this negative consequence of accountability on disadvantaged students is not unambiguously reported in the literature. For instance, using data from Florida, Chiang, 2009, concluded that the “worst” performing schools, when subject to a high-stakes accountability policy, did in fact improve their educational output, and that these improvements persisted in the medium-run, particularly for mathematics.
The impact of schools’ classification on equity has been addressed in different perspectives in the literature. Analyzing the impact of school grade assignment on the housing market in Florida, Figlio and Lucas, 2004, concluded that provision of information about schools’ quality had strong negative distributional consequences, at least in the short run. Clotfelter et al., 2004, using data for North Carolina, studied the potential adverse effects of school accountability systems on the capacity of schools serving disadvantaged students to attract and or retain the best teachers, thereby harming already “bad” schools, and concluded that those schools in fact had an increased turnover of teachers following the introduction of accountability policies. The study by Schutz et al., 2007, mentioned above, analyzed the impact of different systems of students’ evaluation and concluded that in spite of having a strong positive effect for all students, external exit exams tend to increase inequality by benefiting less students with low socio-economic status.
Finally, there is a vast body of empirical literature dealing with the different possible ways in which accountability systems can be “cheated” or even lead to perverse educational results. Cullen and Reback, 2006, using panel-data for Texas in the 1990s and Figlio and Getzler, 2002, using data for Florida, concluded that schools manipulated the composition of students taking the exams in order to maximize ratings; Jacob, 2005, using panel data for Chicago students, showed that schools and teachers reacted strategically to accountability policy, investing too much on test-specific skills (easily observable) at the cost of other school outputs, not so easily measurable and cheated the system in several ways; Reback, 2009, using student-level panel-data from Texas, found that the phenomenon of “teaching to the grade” holds true, and leads
4 schools and teachers to concentrate their efforts on marginal students, at the cost of good and bad students. Using data for Chicago, Neal and Schanzenbach, 2010, were led to a similar conclusion. Therefore, it could be argued that any reported beneficial effects of accountability were merely the result of schools gaming or cheating the system, with no real content as far as effective quality evaluation is concerned.
The position emphasizing the possible negative effects of the publication of school rankings is shared by politicians in different countries, and calls for the prohibition of public disclosure of school rankings that is seen in Norway and some other European countries (see Elstad, 2009).
3. The Data
Our dataset covers the whole population of 12th grade national exams in Portugal. These exams are required for graduation from secondary school. Also, access to University is determined to a large extent by the scores obtained by the students on these exams.1 The exam scores are published online by the National Exams Committee (JNE, Júri Nacional de
Exames), an agency of the Ministry of Education, and may be freely downloaded.2 These scores are published per student (without identifiers) and per exam for all the exams applied since 2002. The choice of exams to include in our analysis follows the criteria adopted by the newspaper Público on its publication of the rankings, given that our purpose is to analyze the impact of published rankings. We use the scores per student and per school, from 2003 to 2010. Information concerning the size of the school, the number of schools in each municipality, each school's geographic location, and its public or private status was also extracted from this same data set.3
Throughout this period 615 schools were observed, 117 private and 498 public. Out of these, 50 were closed, and a number of others do not have results in at least one year. We label
permanent schools the subset of 554 schools that were ranked in every year throughout the
period 2003-2010. Out of these, 89 are private, and the remaining 465 are public.
4. Analysis of the impact of published rankings on students’ decisions
In order to evaluate whether published rankings4 affect students’ decisions about the school that they choose to enroll in, we regressed the percent change in the number of exams performed in each high school between 2003 and 2010 on the rank of the school. This rank was
1
As the number of places in Universities is limited, students are ordered according to an overall score in which the weight of the exams’ score is typically 50%.
2
http://www.dgidc.min-edu.pt/jurinacionalexames/
3
In fact, the public disclosure of these data has been in itself a contentious issue. The first ranking was published in 2001 by the leading newspaper Público, but in 2002 the Ministry of Education decided to publish its own ranking, taking into account some socio-economic characteristics of the school region. This ranking was strongly criticized and from 2003 on the Ministry provides the raw data to the media, who publish the rankings. The disclosure of these data followed a court decision on a law suit by the media.
4
Hereinafter we speak about rankings and published rankings indistinguishably, because our data do not allow us to test the specific impact of each of these factors.
5 measured as an average across the years for which each school has scores, reflecting the cumulative nature of the reputation building process.
Most Portuguese students decide on which school to enroll in for secondary level exams at the beginning of secondary education (10th grade) but some students change school in their last year of secondary education (12th grade). Thus, we calculated the average rank taking into account the schools’ rankings available at these two moments in time: for students sitting for exams in 2010 this means considering rankings from 2003 to 2007 or alternatively, from 2003 to 2009. Considering the average ranking also decreases the bias caused by mean-reversion problems. 5 We controlled for the private versus public nature of the school, and in order to test whether the impact of published rankings is weaker for public schools, we also considered the cross-effect between the rank and the public character of the school. We also controlled for the school size (measured by the number of exams in 2003) and for the degree of competition among schools in each region. As an indicator of the degree of competition we considered two alternative measures: i) the number of schools in the same municipality in 2003, and ii) the Herfindahl-Hirschman Index of concentration also computed for 2003.
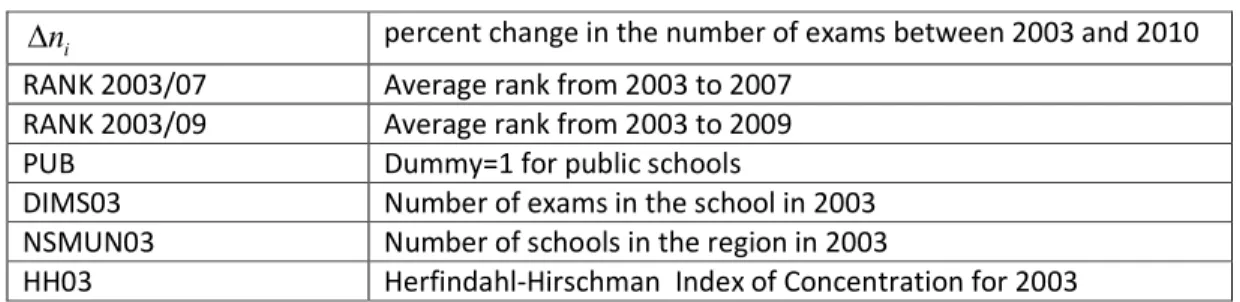
To test if the impact of published rankings is greater for schools subject to stronger competition, we also considered the cross-effect between the rank and the competition measure. We included a dummy for each region in all the regressions to control for differences in the demographic evolution across regions and other regional characteristics. Table 1 lists these variables.
Table 1: Definition of Variables
i
n
∆
percent change in the number of exams between 2003 and 2010RANK 2003/07 Average rank from 2003 to 2007 RANK 2003/09 Average rank from 2003 to 2009
PUB Dummy=1 for public schools
DIMS03 Number of exams in the school in 2003 NSMUN03 Number of schools in the region in 2003
HH03 Herfindahl-Hirschman Index of Concentration for 2003
Our benchmark specification is the following:
The function was estimated by ordinary least squares and the results are shown in Tables 2 and 3. In the regressions where effects were considered the measure of the rank in the cross-effect was the one considered in that regression.
Table 2 shows the results for the regressions that considered all the schools in the sample and Table 3 shows the results considering only the subset of permanent schools. We anticipate that
5
The problem of mean reversion is the greater the smaller the school is. This issue is analyzed in detail in Chay, 2005.
i i i
i
i
Rank
Pub
Pub
Rank
Dimension
NSMun
NSMun
Rank
n
=
α
+
β
+
γ
+
δ
+
φ
+
ϕ
+
η
+
ε
6 the effects of the ranking should be greater in the first set of equations than in the second set, as in the second case we are eliminating from the sample those schools where the decrease in the number of exams was so large that at some point there were no exams: the school closed. Our main result is that the direct impact of the ranking on the number of exams has the expected negative sign and is highly significant.6 An increase in the rank of the school (corresponding to a deterioration of quality) leads to a decrease in the number of exams carried out in that school. For the subset of permanent schools, the coefficient of the rank is smaller than when the whole sample is considered, but still significant. The fact that the effect of the ranking on the percent variation in the number of exams is weaker when we exclude from the sample those schools that closed suggests that much of the impact is to lead to the closing of badly classified schools. We study this aspect further in the following section. In order to ascertain whether the impact of the ranking depends on the quartile in which the school is classified we have also carried out the regressions including a dummy per quartile of scores.7 These quartiles were defined considering the rankings in the initial year, 2003, for the whole set of schools. The results of these estimations are shown in Table 4. When a dummy per quartile was included we concluded that only within the first quartile the impact of the ranking was not significant. This suggests that families have a type of reservation quality level above which minor changes in the ranking position are considered irrelevant.
The size of the school has a negative impact on the percent variation in the number of exams. The parameters are significant at the 1% level in all regressions. The number of schools available in the region is also statistically significant: when the number of alternatives increases, the percent variation in the number of students is lower. This result is confirmed in the regressions where this variable was replaced by the Herfindahl-Hirschman Index of concentration. This variable exhibits a positive impact on the variation of exams and is statistically different from zero in the equations carried out with the whole set of schools. Finally, the cross-effect between the ranking and the degree of school competition in the region is not significantly different from zero in most cases. We also tested the relative share of each school, instead of the Herfindahl-Hirschman Index, but the results did not improve. The public nature of the schools enters the equation in two different ways, by itself and as an interaction with the rank. In the regressions where only the direct effect is considered, this is always significant and positive, indicating that public schools have larger percent variations in the number of students across the period. When we also consider the cross effect “Public⤬Rank”, to check if the impact of the rank is different for public and private schools, the results show that there is no significant difference on the impact of the ranking between private and public schools. However, when we re-estimated the functions including a dummy per quartile, the difference between private and public became strongly significant for the lower quality schools: the number of students in “bad” public schools react significantly less to the publication of rankings than their private school counterparts, as anticipated. These results are shown in Table 4.
6
The only exception is for the subset of permanent schools in the regressions where the cross-effect with the number of schools in the region is considered, but then this result may derive from this cross-effect not being significant.
7
7
Table 2: Percent Variation in the Number of Exams 2003/2010
All Schools (615) 1 2 3 4 5 6 7 8 9 10 11 12 RANK 2003/07 RANK 2003/09 CONST 55.69 21.73 66.04 31.34 55.74 33.89 55.44 21.97 66.95 32.61 56.18 36.83 t-ratio 4.76 2.45 5.04 2.86 3.87 3.01 4.75 2.44 5.16 3.03 3.91 3.30 RANK -0.12 -0.13 -0.17 -0.16 -0.13 -0.17 -0.13 -0.13 -0.18 -0.17 -0.14 -0.19 -6.75 -6.71 -5.45 -5.30 -3.37 -5.37 -6.76 -6.78 -5.70 -5.57 -3.54 -5.78 PUB 14.04 13.48 -3.77 -2.27 1.34 1.29 16.29 15.64 -4.18 -2.38 1.08 3.22 t-ratio 2.15 2.00 -0.31 -0.19 0.11 0.10 2.48 2.32 -0.34 -0.19 0.09 0.25 PUB*RANK 0.06 0.06 0.04 0.04 0.08 0.07 0.05 0.05 t-ratio 1.74 1.54 1.18 1.15 1.20 1.75 1.41 1.19 DIMS03 -0.06 -0.04 -0.05 -0.04 -0.05 -0.04 -0.06 -0.05 -0.05 -0.04 -0.05 -0.04 t-ratio -4.34 -3.41 -4.04 -3.18 -4.04 -3.14 -4.49 -3.58 -4.13 -3.30 -4.13 -3.26 NSMUN03 -0.92 -0.09 -0.55 -0.92 -0.09 -0.52 t-ratio -4.60 -4.55 -1.88 -4.58 -4.52 -1.77 NSMUN03*RANK 0.00 0.00 t-ratio -1.69 -1.74 HH03 28.95 27.38 9.78 29.88 27.97 -0.65 t-ratio 3.12 2.94 0.49 3.21 2.99 -0.03 HH03*RANK 0.05 0.08 t-ratio 0.99 1.55 District Dummies X X X X X X X X X X X X R2 0.15 0.13 0.15 0.13 0.16 0.14 0.15 0.13 0.15 0.14 0.16 0.14 ADJUSTED R2 0.11 0.10 0.12 0.10 0.12 0.10 0.11 0.10 0.12 0.10 0.12 0.10 Wald Test c(Rank)+c(pub*Rank) -0.10 -0.11 -0.08 -0.13 -0.10 -0.11 -0.08 -0.14 t-ratio -4.70 -4.70 -3.28 -4.10 -4.54 -4.64 -3.24 -4.46
8
Table 3: Percent Variation in the Number of Exams 2003/2010
Permanent Schools (554) 1 2 3 4 5 6 7 8 9 10 11 12 RANK 2003/07 RANK 2003/09 CONST 48.2 32.3 45.9 29.5 38.6 30.7 46.6 31.3 43.9 28.0 35.4 31.1 t-ratio 4.42 4.04 3.78 3.01 2.88 3.05 4.26 3.9 3.62 2.87 2.61 3.1 RANK 2003/07 -0.08 -0.07 -0.06 -0.06 -0.33 -0.07 -0.07 -0.07 -0.06 -0.06 -0.02 -0.07 t-ratio -4.4 -4.3 -2.1 -2.0 -0.8 -2.1 -4.1 -4.0 -1.1 -1.8 -0.6 -2.1 PUB 12.5 13.1 16.5 17.7 20.8 19.4 13.6 14.2 18.2 19.6 23.3 23.9 t-ratio 2.04 2.13 1.52 1.63 1.83 1.71 2.21 2.29 1.66 -0.6 2.03 2.09 PUB*RANK -0.02 -0.02 -0.03 -0.02 -0.02 -0.02 -0.04 -0.04 t-ratio -0.45 -0.51 -0.89 -0.65 -0.51 -0.60 -1.00 -0.96 DIMS03 -0.06 -0.06 -0.06 -0.06 -0.06 -0.06 -0.06 -0.06 -0.06 -0.06 -0.06 -0.06 t-ratio -5.47 -5.04 -5.47 -5.06 -5.47 -5.02 -5.46 -5.06 -5.47 -5.09 -5.48 -5.04 NSMUN03 -0.65 -0.66 -0.29 -0.63 -0.63 -0.20 t-ratio -2.2 -2.2 -0.7 -2.1 -2.1 -0.5 NSMUN03*RANK 0.00 0.00 t-ratio -1.3 -1.4 HH03 11.4 11.9 3.71 11.3 11.9 -8.59 t-ratio 1.42 1.46 0.22 1.40 1.45 -0.5 HH03*RANK 0.03 0.06 t-ratio 0.53 1.28 DISTRICT DUMMIES X X X X X X X X X X X X R2 0.14 0.14 0.14 0.14 0.15 0.14 0.14 0.14 139 139 0.14 0.14 ADJUSTED R2 0.11 0.1 0.1 0.01 0.11 0.1 0.1 0.1 0.1 0.1 0.1 0.1 Wald Test c(Rank)+c(pub*Rank) -0.08 -0.08 -0.07 -0.09 -0.08 -0.08 -0.06 -0.11 t-ratio -4.00 -4.00 -3.05 -3.08 -4.00 -4.00 -2.74 0.03
In order to control for the possible endogeneity of the rankings in the last years, we re-estimated all the equations taking the ranking of 2003 as the exogenous variable. The results did not change, suggesting that endogeneity is not a problem here.
The overall goodness of fit, measured by R2, is relatively low, showing that there are other factors not included in the equations that explain the variation in the number of exams. Those factors surely include socio-economic characteristics of the family and peer effects, variables that are not available at the school level for the time being. Geographic specificities are captured by a dummy for each of the 20 regions considered.
9
Table 4: Percent Variation in the Number of Exams 2003/2010
All schools (615) 1 2 3 4 RANK 2003/07 RANK 2003/09 CONST 44.27 57.77 44.95 62.74 t-ratio 3.55 3.79 3.68 4.23 RANK*Q1 0.012 -67 0.001 -0.123 t-ratio 0.24 -0.65 0.01 -1.25 RANK*Q2 -0.112 -0.193 -0.112 -0.205 t-ratio -3.57 -2.86 -3.67 -3.05 RANK*Q3 -0.094 -0.112 -0.098 -0.139 t-ratio -3.93 -2.2 -4.12 -2.66 RANK*Q4 -0.106 -0.159 -0.112 -0.172 t-ratio -5.41 -5.05 -5.59 -5.43 PUB 14.09 -9.29 15.32 -14.45 t-ratio 2.14 -0.63 2.3 -1 PUB*RANK*Q1 0.125 0.18 t-ratio 1.07 1.64 PUB*RANK*Q2 0.116 0.135 t-ratio 1.54 1.81 PUB*RANK*Q3 0.039 0.069 t-ratio 0.68 1.19 PUB*RANK*Q4 0.083 0.095 t-ratio 2.16 2.47 DIMS03 -0.06 -0.05 -0.06 -0.05 t-ratio -0.433 -3.99 -4.44 -4.06 NSMUN03 -0.85 -0.85 -0.85 -0.86 t-ratio -4.18 -4.17 -4.22 -4.26 REGIONAL DUMMIES X X X X R2 0.162 0.17 0.162 0.172 ADJUSTED R2 0.125 0.128 0.125 0.129 Wald Test c(5)+c(10) -0.077 -0.077 -3.21 -3.21 5. Probability of closing
The differences in the results in terms of the level of significance of the obtained coefficients considering either the whole set of schools or only the permanent ones led us to think that an important part of the effect of published rankings is the closing of badly classified schools. Thus, we now look more closely at the event of closing.
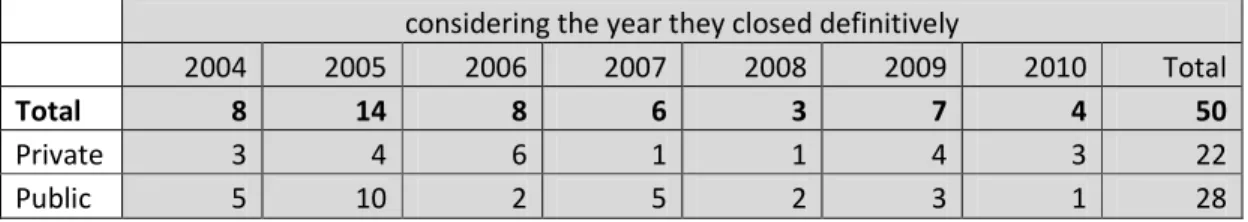
10 In our analysis a closed school is one that presents no students to the national exams. Table 5 shows that there were a considerable number of schools closing in the period under analysis, with the majority of the closings occurring before 2007. Note that 2003 is the beginning of the routine publication of rankings by newspapers.
Table 5: Schools that closed (were opened in 2003 and were closed in 2010)
considering the year they closed definitively
2004 2005 2006 2007 2008 2009 2010 Total
Total 8 14 8 6 3 7 4 50
Private 3 4 6 1 1 4 3 22
Public 5 10 2 5 2 3 1 28
To examine how the probability of closing depends on the published rankings, we divide schools into groups according to the distribution of average scores. Intervals of schools were defined taking into account the whole set of schools that were examined in 2003. We calculate the average score of each school, then the deviation to the mean of the year, and divide by the standard-deviation of the whole distribution. The resulting values are then classified into the six intervals described in Figure1. On the y axis we plot the percentage of schools that closed, per interval.
The analysis of the schools that closed during this period reveals that the probability of closing is asymmetric toward badly performing schools. 8 Also, there are proportionally more private schools that close than public ones. The figure presents for each classification group in 2003 the percentage of schools that were closed in 2010. For instance, of all the schools classified as “very bad” (more than 2 Standard-deviations below the average) in 2003, 45% were closed in 2010, while only 6% of the schools classified as “good” (more than 1 Standard-deviation above the average) in 2003 were closed in 2010.
8
In the following analysis we consider that a school closes if it presented students to national exams in 2003 but not in either 2009 or 2010.
0% 10% 20% 30% 40% 50%
2003-All 2003-Pub 2003-Priv
Fig1: Percentage of schools that closed per classification at 2003
<-2 St. D. "-2 St. D.<X<-1 St. D" "-1 St. D.<X<0." "0<X<1 St. D." "1 St. D.<X<2 St. D." "X>2 St. D."11 We estimated the probability that a school closes as a function of published rankings, considering the same controls as in the previous regressions. Regarding the rank classification for each school, we did not include the publications after 2007, given that our prior analysis shows that the trend toward school closings was not significant after 2008 and most of the schools that closed did so in the initial years of the analysis. Thus, we considered alternatively the rankings published in 2003 and the averages of those published in 2003 and 2004 or between 2003 and 2007. We again introduced a dummy for public schools, as our previous results led us to expect these to exhibit a weaker reaction to published rankings.
The results of the estimation are shown in Table 6. We assumed a Probit function for the probability to close9. The results show that the probability of closing depends on the rank classification and that the impact is positive and significant, as anticipated: a higher rank (lower average scores) increases the probability that a school closes.
The dummy for being a public school enters the equations in two ways, as before, directly and through its interaction with the results of the published ranks. When only the direct effect is considered, it is never significant. The interaction effect is only significant when we consider the 2003-2007 rank. In this case the Wald test on the significance of the two parameters taken together shows that for public schools the impact of the rank on the probability of closing is not significant.
The size of the school has a significant and negative impact on the probability that a school closes, a finding that, once again, confirms our expectations. Finally, the coefficients on the effective alternatives existing in the municipality, measured either by the number of schools or by the Herfindahl-Hirschman Index always have strongly significant values, showing that the probability that a school closes is directly related to the degree of competitiveness at the school supply level.
The overall goodness-of-fit measure10 shows a high value, suggesting not only that these factors matter for the decision to close a school, but also that they are the important ones. On average, moving up in the ranking by one place (meaning poorer results) increases the probability of closing by 0.0307 percent points, an increase in size decreases this probability (an increase of ten students decreases this by 0.0342 percent points), one more school in the region increases the probability to close by 0.2795 percent points and public schools have a probability to be closed that is lower by 5.1117 percent points relative to private ones.
9
Recall that for a Probit function the parameters presented as the results of the estimation cannot be directly interpreted, the relevant results being only the signs and the t-ratio.
10
12
Table 6: Probability of Closing
All Schools (615)
1 2 3 4 5 6 7 8 9
RANK 2003 RANK 2003/04 RANK 2003/07
CONSTANT -1.77 -2.1 -0.74 -1.83 -2.16 -0.77 -1.95 -2.37 -0.94 t-ratio -5.39 -5.03 -2.63 -5.46 -5.21 -2.72 -5.64 -5.37 -3.09 RANK 0.002 0.003 0.002 0.002 0.003 0.002 0.003 0.004 0.003 t-ratio 4.05 3.66 4.13 4.13 3.86 4.19 4.4 4.14 4.55 PUB -0.28 0.36 -0.07 -0.31 0.38 -0.11 -0.36 0.52 -0.17 t-ratio -1.37 0.77 -0.36 -1.51 0.79 -0.5 -1.75 1.01 -0.76 PUB*R -0.002 -0.002 -0.002 t-ratio -1.52 -1.61 -1.9 DIMS03 -0.003 -0.004 -0.004 -0.003 -0.004 -0.004 -0.003 -0.003 -0.004 t-ratio -4.17 -4.32 -4.98 -4.08 -4.25 -4.91 -3.78 -4.02 -4.56 NSMUN03 0.03 0.03 0.03 0.03 0.03 0.03 t-ratio 5.72 5.63 5.8 5.65 5.79 5.63 HH03 -1.6 -1.64 -1.65 t-ratio -5.14 -5.19 -5.25 Mc-Fadden 0.319 0.326 0.315 0.320 0.330 0.317 0.329 0.340 0.329 Wald Test c(Rank(+c(pub*rank) 0.362 0.366 0.521 t-ratio 0.77 0.77 1.01
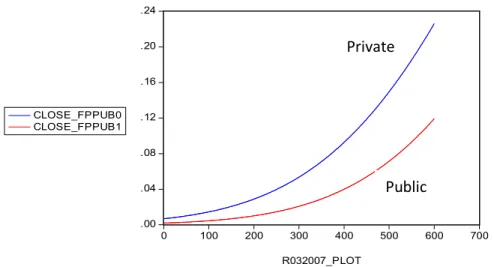
Figure 2 shows the impact of the ranking on the probability to close for private and public schools, obtained from the regression with the averages of the ranks published between 2003 and 2007 (Equation 7). In spite of the fact that there is no interaction variable between the rank and the public versus private nature of the school in this equation, the graph shows a different response of these two types of schools to the ranks. This difference is due to the dependence of these marginal effects on the whole set of values taken by the regressors.
Fig 2: Impact of the Ranking on the Probability to Close a School
.00 .04 .08 .12 .16 .20 .24 0 100 200 300 400 500 600 700 R032007_PLOT CLOSE_FPPUB0 CLOSE_FPPUB1
Private
Public
13 As mentioned above, the results so far indicate that for public schools the impact of the ranking on the probability of closing is not significant. In order to explore this issue in more depth, we re-estimated the equations, including a dummy per quartile on the regressions. The results of this procedure are shown in Table 7. We conclude that the probability that a private school closes depends on published rankings for every quartile. The equivalent reaction for public schools - closing as a consequence of the ranking, which was negligible in the regressions with the whole sample - is now significant for the lowest quartile of the distribution.
Table 7: Probability of closing per quartile
1 2 3 4 5 6
RANK 2003 RANK 2003/04 RANK 2003/07
CONST -2.44 -3.70 -1.84 -2.35 -1.87 -2.42 t-ratio -4.65 -3.20 -4.68 -4.48 -4.86 -4.64 RANK*Q1 0.012 0.023 0.004 0.006 0.003 0.006 t-ratio 2.58 2.27 1.41 1.53 1.40 1.72 RANK*Q2 0.006 0.012 0.003 0.006 0.003 0.005 t-ratio 2.89 2.48 2.20 2.56 2.44 2.65 RANK*Q3 0.003 0.005 0.002 0.002 0.002 0.003 t-ratio 2.31 1.69 1.56 1.3 1.61 1.47 RANK*Q4 0.004 0.006 0.003 0.004 0.002 0.004 t-ratio 4.03 2.91 3.84 3.8 4.11 4.02 PUB -0.33 1.69 -0.31 0.73 -0.34 0.82 t-ratio -1.58 1.32 -1.48 1.17 -1.62 1.31 PUB*RANK*Q1 -0.018 -0.006 -0.006 t-ratio -1.42 -1.05 -1.26 PUB*RANK*Q2 -0.010 -0.005 -0.004 t-ratio -1.76 -1.82 -1.80 PUB*RANK*Q3 -0.003 -0.002 -0.002 t-ratio -1.00 -0.82 -1.60 PUB*RANK*Q4 -0.004 -0.002 -0.003 t-ratio -1.72 -1.84 2.06 DIMS03 -0.003 -0.004 -0.003 -0.003 -0.003 -0.003 t-ratio -3.93 -4.08 -3.93 -4.07 -3.65 -3.86 NSMUN03 0.260 0.260 0.026 0.025 0.025 0.020 t-ratio 5.53 5.48 5.44 5.32 5.38 5.25 Mc-Fadden 0.344 0.362 0.329 0.344 0.338 0.354
6. The publication of rankings and equity
The last issue analyzed is whether the publication of rankings has increased inequality in society, by worsening the relative position of individuals with the lower initial economic status. As stated above, we do not have individual student data, but for 80 public schools located in
14 the region “Centro”, we do have data on the percent of students benefitting from some type of special social benefit both in 2004 and in 2010, per school. 11 This social benefit can include free meals, free meals plus free books and stationary, or even some monthly allowance.
We calculated the change in the percentage of students receiving social aid between these two periods, per school, and regressed this variable on the rank of the school, its public versus private nature, the size of the school, and the degree of competitiveness of its environment, as before. Once again, we used dummies for the different geographic locations (in our sample now restricted to 6).
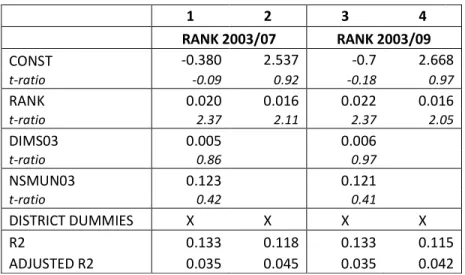
The results from these equations are shown in Table 8. The coefficient of the rank is significant and has the expected sign: relatively poorer students become more concentrated in poorly performing public schools. This outcome confirms some results already obtained with other datasets that suggest that social stratification may increase as a result of (even weak) accountability policies.
Table 8: Variation in The Percentage of Students Receiving Social Aid
Per School 2004/2010 (80 Schools)1 2 3 4 RANK 2003/07 RANK 2003/09 CONST -0.380 2.537 -0.7 2.668 t-ratio -0.09 0.92 -0.18 0.97 RANK 0.020 0.016 0.022 0.016 t-ratio 2.37 2.11 2.37 2.05 DIMS03 0.005 0.006 t-ratio 0.86 0.97 NSMUN03 0.123 0.121 t-ratio 0.42 0.41 DISTRICT DUMMIES X X X X R2 0.133 0.118 0.133 0.115 ADJUSTED R2 0.035 0.045 0.035 0.042
To gain greater insight into this finding we performed the same estimations including a dummy per quartile, defined as before. The results are shown in Table 9. The coefficients of the variables related to the size of the schools and the competitiveness of their environment are not statistically significant. So, in equations (2) and (4) of Table 9 we show the results for the estimations without these variables. We find that the effect of the rank on the concentration of students receiving social aid is significant only for quartiles three and four. This confirms our earlier conclusion about the equity-decreasing effect of the published rankings.
11
Given that we are now restricting our data set to schools with pupils benefiting from Social Aid, strictly private schools (privately funded by tuition fees) are excluded by nature. As we had data for only three Publicly Funded Private Schools, we excluded these from the analysis, too.
15
Table 9: Variation in The Percentage of Students Receiving Social Aid
Per School 2004/2010 (80 Schools)
1 2 3 4 RANK 2003/07 RANK 2003/09 CONST -1.424 1.604 -1.362 2.039 t-ratio -0.34 0.52 -0.32 0.67 RANK*Q1 0.037 0.03 0.036 0.029 t-ratio 1.85 1.66 1.89 1.64 RANK*Q2 0.025 0.018 0.024 0.017 t-ratio 1.92 1.60 1.82 1.45 RANK*Q3 0.025 0.019 0.026 0.020 t-ratio 2.31 2.05 2.28 1.99 RANK*Q4 0.021 0.017 0.023 0.018 t-ratio 2.25 1.98 2.26 1.96 DIMS03 0.004 0.005 t-ratio 0.62 0.77 NSMUN03 0.216 0.188 t-ratio 0.67 0.59 DISTRICT DUMMIES X X X X R2 0.145 0.130 0.146 0.128 ADJUSTED R2 0.007 0.018 0.007 0.016 7. Conclusions
Our results suggest that the publication of rankings has strong effects upon families and schools. Students react by moving in and out of the schools, according to their published rank. This is an interesting point given that, at least for public schools, there are typically legal restrictions on enrollment decisions, according to the geographic location of the household.12 Even so, students exert some choice over which school to enroll in. This result is in line with the empirical literature about the effects of low-stakes accountability policies on the performance of schools measured by scores in national exams.
The effect for private schools is stronger and deeper, for schools with poorer classifications. Low-scoring private schools tend to disappear, while the same does not hold true for public schools.
We also showed that published rankings have a negative impact on equity, by increasing the concentration of lower income students in badly performing schools. This conclusion calls for
12
Throughout this period the exact nature of these restrictions has changed. For example, in some years students could use the location of one of the parents’ workplace in order to enroll in a given school, while in other years this possibility was ruled out. Nevertheless, the results suggest that, whatever were the resources put by schools and the Ministry on the enforcement of these restrictions, these efforts have not succeeded, i.e. students move.
16 the need to design and implement policies specifically aimed at improving the quality of the worst public schools in the rankings, thus allowing the education system to continue to benefit from the efficiency-enhancing effects of the accountability policy without compromising social mobility and cohesion.
As mentioned above, several authors have stressed that part of the effect of the publication of the ranks on the average score of schools can be due to several forms of “cheating” or “working to the score”. A common way to do this is to withhold from national exams those students that are expected to perform below the average. To investigate this, one would need to correct the information about scores by the percent of students enrolled at the beginning of the year that actually perform their exams in the school, an information that is unavailable to date. Nevertheless, our point here is not to state that the rankings are a good instrument of policy, but rather to analyze whether their publication has consequences over the education system. Our conclusion is that they have, and that these effects are strong. This conclusion reinforces the need to verify the type and quality of the information implicit in those rankings. Further, as mentioned above, the disclosure of this information is independent from any government intervention. This raises the issue of the existence of potential benefits stemming from the public disclosure of complementary information.
References
Chiang, Hanley, 2009, “How accountability pressure on failing schools affects student achievement, Journal of Public Economics, 93, 1045-1057.
Clotfelter, Charles T. Helen F. Ladd , Cob L. Vigdor, and Aliaga Diaz, 2004, “Do School Accountability systems Make It More Difficult for Low-Performing Schools to Attract and Retain High-Quality Teachers? Journal of Policy Analysis and Management, Vol. 23, ( 2), 251–271.
Chakrabarti Rajashri, 2008,” Impact of Voucher Design on Public School Performance: Evidence from Florida and Milwaukee Voucher Programs”, Federal Reserve Bank of New York Staff
Report no. 315.
Chay, Kenneth, Patrick MacEwan, and Miguel Urquiola, 2005, ''The Central Role of Noise in Evaluating Interventions That Use Test Scores to Rank Schools'', The American Economic Review,
95 (4): 1237-1258.
Cullen, Julie Berry and Randall Reback, 2006, “Tinkering toward accolades: school gaming under a performance accountability system” in T. Gronberg and D. Jansen, eds., Improving School
Accountability: Check-Ups or Choice, Advances in Applied Microeconomics 14 (Amsterdam:
Elsevier Science): 1-34.
Elstad, Eyvind, 2009, "Schools that are Named, Shamed and Blamed by the Media: School Accountability in Norway", Educational Assessment, Evaluation and Accountability, 21(2): 173-189.
17 Figlio, David N. and Lawrence S. Getzler, 2002, “Accountability, ability and disability: gaming the system”, National Bureau of Economic Research Working Paper 9307, at http://www.nber.org/papers/w9307 .
Figlio, David N., and M. Lucas, 2004, “What’s in a grade? School Report Cards and the Housing Market,” American Economic Review, 94 (3): 591-604.
Figlio, David N., and C. Rouse, 2006, “Do accountability and voucher threats improve low-performing schools?”, Journal of Public Economics”, 90.
Hanushek, Eric and M. Raymond, 2005, “Does school accountability lead to improved student performance”, Journal of Policy Analysis and Management, 24, (2): 297-325.
Jacob, Brian, 2005, “Accountability, Incentives and behavior: the impact of high-stakes testing in the Chicago Public Schools”, Journal of Public Economics, 89: 761-896.
Koning, Pierre and Karen van der Wiel, 2010, “School Responsiveness to Quality Rankings”, CPB Discussion Paper 149.
Neal and Schanzenbach, 2010, “Left behind by design: proficiency counts and test-based accountability”, The Review of Economics and Statistics, 92 (2): 263-283.
Reback, R, 2008, Teaching to the rating: School accountability and the distribution of student achievement, Journal of Public Economics ,92: 1394-1415.
Schutz, Gabriela, Martin R. West, and Ludger Wobmann, 2007, “School Accountability, Autonomy, Choice, and the Equity of Student Achievement: International Evidence from PISA 2003”,OECD Education Working Papers, No. 14OECD.
West, Martin R, and Paul E. Peterson, 2006, “The Efficacy of Choice Threats Within School Accountability Systems”, The Economic Journal, 116, ( 510): C46-C62.