Abstract— This paper presents an Android-based mobile
app designed to provide real time context aware public transportation information and advice to its users through the combination of the user’s preferences and geographic context with data retrieved from a public transportation information system called XTraN Passenger. Thus, this mobile app contributes to fulfill the necessities of the passengers, and also provides an incentive for people to use the public transportation infrastructure more frequently. The proposed mobile app allows the users to benefit from the access to real time public transportation data in a simple and intuitive way. The validation of the features and operation of the developed app was assessed with results from use cases and real-world experimental tests using public transportation data from a Brazilian bus fleet operator.
Index Terms— Geographic Information System, Global
Positioning System, Intelligent Transportation System, Mobile App, Personalization, Real Time Information.
I. INTRODUCTION
Current public transportation networks have to manage the daily commuting of tens of millions of people living in the metropolitan areas of the world. The growing complexity of these networks, together with the worldwide proliferation and reduction of cost of mobile data, has opened an opportunity for emerging mobile phone technologies to contribute with a very significant improvement in the quality of life of commuters all around the world. Therefore, this subject has raised a high level of interest from local governments and the public, as well as investment from companies worldwide, due the impact that information technology can have.
The immediate availability of real time information regarding the status of the public transportation network can be considered a top priority issue in cities like London,
Manuscript received December 26, 2016. This work is supported by FCT with the reference project UID/EEA/04436/2013, by FEDER funds through the COMPETE 2020 – Programa Operacional Competitividade e Internacionalização (POCI) with the reference project POCI-01-0145-FEDER-006941.
Joao C. Ferreira is with Instituto Universitário de Lisboa (ISCTE-IUL), ISTAR, Lisbon, Portugal and Centro Algoritmi (e-mail: [email protected]).
Henrique Silva is with Tecmic, Porto Salvo, 2740-120, Portugal (e-mail: [email protected]).
Jose A. Afonso is with CMEMS-UMinho, University of Minho, Campus of Azurem, Guimaraes, 4800-058, Portugal (phone: 351-253510190; fax: 351-253510189; e-mail: [email protected]).
Joao L. Afonso is with Centro Algoritmi, University of Minho, Campus of Azurem, Guimaraes, 4800-058, Portugal (phone: 351-253510190; fax: 351-253510189; e-mail: [email protected]).
Tokyo and São Paulo, where the disruption of a single transportation line could lead to chaos. However, it is beyond any kind of practicality to be informed of every one of the around 19000 stops that London buses makes available to people, or to plan a trip that takes into consideration the commuting times between so many different buses, and let alone know if there is a problem with the network branch you are planning to use, since there are 673 different bus routes in London alone [1].
The solution presented in this paper makes use of the widespread availability of Android smartphones to create a personalized public transportation advisor taking into account the user’s personal preferences, current location and desirable destination. Making use of high speed mobile networks, like 4G and Wi-Fi, available today in big cities, this prototype combines the user’s current context with the XTraN Passenger API (Application Programming Interface) [2], which was developed by Tecmic, a Portuguese company. Instead of putting all the information in front of the user, the application’s main objective is to filter the overwhelming complexity of the modern transportation network information extracted from the XTraN Passenger system, showing only what is most relevant to the particular user context, through the mobile app, in real time, whenever it is needed.
Although the typical everyday commuter is familiar with his/her route, the added value that a real time public transportation advisor offers to the user is the opportunity of obtaining much better travel time estimates, helping the user know when to leave home for work or if he can afford to wait for the next bus. When the user is not familiar with the routes, the value of this mobile app is even higher, because, among other features, the user can check at any time which bus stops and routes are closer to his current position, and from this starting point he can then check the waiting times at these stops. For the purpose of this application, network connections at speeds of 3G or above are sufficient for a fluent user experience.
II. RELATED WORK
There is a diversity of public transportation information systems that support transportation operators in their activity. Many major operators have their own systems, but that does not fit in user needs because he needs real time information from the diversity of available operators.
XTraN Passenger is a public transportation information system developed by Tecmic, and it is implemented in a diversity of public transportation operators in Portugal and Brazil. This system is customized for each client, as the
Context Aware Advisor for
Public Transportation
Joao C. Ferreira, Henrique Silva, Jose A. Afonso, Member, IAENG, and Joao L. Afonso
IAENG International Journal of Computer Science, 45:1, IJCS_45_1_12
example of the operator Carris, in Lisbon. The XTraN Passenger system [2] was engineered to produce detailed real time statistics on the fleets’ activity, giving the operators the capability to improve their services and strategy based on the feedback gained from the system. The basic functionality of the system includes real time data on individual vehicles equipped with the XTraN Passenger on-board device, allowing for precise provision of estimated time of arrival (ETA) information and multiple channels to share information with the public (such as bus stop panels and SMS information services), integration with ticketing systems, continuous voice and text communication with the driver, fuel consumption statistics and analysis, as well as an on-board security feed and an engine kill-switch [3].
The widespread use of geographical information systems (GIS) for the purpose of intelligent transportation systems (ITS) during the last decade, along with an increased demand for business intelligence systems which optimize a city’s public transportation network, created a necessity for advances in the mechanisms through which geographic information systems are used. Continuous research, together with the worldwide use of mobile devices and the mature state of current Web service technologies, paved the path to the creation of GIS-T (geographic information systems for transportation). As the symbiotic use of both GIS and ITS is of extreme importance for city councils or public transport operators, so is the need for an effective translation of geographic coordinates into usable data and the business intelligence derived from that data.
The last decade also saw the emergence of the Internet of Things [4][5], which has the potential to increase significantly the quantity and quality of sensor data available to the users, as well as the proliferation of service-oriented architectures, which promoted the adaptation of GIS systems so that they could easily become accessible through other media [6]. In [7] the author explores the use of GIS Web services and service-oriented architectures with the objective of achieving a symbiotic architecture and building a Web service enabled GIS-based intelligent transportation application system [8].
The literature review done in the beginning of this work shows that there is a wide variety of research being done in the field of public transportation information on mobile devices. The list of analyzed apps in the context of this work was reduced to the following final pool based on the application area (Lisbon city) and relevance: (1) IZI Carris (Lisbon specific, single-operator: Carris) [9]; (2) Lisboa Move-Me (Lisbon specific, multi-operator) [10]; (3) Moovit (international, multi-city, multi-operator) [11]; (4) Citymapper (international, multi-city, multi-operator) [12]. These mobile apps were tested for the purpose of comparing not only the available features in these applications but also their degree of usability, graded by user satisfaction rating recorded on the Google Play store. The combined outputs of the authors’ own testing together with the public’s praise and criticism of these apps helped to mold the specifics of each of the use cases chosen for the final version of the proposed mobile app.
III. DEVELOPED MOBILE APPLICATION
This mobile app, named XTraN App, aims to not only provide accurate real time data about buses, stops and routes, but also to present this information in a logical and intuitive way. An example would be that the user does not want to consult an extensive list of all buses provided by the operator, but instead he prefers to know when his commute bus is arriving; therefore, the home screen of the application always displays commute transports first.
A. App Requirements
The following software requirements specification was established based on the study of other related apps and on the experience of public transportation experts:
• R0: Interoperable. The mobile app must be cross-compatible between different operators and countries, since it is available to all different public transportation operators that use the XTraN Passenger system in Brazil and Portugal.
• R1: Static consultation. The app must provide to users complete static timetables and static estimated times of arrival (ETAs) of desired buses at any point in the chosen operator’s network. There are multiple public transportation providers to choose from.
• R2: Real time XTraN information access. The mobile app enables the user to sort through the immensity of information made available by the XTraN Passenger system, taking into account the commuter-oriented nature of the application and discerning between the features that are needed to the user and the ones that are administrator-oriented.
• R3: Dynamic contextualized consultation. The user may know at any time which bus stops are closer to his current position, the respective bus routes and the ETA of the next bus in each route.
• R4: Personalized information. The mobile app must be able to access the huge database provided by Tecmic and sort through the data available, only exposing to the user the information that is relevant for him based on the current context.
• R5: Personalized bus stop status. The app must provide notifications in the morning with the current status for the user’s morning commute bus stop and bus route.
• R6: Locate next buses. The user must be able to know in real time the ETAs for the next buses departing from the intended point of boarding. Time estimates for the bus arrival are provided based on the current traffic context (available time-variants such as peak and off-peak daily variants, as well as weekday, weekend, holiday and seasonal changes), allowing for precise planning of arrival at the stop. The developed TimeEstimator service is a key part in obtaining realistic estimations based on thousands of buses making that same course on similar days. • R7: Trip mode 1. The user must be able to know where he
is relatively to the planned bus route at all times when this trip-mode is on. This feature provides warnings to allow a user in an unknown route to know when to press stop and leave the bus without previously knowing the place.
IAENG International Journal of Computer Science, 45:1, IJCS_45_1_12
Fig. 1. Mobile platform architecture. • R8: Trip mode 2. The prototype is able to access events
made available by the system in real time, providing the user real time guidance and warnings relevant to his commute, the traffic, and delays on the routes considered relevant, such as favorites, to the user.
• R9: Intuitive UI. The UI designed for this application must be responsive and present data in an intuitive manner in such a way that a new user can easily use the application for its purpose without the initial struggle typical of other applications managing complex data. • R10: Bus detection. The detection of the start of the user’s
journey is challenging, since there is currently no direct communication between the phone and the bus. The self-triggering of trip-mode and correct bus detection was done in another work [13].
• R11: Social network. Integration and interaction with social networks such as Facebook and Google+ will be provided with the objective of establishing user ratings for the chosen bus routes, keeping operators accountable for delays and other deviations from the static timetable and creating social pressure for providing reliable bus services.
• R12: RSS feed. Subscription of the RSS feeds of relevant bus operators will be possible. Integration with Android notification for disruption in the operation of the network will be provided.
B. Platform Architecture
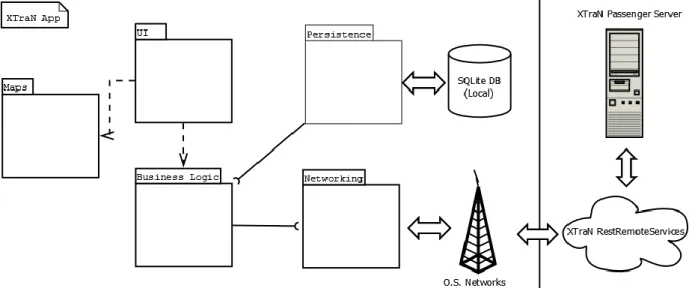
The architecture of this mobile application platform was designed to follow a layered structure adapted to the Android operating system’s operational requirements. The modules can be logically divided in five big components (Fig. 1): User Interface (UI), Business Logic, Persistence, Networking and Maps.
The UI module was one of the main investments during the development, and constituted a considerable part of the “prototyping phase” of this work. The UI module of this prototype follows Google guidelines, taking advantages of the latest developments in activities, adapters and fragments, so that a more fluid experience can be achieved. In situations where the components made available by Google were not
considered by the authors as the best fit, new ones were developed, such is the case of the home screen. The UI module includes components which can be organized in two groups: customization and performance optimization.
The Business Logic module deals with data structures which represent the real world public transportation companies from a commuter perspective: it is composed by buses and bus routes, bus stops and waiting times in a way which allows an accurate modeling of the business. This module uses both the Persistence and the Networking module.
The Persistence module deals with local storage, following the data access object (DAO) pattern to access a SQLite database.
The Networking module makes use of one of Google’s latest developments in networking implementation, the Volley library. This alternative to the native AsyncTask class allows for faster networking over HTTP (Hypertext Transfer Protocol), supports caching of requests, and is perfectly integrated with JSON (JavaScript Object Notation) requests, which suits the needs of this app. The Networking module deals with the crucial task of optimizing communications on top of the operating system’s network manager and libraries, allowing for asynchronous communication, coherent cache management and other features offered by Android Volley.
The Maps module deals with bringing geographic information to the user, representing user location and other geographic data such as bus stop locations in an easily understandable visual language. It uses the OpenStreetMap library for Android, which provides complete overlay customization (which suits our needs to draw objects on the map) and interchangeable tile servers, so that a change on the tile server, if desired, can be made by changing just a few lines of code.
C. User Interface
The presentation layer of the UI module is mostly composed by activities, fragments, layouts and drawable resources. Taking a simple case as example (Fig. 2) where one activity groups together the most used features in swipe view tabs, these components work in sets: each activity uses
IAENG International Journal of Computer Science, 45:1, IJCS_45_1_12
a layout and drawable resources. Activities may also contain fragments with their own lifetime cycle, which in turn also have their own layouts that may use drawable resources.
The presentation layer is loosely coupled with the Business Logic and Persistence modules, and all code here aims at making a better use experience and displaying the information provided by the Business Logic module in a way that makes sense for the user.
Fig. 2. User Interface example: activity hosting a fragment that features
all the available bus routes. D. Business Logic
The Business Logic module was planned to fit the needs of a real world public transportation business, while simultaneously simplifying whenever it was possible to do so. One of such examples is the model and the equivalent factories needed to obtain the correct object instances. Most instances of the model are then used by the adapters referenced previously as parts of the datasets feeding the adaptation layer sitting between the business model/business logic and the presentation layer.
The XTraN Passenger system offers a comprehensive set of features and entities describing real world public transportation business. The system was designed to serve the needs of fleet owners, managers and planners, which includes much a much larger amount of meta-data and results in a respectively more complex model than the one that needs to be publicly exposed or that is needed for the scope of a public domain application. For the purpose of building this prototype, a task of slimming down the existing model was performed (for example, the bus commuter does not need an app entity representing each bus driver). In order to fulfill the needs of the prototype’s use cases, the following model and entities are used: Bus, BusStop, City, Route, RouteVariant and TimeEstimation. These entities are instantiated by the corresponding factories, which make an optimized use of network requests through the addition of an intermediate network layer (using Android Volley).
IV. LOCATION STRATEGIES
This section provides an analysis of diverse strategies of acquiring a user location fix, with different configurations and constraints, in the context of the Maps module of the developed mobile application.
A. Google Location Services
Situations with different constraints that may arise during the operation of the mobile app, such as low power resources, indoor operation, or outdoor operation in an urban canyon environment, may require the use of different location providers. The location providers offered by the Google location services are: GPS provider, Network provider with or without Wi-Fi access point information, and Passive provider. The developer must evaluate the constraints and decide on which “criteria” to use and decide which location provider is best for his purposes. This is a matter of relevance to this work: ideally a user should be able to use the context aware features of the application even if he is still at home, inside a building.
As described in the Android Developers documentation, the GPS provider is the most accurate, as it gets the most precise location fix. However, it needs a clear line to the satellites, as well as a longer time to first fix (TTFF), and it also implies higher power consumption. It requires the Android permission ACCESS FINE LOCATION. This provider will be useless in most cases where the user is indoor, but if he is outdoor, the GPS provider can get an accuracy of approximately 2-5 m. In the context of this application the GPS provider is the most indicated location provider for situations where the user needs to know his precise location, such as when looking for the closest bus stop. An alternative would be to use the Network provider which uses assisted GPS (AGPS) cell tower ID and Wi-Fi MAC address (if using Wi-Fi assisted Google location services). This provider will get a faster initial fix while keeping its accuracy at a high level, by using AGPS along with the GPS chip, and it also drastically reduces power consumption. This provider also includes the possibility of using Wi-Fi to further assist in getting a location fix.
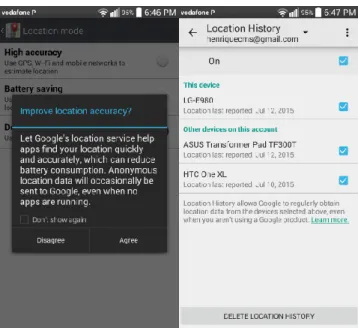
In densely populated areas with an increased amount of Wi-Fi access points and cell towers, it is possible to get an acceptable location accuracy even with the GPS disabled. This works because Google location services record user location data through crowd-sourcing Wi-Fi MAC addresses from all users’ devices (an example can be seen in Fig. 3).
An interesting comparison experiment by M. Fasel [14] regarding this matter shows the difference in performance when using different providers, highlighting their advantages and shortcomings. The “accuracy circle” around the estimated location associated to the GPS provider is typically smaller (i.e., higher accuracy) than the Network provider counterpart. A few remarks which are relevant to our prototype application must be made from this experiment. This experiment was performed in Melbourne in what can be described as an “urban canyon”, which is the typical city scenario in which the prototype is meant to be used. This is a relevant point to justify that, even though there is a better accuracy, the position is sometimes drawn inside the buildings instead of on top of the line which represents the actual route taken. The explanation is that, if the received GPS signal is reflected in buildings instead of coming in direct line from the satellite, this will affect the triangulation of the position, frequently resulting in the user
IAENG International Journal of Computer Science, 45:1, IJCS_45_1_12
being positioned inside the building rather than on the sidewalk. If the prototype uses only the GPS provider such inaccuracies are to be expected, affecting the search of the nearest bus stops, for example.
Fig. 3. Crowd-sourcing user location data: Wi-Fi-assisted location service. Another problem in using only the GPS provider is the occurrence of momentary loss of GPS signal. As an example, the author reported loss of signal when going through a narrow street, only recovering it near the end of the journey, which would pose a problem for the typical user of our application. In another experiment, the author used the Network provider with very high accuracy, supported by the Wi-Fi-assisted Google location services, but also reported a problematic occurrence when the location of one Wi-Fi access point was moved. Since the original location was already mapped by many users, the access point triggered false positive location fixes from the moment it was moved. This could also be problematic for our application, if it was not such a rare occurrence.
B. Strategies for Efficient Location
Regarding to power saving and user location strategies, there are several parameters which can be used in our favor in order to better achieve the goals of the proposed mobile app prototype, while minimizing setbacks that would be prejudicial in a production environment. In our development we looked for problems concerning to: (1) location accuracy vs power saving; (2) Time to first fix (TTFF) vs location accuracy; (3) Request update location speed vs power saving; (4) Is indoor operation required?; (5) Is the application most likely to be used in a densely populated area?
The calibration of the criteria adopted for deciding on the used location provider may differ for different situations. In the case of our prototype, the criterion has been to prioritize the speed to acquire a location fix (even if at the initial expense of the accuracy with which the TTFF is minimized), which is done by getting an initial fix from the Network provider. Reflecting on the first topic of the list above, leveraging location accuracy versus power saving, it
becomes clear that obtaining the first fix will consume less power by using the mobile network instead of waiting for an accurate fix from the GPS chip.
An important requirement for a mobile transports application is that it should work in most situations. The user may choose to plan his trip from the street, but also from home, so there is a constraint that the prototype application should work indoors. The dual use of the Network provider first, and then the GPS provider, addresses this requirement. Sacrificing accuracy as a tradeoff for indoor operation and a short waiting time for a fix may appear as a bad optimization, but not all factors are yet accounted for. It is a fair assumption that if the user is using these public transports application, he finds himself in the same urban environment where the transports operate.
This will introduce two situations: the possibility in which the user finds himself in a street that resembles an urban canyon, and the possibility that even if he is not at home, there are Wi-Fi access points in the vicinity. The urban canyon situation will minimize the benefits that would come from using the GPS provider, by getting wrong location readings due to GPS signal reflection on the surrounding buildings, and an even longer waiting time for the first fix. On the other hand, being a densely populated area, the Network provider will maximize the benefits of the surrounding Wi-Fi access points, increasing the accuracy of the Network provider by a large factor.
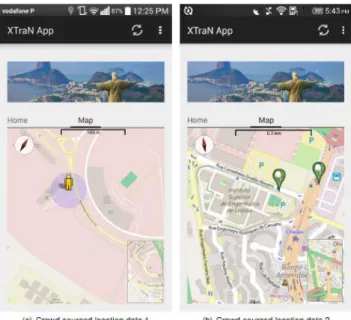
A comparison of the results obtained with the mobile app prototype using different location providers is shown in Fig. 4. When forcing the application to use only the Network provider, and disabling Wi-Fi, leaving only the cell tower ID to pinpoint the user’s current location, the accuracy was the worst (Fig. 4(a)), as expected, but the location fix was almost instantaneous (< 1 s) and with minimal battery use. After enabling Wi-Fi, the location fix was much more accurate (Fig. 4(b)). The time to first fix was small (< 5 s) and the consumption was kept at a low level by not using the GPS module. The last test used the deployed settings of the prototype without forcing any of the providers on/off. By analyzing Fig. 4(c), a few conclusions can be drawn. The TTFF increased to approximately 1 minute even with the assistance of the networking module (AGPS), but the reported accuracy also increased by a large factor, as well as the power consumption, due to the usage of the GPS chip.
Fig. 4. Position and accuracy reported by the prototype operating with different location providers, measured from the same place.
IAENG International Journal of Computer Science, 45:1, IJCS_45_1_12
An interesting point to be made is that the actual place where the experiment was performed is outside of the circle where the accuracy of the measurements is supposedly displayed, which means that the reported accuracy is flawed. This fact can be explained by the experiment being made on a balcony on a high floor. With half of the expected satellites covered by the building, a strong multipath effect can be expected, with the device receiving GPS signal reflected off the ground where the map is getting the fix.
V. SYSTEM EVALUATION
The methodology followed in the validation of results obtained with the prototype consists in two phases. The first is a detailed walk-through of the steps in each use case to validate the operability of the prototype. Phase two is designed to validate the features offered by the prototype by matching the results against real world data from a commercially deployed setting of the XTraN Passenger system.
A. Current Position Information
This use case tests the capability of the application to offer to the user information on his whereabouts, providing geographic location information in a map. The first position checking, performed at a Tecmic office near the IST Taguspark campus (IST and ISEL are two Portuguese higher education institutions located in Lisbon), shows the user location and his surroundings (Fig. 5(a)). A working example is shown in Fig. 5(b), with the closest bus stops to ISEL campus being drawn using the Open Overlays mechanism.
Fig. 5. Current position information results. B. Route List and Route Data
This use case shows the user the complete list of RouteVariants provided by the public transport operator. The results show that the user can get the app to show the complete list with one swipe. A partial list of routes is shown in the left side of Fig. 6.
With a single click on an entry on the route list, the app shows the corresponding route data representing all this
RouteVariant bus stops, as shown in the right side of Fig. 6. With only another swipe, the user can check the composition of the return way of the RouteVariant, which is frequently composed of different stops, due to one way streets and other transit regulations.
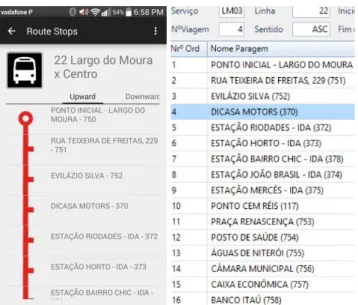
Fig. 6. Route list (left) and route data (right). C. Bus Stop Status
This screen displays an interactive real time version of the bus stop timetable, showing the expected waiting time for the next buses (Fig. 7, left) and also identifying the different RouteVariants currently passing through that bus stop.
This feature is working as expected, but when looking for anomalous cases, results show that the prototype also displays buses which are registered as “not yet in voyage”. These vehicles are shown with a real position relative to normal working buses but always with a “0 min” waiting time associated to the bus (a real case of one of these anomalies can be seen in Fig. 7). From this test it was also observable that the layout and adapter are ready to accept multiple buses registered to a single RouteVariant, but as of the current date the API was not optimized for this UX (User Experience) usability feature.
D. Frequent Buses and Routes
The test illustrated in the right side of Fig. 7 represents the most used feature predicted for the application: the user simply opens the app and is quickly shown real time data on his most frequently used buses (trip home-work and work-home). We show also the average time (29 minutes) for the path home-work, the maximum trip time (56 minutes) and the distance (5555 m). The test shows that the performance mechanisms implemented in each of the different adapters work almost flawlessly, allowing the user to scroll customized rows taking into account the limit space available in a mobile device to show the information, at any speed that he likes.
E. Real World Tests
This set of evaluation tests used a VPN connection to the Brazilian servers of the public transportation company “Auto Lotação Ingá”, which operates in the cities of Rio de Janeiro
IAENG International Journal of Computer Science, 45:1, IJCS_45_1_12
and Niteroi, for direct access to the commercially deployed XTraN Passenger system. Through this connection, real world experimental data was obtained, which was used to validate the features of the developed mobile application. A desirable complementary method, which will be applied before production, includes users personally testing the prototype “on the ground” in Rio de Janeiro. Each of the features of the application will be verified against results from the fleet management functions of the XTraN Passenger system deployed on the company.
Fig. 8 illustrates side by side the synoptic map representation of a bus route variant with its respective counterpart verified in the operations center software.
Fig. 7. Bus stop status (left) and frequent buses and routes (right).
Fig. 8. Validation of bus stops constituting a synoptic route map. The next validation test was performed by accessing the live feed in the new generation public information panel screens at the company’s bus stops (Fig. 9) and comparing the estimated times with what is shown in the XTraN App (Fig. 10, left). All ETAs from buses which are actively in voyage are shown in the application correctly; furthermore, the prototype shows ETAs for other “in voyage” buses which are not represented in the physical panel, but that also go through the “Moinho Atlântico” bus stop. The right side of Fig. 10 shows the screen for selection of favorite lines and bus stops.
Fig. 9. Waiting times at bus stops as seen in the public information panel at the bus stops in Brazil.
Fig. 10. Waiting times at bus stops as seen in the mobile app (left) and selection of favorites lines and bus stops (right).
Other features of the mobile app, associated to the bus list, current position and bus stop status, were validated in a similar way. The conclusions that can be drawn from this experiment are very encouraging. The results obtained by the comparison between the values displayed by the mobile app prototype and the data available in the fleet management center in Brazil show that the values match perfectly, and the prototype can offer more relevant information to the user, as intended from the start.
VI. CONCLUSION
This paper presents the development of a mobile app prototype based on the XTraN Passenger intelligent transportation system, from Tecmic. The obtained results show that the developed prototype meets the needs of the company for a successful implementation in the market.
The first stage on the development of the mobile app was the specification of the software requirements, which was based both on the features desired by Tecmic and the study of other apps available in the market. The comparison of features, usability and user satisfaction helped to mold the specifics of each of the use cases chosen for the prototype’s final version.
Another objective of the developed prototype was to implement the results of the use cases in ways that could be translated into a personalized user experience, where the user’s own inputs are significant for the resulting output of the application. Inputs such as the users’ preferences on the most used transports and the current geographic position are relevant factors for the use of the application and for extracting the most benefits out of it.
IAENG International Journal of Computer Science, 45:1, IJCS_45_1_12
Important work was also done in the field of optimization of Android resources and base classes, such as BaseAdapter, and the interaction with AdapterView classes, as well as in the field of customization of existing user interface classes and views. All of these developments resulted in an overall different and improved experience for the user, which will lead to a better future commercial product.
Even though there is a high degree of customization, there is very little to no noticeable lag in the utilization of the developed prototype, with the exception of some transitions between tabs (Home screen – Map screen – Route Search screen). This is a point to be improved in the future, but that do not hinder the current usability of the application.
REFERENCES
[1] Joao C. Ferreira, Henrique Silva, Jose A. Afonso, and Joao L. Afonso, “An Android-Based Personalized Public Transportation Advisor,” Lecture Notes in Engineering and Computer Science: Proceedings of The World Congress on Engineering 2017, 5-7 July, 2017, London, U.K., pp. 392-397.
[2] Tecmic “XTraN passenger - operating support systems for passenger transport,” [Online]. Available http://www.tecmic.pt/en/portfolio/ xtran-passenger/. [Accessed July 5, 2015].
[3] Tecmic, “XTraN passenger infopublic,” [Online]. Available http://www.tecmic.com/wp-content/uploads/2014/05/InfoPublic_EN. png. Accessed July 5, 2015].
[4] D. Miorandi, S. Sicari, F. De Pellegrini and I. Chlamtac, “Internet of Things: Vision, Applications and Research Challenges,” Ad Hoc Networks, Vol. 10, No. 7, pp. 1497-1516.
[5] C. Perera, A. Zaslavsky, P. Christen and D. Georgakopoulos, “Context Aware Computing for the Internet of Things: A Survey,” IEEE Communications Surveys & Tutorials, Vol. 16, No. 1, 2014, pp. 414-454.
[6] IBM, “Web services architecture overview - the next stage of evolution for ebusiness,” [Online]. Available http://www.ibm.com/ developerworks/library/w-ovr/. [Accessed July 5, 2015].
[7] X. Lu. “Develop Web GIS Based Intelligent Transportation Application Systems with Web Service Technology,” in Proceedings of 6th Int. Conference on ITS Telecommunications, Jun. 2006, pp. 159-162.
[8] W. Tang and J. Selwood, “Connecting our world: GIS Web services,” ESRI Press, Redlands, Calif., 2003.
[9] IZIMOOVE, “IZI Carris,” [Online]. Available https://play.google. com/store/apps/details?id=pt.izimoove.carris. [Accessed July 5, 2015].
[10] OPT, “Lisboa Move-me,” [Online]. Available https://play.google. com/store/apps/details?id=pt.izimoove.carris. [Accessed July 5, 2015].
[11] Moovit, “Moovit: Next bus and train info,” [Online]. Available https://play.google.com/store/apps/details?id=com.tranzmate&hl=en. [Accessed July 5, 2015].
[12] Citymapper Ltd., “Citymapper - real time transit,” [Online]. Available https://play.google.com/store/apps/details?id=com.citymap
per.app.release. [Accessed July 5, 2015].
[13] N. Baeta, A. Fernandes and J.C Ferreira, “Tracking Users Mobility at Public Transportation,” in Proceedings of PAAMS 2016 - 14th International Conference on Practical Applications of Agents and Multiagent Systems, Jun. 2016.
[14] M.Fasel, “A good look at android location data,” [Online]. Available https://shinesolutions.com/2011/10/14/a-good-look-at-android-location-data/. [Accessed August 20, 2016].