EFFECT OF PARTICLE SIZE AND BACTERIAL INOCULANT ON THE
TEMPERATURE, DENSITY AND pH OF PEARL MILLET SILAGES
1ANÍBAL COUTINHO DO RÊGO2*, GUSTAVO REZENDE SIQUEIRA3, GERALDO BENEDITO DE SOUZA ALMEIDA4, RICARDO DIAS SIGNORETTI3, FLÁVIO DUTRA DE RESENDE3
ABSTRACT – The present study aimed to investigate the temperature at different depths of the stack silo and strata front profile before and after the removal of silage. Also, the pH values in the upper and lower profile and the silage density of the fresh materials (FM) and dry matter (DM) in pearl millet silages with particle sizes of 5 or 20 mm, with or without inoculant, were assessed, using corn silage as controls. There was an interaction (P<0.05) silage × stratum profile and silage × depth profile for the temperatures before the removal of silage, and the pearl millet silages had lower temperatures in the upper stratum compared to corn. The temperature gradient between the silage and environment pearl millet and corn silos were smaller in the lower stratum profile. The temperature gradient after the removal of the silage was less than 50 cm deep at all the pearl millet silos. There were no differences in the densities of the FM and DM of the studied silages. The pH values of the silages before their removal were higher in the upper stratum and lower stratum in the bottom of all the pearl millet silages, in contrast with corn silage. The pearl millet silos had lower pH values in the lower stratum of the silo. Silages with 5 mm particle size provide lower temperatures in the middle portion of the panel before the removal of the silage. The use of bacterial inoculant in this study did not change the characteristics evaluated.
Keywords: Inoculants. Lactobacillus plantarum. Pennisetum glaucum (L.) R. B.. Propionibacterium
acidipropionic. Stack silo.
EFEITO DO TAMANHO DE PARTÍCULA E DE INOCULANTE BACTERIANO NA TEMPERATURA, DENSIDADE E pH DE SILAGENS DE MILHETO
RESUMO - Objetivou-se avaliar a temperatura nos diferentes estratos e profundidades do perfil frontal de silos
do tipo superfície antes e após o desabastecimento. Avaliou-se ainda, valores de pH na porção superior e
inferior do perfil, densidade da matéria natural (MN) e matéria seca (MS) em silagens de milheto com
partículas de 5 ou 20 mm, contendo ou não inoculante bacteriano, utilizando-se a silagem de milho como
controle. Houve interação (P<0,05) silagem × estrato do perfil e silagem × profundidade do perfil para as temperaturas antes do desabastecimento, sendo que as silagens de milheto apresentaram menores temperaturas no estrato superior quando comparadas as de milho. Os gradientes de temperatura entre silagem e ambiente em
silos de milheto e milho foram menores no estrato inferior do perfil, comprovando-se nas termografias pelo
clareamento nessa região. O gradiente de temperatura após o desabastecimento foi menor a 50 cm de profundidade em todos os silos de milheto. Não foram observadas diferenças nas densidades da MN e MS das silagens estudadas. Os valores de pH das silagens antes da retirada, foram maiores no estrato superior e menores no estrato inferior em todas as silagens de milheto, exceto na silagem de milho. Silos de milheto apresentaram menores valores de pH no estrato inferior do silo. Silagens com tamanho de partícula de 5 mm proporcionam menores temperaturas na porção mediana do painel antes do desabastecimento. O uso do inoculante bacteriano no presente trabalho não foi capaz de alterar as características avaliadas.
Palavras-Chave: Inoculante. Lactobacillus plantarum. Pennisetum glaucum (L.) R. Br. Propionibacterium
acidipropionici. Silo de superfície.
________________ *Corresponding author
1Received for publication in 08/31/2014; accepted in 04/11/2016.
Paper extracted from the doctoral thesis of the first author.
2Department of Animal Production and Health, Universidade Federal Rural da Amazônia, Belém, PA, Brazil; anibalcr@gmail.com. 3Agência Paulista de Tecnologia dos Agronegócios, Colina, SP, Brazil; siqueiragr@gmail.com, rdsignoretti@bol.com.br,
flavio@apta.sp.gov.br.
Rev. Caatinga
INTRODUCTION
A substantial challenge for the next decades will be the increase in agricultural production with the efficient use of water, especially in areas with hydric limitations (FERERES; SORIANO, 2007).
Therefore, the use of small-cycle crops that are
resistant to water deficits is desirable because it is an alternative for the producer compared with traditional production systems. A survey of the practices of production and use of silages in Brazil reveals that corn is still the main crop used for silage, even in areas with low rainfall, such as the Northeast (BERNARDES; RÊGO, 2014). The choice of culture can lead to failure of the production of the silage using an exigent crop, like corn.
The pear millet crop (Pennisetum glaucum
(L.) R. B.) has gained increasing attention in regions with long dry periods and in regions susceptible to drought during the rainy season (NAGAZ et al., 2009). This crop is characterized by its resistance to water stress and maintenance of good production, as it can be used in both direct grazing or as silage (GUIMARÃES JR et al., 2005). The use of pearl millet in a conserved form can be an interesting
alternative in semi-arid regions, such as northeast
Brazil.
Losses during the fermentation process in the silo may be associated with the presence of oxygen, caused by the penetration of air during storage or the
feed-out phase. On the opening the silo, exposure to
air occurs, which stimulates the growth of aerobic microorganisms, oxidizing the fermentation products present in the silage, especially lactic acid (NISHINO; TOUNO, 2005). The presence of oxygen in the silo is dependent on the specific mass of the silage, and this, in turn, is influenced by the particle size of the forages (MUCK; SAVOIE; HOLMES, 2004).
The oxidation of the nutrients present in the dough results in the production of adenosine triphosphate with an elevation of temperature (MCDONALD; HENDERSON; HERON, 1991) and the consequent deterioration of the silage. In addition to temperature, an increase in the pH of the silage is also correlated with the deterioration and consequent DM losses (BORREANI; TABACCO, 2010).
With the aim to preserve nutrients during the fermentation process and reduce DM losses in the
silage in the feed-out phase, studies with bacterial
inoculants have intensified in recent years. Such inoculants are bacteria that stimulate fermentation at the initial stage of ensilage, as bacteria produce lactic
acid, and those that inhibit aerobic deterioration at the time of opening the silo, as bacteria also produce propionic acid (FILYA et al., 2004). Thus, the combined use of these microorganisms could prevent the DM losses in the ensiling.
The study of the dynamics of the losses in silos is important to generate information that enhances the management of the ensiling process, especially in hot regions (KIM; ADESOGAN, 2006). Few studies have been conducted in Brazil to evaluate fermentative losses in silos on a large scale.
The objective of this study was to evaluate the temperature in the layers and depths of the front
profile before and after the surface feed-out phase.
The density and the pH values in silos of pearl millet and corn were determined.
MATERIAL AND METHODS
The trial was conducted at Pólo Regional de
Desenvolvimento dos Agronegócios da Alta Mogiana
-APTA, which is located in the municipality of Colina, São Paulo, at 20º 43 '05 "S and 48º 32' 38" W, at an approximate altitude of 600 meters. According to the Köppen classification, the climate is AW type, which is characterized as a tropical wet and dry climate that is rainy in the summer and dry in the winter season, with the dry season defined to be between the months of April to September and the greatest concentration of rainfall in the months of October to March. In the crop cultivation period, the observed mean values of the precipitation and the maximum and minimum temperature were 226.1 mm, 16.6 ºC and 30.0 °C, respectively. In the
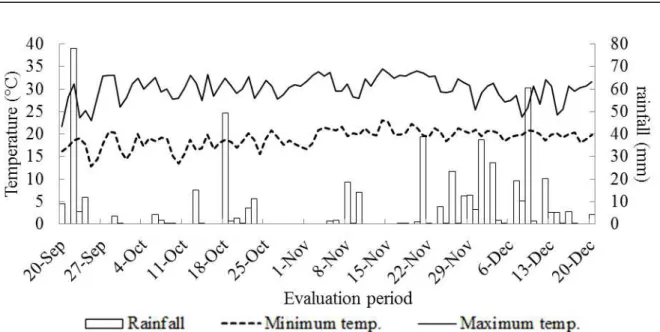
feed-out phase, from September to December 2009,
the maximum ambient temperature and the minimum temperature were probed, as well as the rainfall at the weather station located at the Polo (Figure 1).
Figure 1. The maximum temperature, the minimum temperature and the rainfall (mm) during the evaluation period of the silos panel.
The experimental area received conventional tillage, including plowing and disking. The corn hybrid used was Biomatrix 810, cultivated with 320
kg/ha of the formula 08-28-16 (NPK) at sowing and
80 kg/ha nitrogen in coverage in the form of urea, with a population of plant 61,000 plants/ha. Planting was carried out in December 2008. The cultivar of pearl millet used was ADR 7010, cultivated by fertilizing of the planting at 350 kg/ha of the formula
8-28-16 (NPK) and fertilizing with 100 kg/ha of
urea. Planting was carried out in January 2009. The cultivation was conducted with a spacing of 0.48 m between rows and with 22 plants per linear meter, representing a population of approximately 458,300 plants/ha.
The harvest of the corn and pearl millet were
carried out by forage harvester with a JF 192 Z6®
model. The harvest of pearl millet was performed 80 days after sowing, and the particle sizes were obtained by changing of the gears of the forage harvester to the settings used for cuts of 5 and 20 mm of particle size. As the chopped forage was distributed in the silo during filling, the inoculation of the material in the corresponding silos to silages with the inoculants was performed. The inoculant
used was corn Biomax® (Lallemand Nutrition®) in
the form of a dehydrated powder with an assurance
level of 2 x 10¹⁰ colony forming units (cfu),
consisting of Lactobacillus plantarum and
Propionibacterium acidipropionici.
The inoculant was diluted in water at a ratio of 100 g of the product per 100 liters of water, and two liters of solution per ton were applied evenly to the forage with one sprayer at a capacity of 20 liters,
in order to reach 105 cfu/g forage of each
microorganism, as that is the product manufacturer's recommendations. Five surface silos were made. Each silo had a length of approximately 20 m, a base width of 6 m and a height of 1 m. The compacting of
the silage was done with aid of one tractor with uninterrupted movements.
The corn crop was harvested 95 days after sowing, where it was used with the cutting regulation of 5 mm particles. This silage was not inoculated
during filling. To seal the silo, double-sided
polyethylene plastic film (black and white canvas)
with a thickness of 200 μm was used. In order to
protect and reduce the penetration of oxygen through of the canvas, a hedging of approximately 10 cm of soil and a light layer of straw were used. After four months of being sealed, the silos were opened, and slices of the front profile 15 to 20 cm thick were removed once a day, with the aid of a garden fork. Therefore, the temperature measurements were taken
before and immediately after the feed-out phase.
Samples of the silages were collected during the removals of the slices for bromatological characterization (Table 1). To determine the DM, the
samples were pre-dried in a forced-air oven at 55 °C
for 72 h, weighed and ground in a Wiley mill with a 1 mm sieve. Subsequently, the samples were dried at 105 °C for 16 hours uninterrupted.
In determining the amount of crude protein
(CP), a Dumas nitrogen auto-analyzer was used. The
levels of ash and organic matter (AOAC Official Method 942.05) were measured according to AOAC (1990). The contents of Neutral Detergent Fiber (NDF) and Acid Detergent Fiber (ADF) were
analyzed sequentially (VAN SOEST;
ROBERTSON; LEWIS, 1991), without using
sodium sulfite, but with thermostable α-amylase in
Rev. Caatinga
Licitra; Hernandez; Van Soest (1996). The total carbohydrate content (CHO) measurements were obtained by difference using Equation 1 found in the method of Sniffen; O'Connor; Van Soest (1992), wherein:
Equation 1.
CHO (g kg-1 DM) = 100 (g kg-1)
- (CP (g kg-1)
+ EE (g kg-1) + Ash (g kg-1)).
The levels of non-fiber carbohydrates (NFC)
were calculated according to: Equation 2.
NFC (g kg-1 DM) = 100 (g kg-1)
-
(NDF (g kg-1) + CP (g kg -1) + EE (g kg-1) +
Ash (g kg-1)).
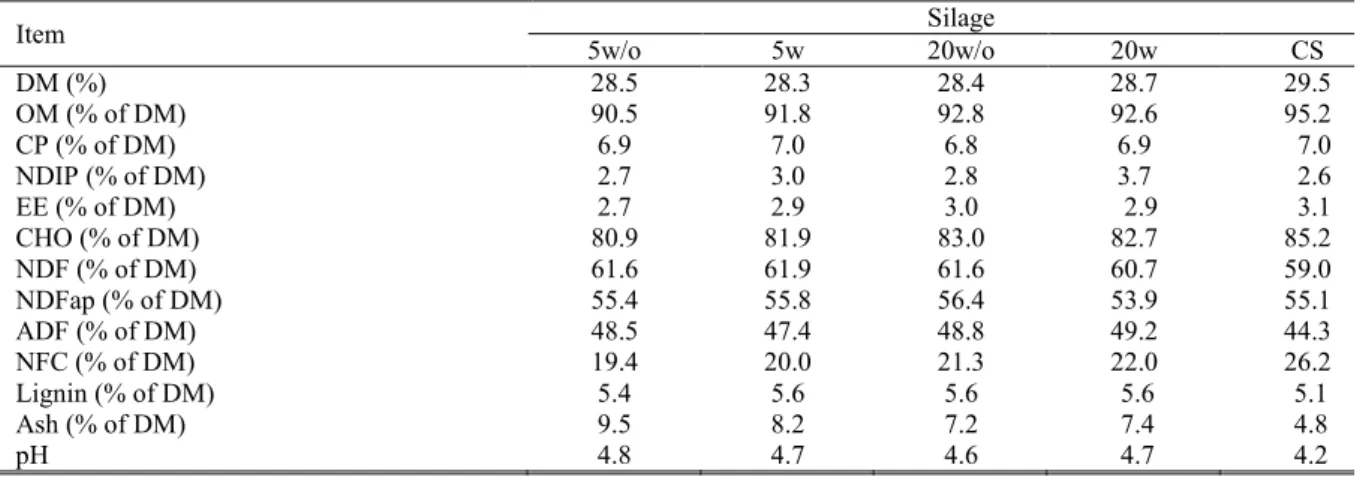
Table 1. The nutritional composition of silages.
DM = dry matter; OM = organic matter; CP = crude protein; NDIP = Neutral detergent insoluble protein; EE = Ether extract; CHO = total carbohydrate content; NDF = neutral detergent fiber; NDFap = NDF corrected for ash and protein; ADF = acid detergent fiber; NFC = non-fiber carbohydrates; pH = potential hydrogen; 5w/o = Pearl millet silage with a
particle size of 5 mm without bacterial inoculant; 5w= Pearl millet silage with a particle size of 5 mm with bacterial inoculant; 20w/o = Pearl millet silage with a particle size of 20 mm without bacterial inoculant; 20w = Pearl millet silage with a particle size of 20 mm with bacterial inoculant; CS = corn silage.
The evaluations of the temperatures and gradients were made in the five silos at three levels (top, middle and bottom) and three depths (10, 30 and 50 cm) in the silo's frontal profile. They were distributed in a completely randomized design, arranged in a factorial of 5 × 3 × 3 with 18 repetitions. The measurements were always taken in
the morning before and after the feed-out phase
using a digital thermometer (Gulterm 180®). While
the temperatures of the silages were observed with one thermometer, another thermometer was used to measure the temperature in the room. The temperature data obtained from the silages were tabulated in an Excel® spreadsheet (Microsoft Corporation, Washington, USA), and subsequently, the data were used to produce images with a
calorimetric scale using Surfer® 10 program (2011).
The pH values were measured in composite samples from the upper and lower layers of each profile and obtained before and after the feedout phase in the five silos and distributed in a completely randomized design arranged in a factorial of 5 x 2 with 18 repetitions. This quantification was performed with the analysis of 25 grams of fresh silage placed in a beaker with 100 mL of distilled water. After two hours at rest, the material was homogenized with a glass rod, and, subsequently, the pH was measured using a potentiometer (BOLSEN et al., 1992).
The densities of the silages expressed in FM and DM were measured with the aid of an iron cube
with a known volume (0.25 m3). These
measurements were performed in the five silos. The samples were collected along the silo’s length and in the profile’s middle layer. A completely randomized design with three replications per silo was used. To determine the density, the cube was inserted into the silo profile. After removing the collected material, it was weighed, and the DM content was determined using the same methodology used to determine the DM of the silage described above. Then, the density of the silage was calculated.
The variables in each silo were analyzed separately in their designs as described above. The data were submitted to an analysis of variance, and the treatments’ means were compared using Tukey’s test at a probability of 5% using the MIXED
procedure of the SAS® statistical software, version
8.2 for Windows (SAS, 2003).
RESULTS AND DISCUSSION
An interaction was found (P <0.05) between the silage × stratum profile and the silage × depth
profile for the temperatures before the feed-out phase
(Table 2). Considering the profile stratum temperatures, it was observed that in the lower stratum were lower (P <0.05) in all silos when compared to other strata, with no difference in the temperatures among the silages in this stratum. This
Item Silage
5w/o 5w 20w/o 20w CS
DM (%) 28.5 28.3 28.4 28.7 29.5
OM (% of DM) 90.5 91.8 92.8 92.6 95.2
CP (% of DM) 6.9 7.0 6.8 6.9 7.0
NDIP (% of DM) 2.7 3.0 2.8 3.7 2.6
EE (% of DM) 2.7 2.9 3.0 2.9 3.1
CHO (% of DM) 80.9 81.9 83.0 82.7 85.2
NDF (% of DM) 61.6 61.9 61.6 60.7 59.0
NDFap (% of DM) 55.4 55.8 56.4 53.9 55.1
ADF (% of DM) 48.5 47.4 48.8 49.2 44.3
NFC (% of DM) 19.4 20.0 21.3 22.0 26.2
Lignin (% of DM) 5.4 5.6 5.6 5.6 5.1
Ash (% of DM) 9.5 8.2 7.2 7.4 4.8
is probably because the region had a smaller share of aerobic microorganisms caused by greater mass compression efficiency (NEUMANN et al., 2007) and the resulting pressure of the upper layers, which hinders the penetration of oxygen at the time of the
feed-out phase in the silo.
Silages that were cut to a 5 mm and 20 mm particle size had a higher temperature (P <0.05) in the medial layer of the silo. The pearl millet silages had lower temperatures in the upper stratum compared to the corn silage. Temperature is a physical factor that affects the rate of deterioration of silages because the increase is directly related to the oxidation of dry matter (HILL; LEAVER, 2002). When the aerobic spoilage process is established
because of the availability of oxygen, microorganisms, particularly yeast and fungi,
proliferate and metabolize sugars, lactic acid, CO2,
other acids, water and ATP (MCDONALD;
HENDERSON; HERON, 1991; ROOKE;
HATFIELD, 2003). Therefore, it is likely that in the case of pearl millet silage with 20 mm particles in the middle portion of the layer, the oxygen concentration was higher, causing the spoiling of yeasts. Consequently, the temperature was elevated. In the corn silage, it is likely that the highest concentration of CNF (26.2%) was used as a substrate by aerobic microorganisms that cause an increase in the production of heat in the upper regions.
Table 2. The average temperature (°C) before and after the front profile feed-out phase of pearl millet silage and corn silage
in the silos.
5w/o = Pearl millet silage with a particle size of 5 mm without bacterial inoculant; 5w= Pearl millet silage with a particle size of 5 mm with bacterial inoculant; 20w/o = Pearl millet silage with a particle size of 20 mm without bacterial inoculant; 20w = Pearl millet silage with a particle size of 20 mm with bacterial inoculant; CS = corn silage. The means indicated by the same letter (uppercase and lowercase in the column on the line) do not differ by Tukey test with α=5%;
1CV(%) = 9.2. 2CV(%) = 6.9.
There was significant difference (P <0.05) in the temperature of the silos related to the panel
depths before the feed-out phase of the silos. There
was no variation (P> 0.05) in the temperature profile depth in the inoculated silages. Silage millet with a 20 mm particle size and without inoculant had a lower (P <0.05) temperature at a depth of 50 cm. The uninoculated silage millet with a 5 mm particle size showed lower temperatures at depths of 10 and 50 cm. The corn silage had lower temperatures at depths of 10 cm.
There was an interaction (P <0.05) among the silage × stratum panel and the silage × depth profile
for the silo panel temperature after the feed-out
phase of silos (Table 2). Considering the temperatures of all the strata of the silo profile after
the feed-out phase, the pearl millet silage with a 5
mm particle size without inoculant had lower (P <0.05) temperatures compared to the other silages. Silages of pearl millet with a 20 mm particle size, both uninoculated and inoculated had higher (P <0.05) temperatures in the middle stratum after
the feed-out phase. Corn silage had the highest
(P <0.05) temperatures after the feed-out phase in the
upper panel area. This silage also had the lowest pH (4.2) compared to the pearl millet silage, which shows higher acidity, most likely because it had the highest concentration of lactic acid. Weinberg et al.
(1993) hypothesized that high levels of water-soluble
carbohydrates, combined with high levels of lactic acid, are associated with aerobic deterioration. This is justified because lactic acid and soluble
Silage
Average
5w/o 5w 20w/o 20w CS
Temperature before the feed-out phase 1 Stratum
Higher 38.3bA 38.0bB 39.1bB 38.9bB 43.3aA 39.5
Middle 38.6bA 39.7bA 42.0aA 42.6aA 38.6bB 40.3
Below 34.6aB 35.4aC 35.9aC 36.1aC 35.0aC 35.4
Depth
10 37.6bAB 37.8abA 39.5aA 38.9abA 37.5bB 38.3
30 38.0bA 38.3abA 39.7abA 40.1aA 39.5abA 39.1
50 36.1cB 36.9bcA 37.8bcB 38.6abA 39.9aA 37.9
Average 37.2 37.7 39.0 39.2 40.0
Temperature after feed-out phase2 Stratum
Higher 37.2cA 40.3bA 38.5cB 37.7cB 44.4aA 39.6
Middle 35.3dB 39.6bcA 40.4abA 41.6aA 38.6cB 39.1
Below 31.9bC 34.4aB 34.2aC 34.4aC 34.1aC 33.8
Depth
10 36.3bA 39.4aA 39.0aA 39.3aA 38.7aA 38.6
30 35.0bB 38.3aA 38.1aA 38.1aB 39.4aA 37.8
50 33.2cC 36.5bB 36.0bB 36.3bC 38.9aA 36.2
Rev. Caatinga
carbohydrates are substrates for aerobic
microorganisms. As for this stratum, it can be
observed that the temperature after the feed-out
phase, as before, was lower (P <0.05) in the lower portion of the panel than the upper and independent of the silage median.
The panel temperature after the silo feed-out
phase was influenced (P <0.05) by the depth of the silo panel (Table 2). It was observed in all millet silages with particles of 5 mm without bacterial inoculant and millet silage with inoculant and particles up to 20 mm, that the temperature after the
feed-out phase decreased (P <0.05) with increasing
profile depth. This can be explained by the evolution of the action of aerobic microorganisms throughout
the depth of the panel. Thus, in the deepest side of the profile, it is likely that oxygen has not penetrated far enough to enable these microorganisms. The withdrawal rate associated with the silage density determines the time at which the silage will be exposed to air prior to its removal from storage, so that larger quantities withdrawn allow lower oxygen exposure time. Thus, it is likely that the thickness of the removed silage larger slice daily helps avoid increasing losses in the silage utilization (WILKINSON; DAVIES, 2013). The silo silage millet without inoculant with a 5 mm particle size showed lower (P <0.05) temperatures after the
feed-out phase, regardless of the depth of the panel.
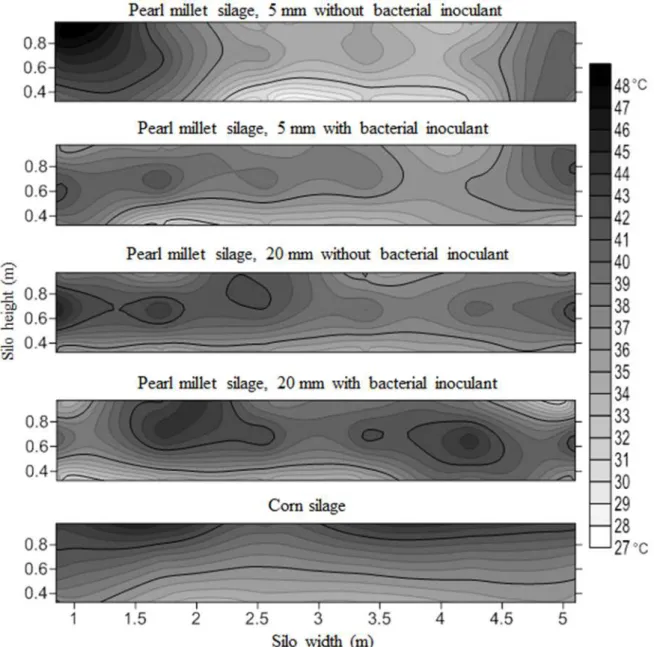
Figure 2. The thermography (° C) profile of pearl millet silage and corn before the feed-out phase of the silos.
It may be noted that in the thermography of the panels of the silo (Figure 2 and 3) the silo pearl millet silage with particles of 5 mm without bacterial
Figure 3. The thermography (° C) profiles of pearl millet silage and corn silage after the feed-out phase of surface silos.
Observing the thermography profiles of other silos, the predominance of lighter grays in the lower stratum was obvious. In relation to the darker areas of the thermography profiles, it was observed that they are predominantly located on the sides and the upper extremity of the silo, which is probably due to the compression inefficiency in the filling silo
(Figure 4 and 5). It is observed even in the thermography profiles of Figures 4 and 5 that the
pearl millet silage of a 5 mm particle size with inoculant is more clearly represented.
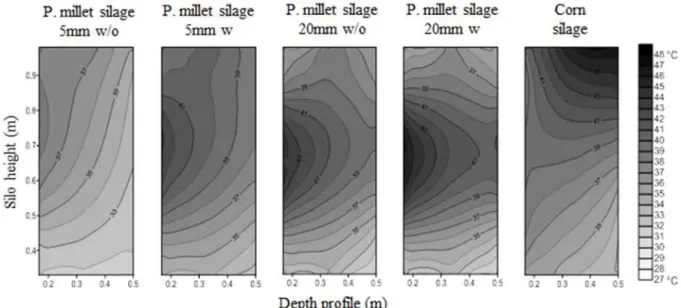
In thermography panels viewed laterally from a depth of 0 to 50 cm, it was observed that the pearl millet silos with 20 mm particles showed browning at the end, close to 10 cm in the middle layer of the
panel, both before and after the feed-out phase
(Figures 4 and 5). In the silo containing corn silage, this browning was observed in the upper layers of the
panel at a depth of 50 cm. This probably represents the advancement of deterioration by aerobic microorganisms. Moreover, it is likely that the less dark regions at depths less than 50 cm went through the process of deterioration, making them more stable. If we compare the thermography profile before and after the removal, there is slight whitening in the thermography profile after the removal, probably due to the shorter exposure time of these panels deterioration.
When analyzing the gradient between the temperature of the middle portion of the silos before
the feed-out phase and room temperature, it is
Rev. Caatinga
Figure 4. The thermography (°C) depth profile of the pearl millet silage and the corn silage before the feed-out phase of
the silos.
Figura 5.The thermography (°C) depth profiles of pearl millet silage and corn silage after the feed-out phase of the silos.
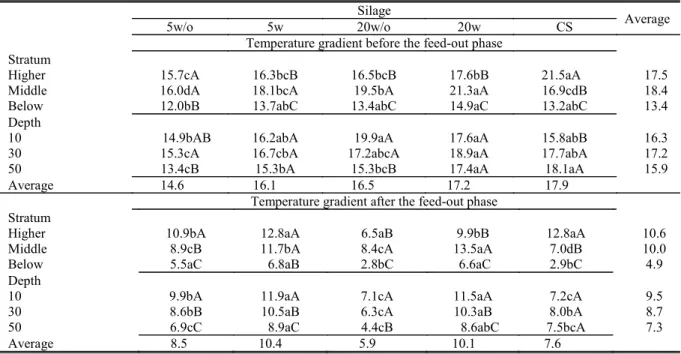
The lower layer of the panel of all silos had the lowest (P<0.05) temperature gradient compared to the other strata. In this case, it is noteworthy that the dissipation of heat generated by microbial activity may have been higher in the upper layer because of its lower compression and proximity to the plastic film. According Bolsen et al. (1993), the silage temperature is determined by the balance between the heat generated by microbial activity and heat losses by conduction, radiation, convection and evaporation. Without exception, all the silos had the lowest temperature gradient in the lower stratum of the panel. Considering the depth of the panel before
the feed-out phase, no variation was observed in the
temperature gradient of the silage with 5 or 20 mm particle size that was inoculated.
It was observed that the temperature gradient
after the feed-out phase was lower than the gradient
before the removal (Table 3). The temperature
gradient after the feed-out phase was lower (P <0.05)
in the silage with particles of 20 mm without bacterial inoculant at a depth of 10 and 30 cm. The
temperature gradient after the feed-out phase was
lower (P <0.05) at a depth of 50 cm depth in pearl millet silage. The depth in the corn silo panel did not (P> 0.05) alter the temperature gradient for corn silage. Neumann et al. (2007) evaluated corn silage and observed a smaller temperature gradient (5.9 °C) in the lower stratum in the silos, compared to the higher strata (8.2 °C). Similarly, the temperature
after the feed-out phase, the temperature gradient
The depth in the corn silo panel did not (P> 0.05) modify the temperature gradient in that silage.
There were no differences (P> 0.05) in the density of the NM or the density of the DM in the studied silages (Table 4). It was expected that the
silos containing smaller particle size will present higher densities because of the lower porosity of the mass, hence the greater accommodation of particles
(D'AMOURS; SAVOIE, 2005; SAVOIE;
D'AMOURS, 2008).
Table 3. The average temperature gradient (°C) compared to the ambient temperature (°C) before and after the feed-out
phase of silos of pearl millet silage and corn silage.
5w/o = Pearl millet silage with a particle size of 5 mm without bacterial inoculant; 5w= Pearl millet silage with a particle size of 5 mm with bacterial inoculant; 20w/o = Pearl millet silage with a particle size of 20 mm without bacterial inoculant; 20w = Pearl millet silage with a particle size of 20 mm with bacterial inoculant; CS = corn silage. Means followed by the same letter (uppercase and lowercase in the column on the line) are not different according to Tukey’s test with α=5%. CV (%) = 11.34.
Table 4. The average density of the Fresh Material (FM) and Dry Matter (DM).
DBNM = Density Based on Natural Matter; DBDM = Density Based on Dry Matter; 5w/o = Pearl millet silage with a particle size of 5 mm without bacterial inoculant; 5w= Pearl millet silage with a particle size of 5 mm with bacterial inoculant; 20w/o = Pearl millet silage with a particle size of 20 mm without bacterial inoculant; 20w = Pearl millet silage with a particle size of 20 mm with bacterial inoculant; CS = corn silage; CV = coefficient of variation; P = probability. Means followed by the same letter do not differ according to Tukey’s test with α=5%.
The pH values of the silages before the
feed-out phase were higher (P <0.05) in the upper
layer than in the lower stratum in all pearl millet silages, but not in the corn silage (Figure 6). These higher pH values in the upper stratum of the silo may have been determined by the greater temperature gradient in that stratum (Table 3). Neumann et al. (2007) evaluated corn silage and also observed higher pH values in the upper portion of the profile compared to the lower portion.
The pH value in the upper stratum of the
profile before the feed-out phase was lower in corn
silage compared to other silages. The pH values of the lower portion of the profile were higher for the silage with particles of 20 mm without inoculation, but the other silages did not differ. Senger et al. (2005) found that the pH of corn silage is influenced by the level of compaction of the silage and has a higher compression value in poor conditions
(300 kg/m3 NM).
Silage
Average
5w/o 5w 20w/o 20w CS
Temperature gradient before the feed-out phase Stratum
Higher 15.7cA 16.3bcB 16.5bcB 17.6bB 21.5aA 17.5
Middle 16.0dA 18.1bcA 19.5bA 21.3aA 16.9cdB 18.4
Below 12.0bB 13.7abC 13.4abC 14.9aC 13.2abC 13.4
Depth
10 14.9bAB 16.2abA 19.9aA 17.6aA 15.8abB 16.3
30 15.3cA 16.7cbA 17.2abcA 18.9aA 17.7abA 17.2
50 13.4cB 15.3bA 15.3bcB 17.4aA 18.1aA 15.9
Average 14.6 16.1 16.5 17.2 17.9
Temperature gradient after the feed-out phase Stratum
Higher 10.9bA 12.8aA 6.5aB 9.9bB 12.8aA 10.6
Middle 8.9cB 11.7bA 8.4cA 13.5aA 7.0dB 10.0
Below 5.5aC 6.8aB 2.8bC 6.6aC 2.9bC 4.9
Depth
10 9.9bA 11.9aA 7.1cA 11.5aA 7.2cA 9.5
30 8.6bB 10.5aB 6.3cA 10.3aB 8.0bA 8.7
50 6.9cC 8.9aC 4.4cB 8.6abC 7.5bcA 7.3
Average 8.5 10.4 5.9 10.1 7.6
Silage
CV(%) P
5w/o 5w 20w/o 20w CS
DBNM (kg/m3) 705.4 604.1 584.1 533.5 613.0 11.9 0.156
Rev. Caatinga
Just like before the feed-out phase, the pH
values after the feed-out phase were higher (P <0.05)
in the upper layer than in the lower stratum in all pearl millet silages with the exception of corn silage, which did not differ (Figure 7). The pH of the upper
portion after the feed-out phase was higher (P <0.05)
in pearl millet silages with particle sizes of 5 mm to 20 mm both with and without inoculation. The corn silage had lower (P <0.05) pH values in this portion. However, the lower layers were not (p> 0.05) different among the studied silages.
Figure 7. The pH values of silos panels after feed-out phase of the silage.
5w/o= Pearl millet silage with a particle size of 5 mm without bacterial inoculant; 5w= Pearl millet silage with a particle size of 5 mm with bacterial inoculant; 20w/o = Pearl millet silage with a particle size of 20 mm without bacterial inoculant; 20w = Pearl millet silage with a particle size of 20 mm with bacterial inoculant; CS = corn silage. The means indicated by the same letter (uppercase and lowercase in the upright on the horizontal) do not differ by Tukey test with α=5%.
Although the densities of the NM and DM were not different (P> 0.05) between the silages, the
temperature before and after the feed-out phase
varied inside the silo in the different strata. According Borreani and Tobacco (2010), increases in the temperature profile in the silo and changes in the pH are clearly linked to aerobic microbial activity (especially mold growth). These authors emphasize that this method could be useful in detecting the process of aerobic deterioration in the early stages and properly quantifying the extent of the areas that deteriorated that need to be discarded,
thus improving silage management.
CONCLUSION
Silages with 5 mm particle size provided lower temperatures in the middle portion of the panel
before the feed-out phase. The use of bacterial
inoculants in this study did not change the characteristics evaluated.
The temperature before and after the
feed-out phase of the silos as well as the temperature
Figure 6. The pH values of silo panels before feed-out phase of the silage.
gradient between the environment and the pearl millet silage and corn silage in the silos are smaller in the lower layer profile. Pearl millet silages had lower pH values in the lower stratum of the silo.
REFERENCES
Association of Official Analytical Chemists –
AOAC. Official methods of analysis of the
Association of Official Analytical Chemists. 15. ed. Arlington, Virginia, 1990. 1230 p.
BERNARDES, T. F.; RÊGO, A. C. Study on the practices of silage production and utilization on
Brazilian dairy farms. Journal of Dairy Science,
Champaign, v. 97, n. 3, p. 1852 – 1861, 2014.
BOLSEN, K. K. et al. Rate and extent of top
spoilage losses in horizontal silos. Journal of Dairy
Science, Champaign, v. 76, n. 10, p. 2940-2962,
1993.
BOLSEN, K. K. et al. Effect of silage additives on the microbial succession and fermentation process of
alfalfa and corn silages. Journal of Dairy Science,
Champaign, v. 75. n. 11. p. 3066-3083, 1992.
BORREANI, G.; TABACCO, E. The relationship of silage temperature with the microbiological status of
the face of corn silage bunker. Journal of Dairy
Science, Champaign, v. 93, n. 6, p. 2620-2629, 2010.
D’AMOURS, L.D.; SAVOIE, P. Density profile of
corn silage in bunker silos. Canadian Biosystems
Engineering, Manitoba, v. 47, n. 1, p. 221-228,
2005.
FERERES, E., SORIANO, M. A. Deficit irrigation for reducing agricultural water use: Integrated approaches to sustain and improve plant production
under drought stress special issue. Journal of
Experimental Botany, Oxford, v. 58, n. 2, p.
147-159, 2007.
FILYA, I., et al. The effect of Propionibacterium
acidipropionici, with or without Lactobacillus
plantarum, on the fermentation and aerobic stability
of wheat, sorghum and maize silages. Journal of
Applied Microbiology, Oxford, v. 97, n. 4, p.
818-826, 2004.
GUIMARÃES JÚNIOR, R. I. et al. Matéria seca, proteína bruta, nitrogênio amoniacal e pH das
silagens de três genótipos de milheto (Pennisetum
glaucum (L). R. Br.) em diferentes períodos de
fermentação. Revista Brasileira de Milho e Sorgo,
Sete Lagoas, v. 4, n. 2, p. 251-258, 2005.
HILL, J.; LEAVER, J. D. Changes in chemical
composition and nutritive value of urea treated
whole crop wheat during exposure to air. Animal
Feed Science and Technology, Amsterdam, v. 102,
n. 1, p. 181- 195, 2002.
KIM, S. C.; ADESOGAN, A. T. Influence of ensiling temperature, simulated rainfall, and delayed sealing on fermentation characteristics and aerobic
stability of corn silage. Journal of Dairy Science,
Champaign, v. 89, n. 8, p. 3122-3132, 2006.
LICITRA, G.; HERNANDEZ, T. M.; VAN SOEST, P. J. Standardization of procedures for nitrogen
fractionation of ruminant feeds. Animal Feed
Science and Technology, Amsterdam, v. 57, n. 4, p.
347-358, 1996.
McDONALD, P.; HENDERSON, A. R.; HERON, S.
The biochemistry of silage. 2.ed. Marlow: Chalcombe, 1991. 340 p.
MUCK, R. P.; SAVOIE, P.; HOLMES, B. J. Laboratory assessment of bunker silo density, part I:
Alfalfa and grass. Applied Engineering in
Agriculture, Saint Joseph, v. 20, n. 2, p. 157-164,
2004.
NAGAZ, K. et al. Yield and water-wse efficiency of
pearl millet (Pennisetum glaucum (L.) R. Br.) under
deficit irrigation with saline water in arid conditions
of southern Tunisia. Research Journal of
Agronomy, Islamabad, v. 3, n. 1, p. 9-17, 2009.
NEUMANN, M. et al. Efeito do tamanho de partícula e da altura de corte de plantas de milho na dinâmica do processo fermentativo da silagem e no
período de desensilagem. Revista Brasileira de
Zootecnia, Viçosa, v. 36, n. 5, p. 1603-1613, 2007.
NISHINO, N., TOUNO, E. Ensiling characteristics
and aerobic stability of direct-cut and wilted grass
silages inoculated with Lactobacillus casei or
Lactobacillus buchneri. Journal of the Science of
Food and Agriculture, Great Britain, v. 85, n. 11, p.
1882-1888, 2005.
ROOKE, J. A.; HATFIELD, R. D. Biochemistry of ensiling. In: BUXTON, D. R.; MUCK, R. E.;
HARRISON, J. H. (Eds.). Silage Science and
Technology. Madison: American Society of Agronomy, 2003. v. 1, cap. 3, p. 95–139.
SAVOIE, P., D’AMOURS, L. D. Density profile of
herbage silage in bunker silos. Canadian
Biosystems Engineering, Manitoba, v. 50, n. 3, p.
357-365, 2008.
Rev. Caatinga
Ciência Rural, Santa Maria, v. 35, n. 6, p.
1393-1399, 2005.
SNIFFEN, C. J.; O'CONNOR, J. D.; VAN SOEST, P. S. A net carbohydrate and protein availability.
Journal of Animal Science, Champaign, v. 70, n.
11, p. 3562-3577, 1992.
STATISTICAL ANALYSIS SYSTEMS
INSTITUTE. SAS system for Microsoft Windows,
version 8.2. Cary, 2003. 554 p
SURFER 10. User.s Guide/Contouring and 3D
Surface Mapping for Scientists and Engineers. Golden Software, Inc., 2011.
VAN SOEST, P. J.; ROBERTSON, J. B.; LEWIS, B. A. Methods for dietary fiber, neutral detergente fiber and monstarch polysacharides in relation to
animal nutrition. Journal Dairy Science,
Champaign, v. 74, n. 10, p. 3586 – 3597, 1991.
WEINBERG, Z. G. et al. The effect of applying lactic acid bacteria at ensiling on the aerobic
stability of silages. Journal of Applied
Microbiology, Oxford, v. 75, n. 6, p. 512–518, 1993.
WILKINSON, J. M., DAVIES, D. R. The aerobic
stability of silage: key findings and recent
developments. Grass and Forage Science, Oxford,