Recebido para publicação em 14/7/2009 Aceito para publicação em 31/10/2009 (004312)
1 Departamento de Ciência dos Alimentos, Universidade Federal de Lavras – UFLA, Campus Universitário, CP 3037, CEP 37200-000, Lavras - MG, Brasil, E-mail: [email protected]
2 Pró-Reitoria de Pesquisa, Núcleo de Inovação Tecnológica – NINTEC, Universidade Federal de Lavras – UFLA, Campus Universitário, CP 3037, CEP 37200-000, Lavras - MG, Brasil
*A quem a correspondência deve ser enviada
Microstructural changes of frozen strawberries submitted
to pre-treatments with additives and vacuum impregnation
Mudanças microestruturais de morangos congelados submetidos à
pré-tratamentos com aditivos e impregnação a vácuo
Marciu José RENO1, Mônica Elisabeth Torres PRADO2, Jaime Vilela de RESENDE1*
1 Introduction
In Brazil, most of the food production is seasonal, mainly those of vegetable origin, and the development of essential methods to prolong the storage period is made necessary. Brazil is one of the largest producers in several fruits markets and a large variety of these items is market notable. Frozen strawberries have been receiving special attention in recent years, mainly in the south area of the State of Minas Gerais, which is characterized as a large producer, with fruit having an important role in the regional economy and in the family income of small producers.
Freezing is one of the most successful methods for the long term preservation of the natural quality attributes of perishable
foods. However, the ice crystals that are formed can also cause considerable loss through exudation, with texture, color and organoleptic modifications after thawing. Consequently, the size and shape of these ice crystals are critical to the final quality of the frozen product (FERNÁNDEZ; OTERO; GUIGNON, 2006). The growth of ice crystals occur after nucleation, when the water molecules are added to the already formed nuclei. One of the main factors that determine their growth rate is the system’s heat removal rate. It is known that slow freezing enhances the formation of large extracellular ice crystals, which cause mechanical damage to foods and particularly to the vegetable tissues (FERNÁNDEZ; OTERO; GUIGNON, 2006).
Resumo
Morangos foram submetidos a congelamento após pré-tratamentos com pectina e cloreto de cálcio com diferentes concentrações na tentativa de estabelecer correlações dos efeitos destas substâncias e do processamento sobre as características físicas e microestruturais das frutas descongeladas. Metades de morangos foram submetidas à impregnação com pressão de vácuo controlada de 84,4, 50,5 e 16,6 kPa constituídos de pectina em concentrações de 0, 1,5, e 3% , adicionados de cloreto de cálcio em concentrações de 0, 3, e 6% e glicose 20%, durante 4 horas. Foram feitas medidas do teor de sólidos solúveis totais, perdas de fluido celular, textura e viscosidade da solução antes e após o congelamento/descongelamento. Foram feitas imagens de cortes dos tecidos durante o congelamento em função do tempo em microscópio ótico acoplado a um sistema cold-stage e temperatura controlada em que a redução da área celular foi quantificada utilizando um software analisador de imagens. A concentração de pectina teve influência e demonstrou potencial para a proteção do tecido de amostras congeladas. As fotomicrografias mostraram que a perda de fluido celular ocorre durante o crescimento de gelo formado nos espaços intercelulares, sendo retardada em tratamentos com altas concentrações de pectina.
Palavras-chave: microestrutura; perda de fluido celular; pectina.
Abstract
Strawberries were submitted to freezing after pre-treatments with hydrocolloid and calcium salts (pectin and calcium chloride) at different concentrations, in the attempt to establish a correlation of the effects of these substances and their processing, on the physical and microstructural characteristics of fruits after thawing. Strawberry halves were submitted to impregnation with controlled vacuum pressure of 84.4, 50.5 and 16.6 kPa; comprising pectin at concentrations of 0, 1.5 and 3%; with the addition of calcium chloride at concentrations of 0, 3 and 6%; and glucose at 20%, for 4 hours. Measurements were made of the total soluble solid contents, cellular fluid loss, texture and viscosity of the solution, before and after the freezing/thawing. Images of the tissue cuts during the freezing, in function of time, were taken in an optic microscope coupled to a cold-stage and controlled temperature system, where the reduction of the cellular area was quantified using an image analyzing software. The pectin concentration had an influence on and demonstrated a potential for protection of the frozen tissue samples. The photomicrographs showed that the loss of cellular fluid occurs during the growth of ice formed in the intercellular spaces and it is retarded through treatments with high pectin concentrations.
Keywords: microstructure; cellular fluid loss; pectin.
The present work aims to analyze the main effects of the physical and physiochemical alterations resulting from the vacuum impregnation process on the preservation of the texture and microstructure of strawberry fruits after freezing/thawing; to analyze the alterations in viscosity of the original solution and to correlate these results to the flow of components observed in each of those processes; to evaluate the quality indicative parameters of total soluble solids (TSS), loss of cellular fluid (LCF), texture and microstructure, and to specify, among the tested treatments, which ones are more effective in the maintenance of the original characteristics of the fruits; and to evaluate the ice crystal growth behavior during freezing.
2 Materials and methods
2.1 Sample preparation
Pieces of strawberries were obtained from the symmetrical division along the central axis of fresh strawberries acquired from a local market. They were submitted to impregnation utilizing controlled vacuum pressures of 84.4 (844 mbar), 50.5 (505 mbar) and 16.6 kPa (166 mbar) with three types of solutions made up of pectin at concentrations of 0, 1.5 and 3%, with the addition of calcium chloride at concentrations of 0, 3 and 6% and glucose 20% during a 4-hour period.
2.2 Total soluble solids (TSS)
The total soluble solid content was evaluated for the fruit in natura and for the thawed fruit by direct reading in a digital refractometer (ATAGO - PR100), using strawberry juice obtained after the filtration of the pulp. Equation 1 was used for the determination of TSS loss or gain percentage (°Brix).
100 (%) thwd nat nat TSS TSS TSS TSS −
= × (1)
2.3 Texture
The determination of the texture for the strawberry fruit in natura and for the thawed fruit was done through uniaxial compression tests using universal test equipment (TA.XT2 Texture Analyser, Stable Micro Systems). The needle probe (puncture test) was used in the tests, with a penetration speed of 5.00 mm/second, and a 5 mm fruit penetration depth. The average values of the maximum force MAXF (N) readings for the penetration resistance were applied in Equation 2, used to analyze the texture variation percentage after thawing.
100 (%) thwd nat nat MAXF MAXF TEXTURE MAXF −
= × (2)
2.4 Loss of cellular fluid (LCF)
The weight increase or reduction of the processed strawberry pieces was evaluated through mass weighing before and after freezing. Equation 3 was used for the determination of the loss of cellular fluid percentage (LCF):
100 (%) thwd nat nat m m LCF m −
= × (3)
Microscopy is being used to study the influences of processing conditions and ingredients on food structure (FLINT, 1994). Optical and electronic microscopy is frequently used to detect microstructural changes during ripening (LUZA et al., 1992), storage (ALLAN-WOJTAS et al., 2001), refrigerated storage, pre-treatment (SOUSA et al., 2005), drying (LEWICKI; PAWLAK, 2003) and freezing (DELGADO; RUBIOLO, 2005) of plant tissue (VAN BUGGENHOUT et al., 2008)
The use of sugar solutions, hydrocolloids, calcium and sodium salts, and associations and mixtures involving these products, have been the indicated substances treatments that increase cellular structure resistance to freezing. A large part of these compounds act by interacting with the cell wall components, reducing the ice crystal growth and maintaining the integrity of the microstructure after thawing (RESENDE; CAL-VIDAL, 2002). According to Sousa et al. (2007), the calcium influence on the texture of vegetables is due to the formation of calcium bridges among galacturonic acids. McFeeters and Armstrong (1984) suggested that the calcium effect on the texture was a result of the bonding of the calcium to the pectic group of carboxyl radicals.
the pectin and calcium chloride concentrations and vacuum pressure, were appraised through the estimate of the regression coefficients, variance analysis and response surfaces; all analyses were obtained using Minitab14 software.
3 Results and discussion
3.1 Total soluble solids (TSS)
Table 2 shows the results of the TSS content percentile variation regression analysis after fruit treatment by vacuum impregnation and thawing. The influence of pectin concentration can be verified in the regression, its coefficient is significant at the level of 95%. R2 (96.1%) of the regression evidences the good
adjustment. The determination coefficient (R2) measures the
proportion of the variation that is explained by the independent variable in the regression model, in other words, 96.1% of TSS variation can be explained by the variability of the data. The regression model used for this parameter is presented in Equation 6 and Table 2. The same procedure was used for all parameters in this work.
2
1 2 3 1
1 2 1 3 2 3
1.9191 32.0989X 0.5993X 0.4256X – 2.9136X 0.5463X X 0.1398X X 0.0105X X
y= + + + +
+ − + (6)
The pressure did not have an influence on the preservation of the TSS content after the freezing/thawing. The increase of pectin concentration in the solution, which consequently causes a viscosity increase, increases the TSS content.
2.5 Solution viscosity
The determination of the solution viscosity was performed for the original solution, before the pre-treatment and after the freezing/thawing, through readings in a viscosimeter (Brookfield - mod. RVT) with Spindle #1 and 100 rpm velocity. The Equation 4 was used for the determination of the viscosity variation (cP): 100 (%) thwd orig orig VISC VISC VISCOSITY VISC −
= × (4)
2.6 Static air freezing
Polyethylene bags containing the previously treated strawberries were frozen in a domestic freezer (Metalfrio) with an internal temperature of -18 ± 2 °C. The temperature history and the cooling rate were obtained by reading thermocouples type T (copper-constantan) inserted in the geometric center of strawberry pieces and connected to a system of signal conditioning (National Instruments - Model SCXI). The temperature measurements were collected at intervals of 1 minute using LabVIEW 8.5 software.
2.7 Microstructural analysis
The microstructure studies of the pre-treated strawberry tissue cuts were made through the visualization of the samples during the freezing by photonic microscopy in a (MEIJI, ML 5000) microscope utilizing a controlled temperature Peltier cold-stage system coupled to a video capturing system. The static images were obtained at intervals of 1 second after the beginning of ice crystal formation in the tissues. The tissues were stained with safranin and 0.1% acetic acid to enhance and facilitate the cell wall visualization. The samples were frozen at a rate of 0.4 °C/minute.
2.8 Cell shrinkage
Cell shrinkage was determined by an image analyzing program (SIGMA SCAN PRO5), using a millimeter slide as reference. The area (µm2) delimited by the cellular wall was
analyzed in relation to the time, and the reduction percentage of the fruit cell during the freezing period was determined by Equation 5. 100 (%) time orig orig AREA AREA AREA AREA −
= × (5)
The reduction percentage of the area was analyzed at 4 different times corresponding to 0, 1, 2 and 3 minutes after the beginning of ice crystal formation in the tissues.
2.9 Experimental design
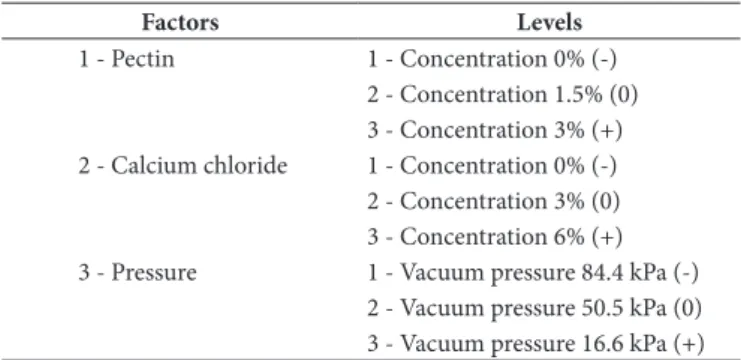
Table 1 presents the factors and levels involved in the processing, following the experimental design structures. The experimental design was 23 with three repetitions in the central
point.
The effect of the factors on the behavior of the TSS content and LCF, texture, viscosity and area reduction, in function of
Table 1. Factors and levels involved in the experiment.
Factors Levels
1 - Pectin 1 - Concentration 0% (-) 2 - Concentration 1.5% (0) 3 - Concentration 3% (+) 2 - Calcium chloride 1 - Concentration 0% (-) 2 - Concentration 3% (0) 3 - Concentration 6% (+) 3 - Pressure 1 - Vacuum pressure 84.4 kPa (-)
2 - Vacuum pressure 50.5 kPa (0) 3 - Vacuum pressure 16.6 kPa (+)
Table 2. Estimate of the regression coefficients for the TSS content
variation.
Term Coefficient p
Constant 1.9191 0.877
Pectin (X1) 32.0989 0.050**
Calcium (X2) 0.5993 0.819
Pressure (X3) 0.4256 0.097
Pectin*Pectin (X1)2 -2.9136 0.399
Pectin*Calcium (X1).(X2) 0.5463 0.532 Pectin*Pressure (X1).(X3) -0.1398 0.135
Calcium*Pressure (X2) (X3) 0.0105 0.780
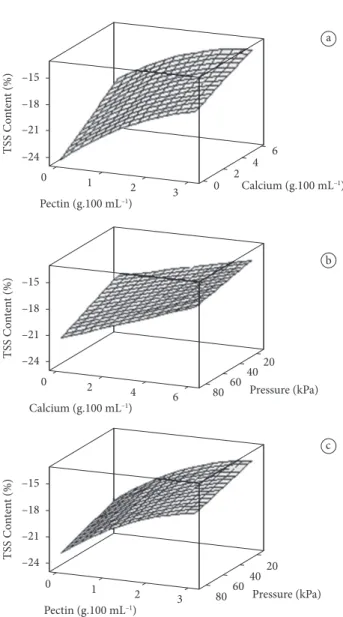
The response surfaces in Figure 2 show the fluid loss through exudation of strawberries after thawing, in function of the pectin and calcium chloride concentrations in the Figure 1 shows the response surfaces of the TSS content
variation percentage after thawing. The increase of viscosity in the solutions, which probably influences the flow kinetics, because it increases the TSS content (above 80%) of the thawed fruit in relation to the original fruit, is observed for pectin solution concentrations of around 3%. The higher increase in the TSS content is due to the glucose presence (20% of glucose in solution), in other words, higher pectin concentration aids the glucose impregnation in the strawberry and consequent increase of TSS contents. In each response surface, the absent factor is fixed at its intermediate value.
3.2 Loss of cellular fluid (LCF)
Table 3 shows that pectin concentrations and calcium chloride are significant at the level of 95% for regression; this demonstrates the importance of these factors to avoid cellular fluid loss after freezing. The pressure and the interactions did not present high influence on regression.
Figure 1. Percentage of variation of TSS content in function of a) pectin
and calcium chloride concentration; b) pressure and calcium chloride; c) pectin and pressure.
Table 3. Estimate of the regression coefficients for the variation
percentage of the loss of cellular fluid.
Term Coefficient p
Constant -26.8562 0.000*
Pectin (X1) 3.8607 0.029**
Calcium (X2) 1.1023 0.018**
Pressure (X3) 0.0491 0.065
Pectin*Pectin (X1)2 -0.4788 0.194
Pectin*Calcium (X1).(X2) -0.1163 0.218
Pectin*Pressure (X1).(X3) -0.0015 0.831 Calcium*Pressure (X2) (X3) -0.0043 0.285
** Significant to a level of 1% of probability, R2 = 97.9%.
Figure 2. Cellular fluid loss (CFL) in function of a) pectin and calcium
of Ca2+-pectates, the esterification degree plays an important
role in the rigidity and configuration of pectic substances, through which the firmness of pectic macromolecules increases with the content of methoxy groups (HUDSON; BUESCHER, 1986).
The firmness of plant derivatives depends on the turgor of the cells. Two previous conditions for cell turgor maintenance are: vacuolar space and intact cellular membrane to maintain the osmotic pressure; and intact cellular wall to maintain the hydrostatic pressure (McLELLAN et al., 1991). With freezing, the cellular membranes lose their osmotic power and their semi permeability (TREGUNNO; GOFF, 1996). The metabolic system of the plant tissue is interrupted, the displacement of the enzymatic system occurs, and the cell loses its turgor. Furthermore, a dramatic change in tissue texture and deteriorativebiochemical reactions are highly probable (TALENS et al., 2002). The ice crystals can break the cells impregnation processes with vacuum pressures of 84.4, 50.5
and 16.6 kPa.
It is observed in Figure 2 that the increase of the pectin and calcium chloride concentrations influences positively, reducing the cellular fluid loss after thawing. The loss of cellular fluid is an important quality parameter of the freezing that can be related to the degree of rupture of the cell structure. The higher the cellular fluid loss, the more damaged the tissue.
Treatments with high pectin concentrations (3 g.100 mL-1
solution) and high calcium chloride concentrations (6 g.100 mL-1
solution) were the ones that presented the lowest cellular fluid losses after freezing/thawing; Van Buggenhout et al. (2006) also reported that a 3% pectin solution caused lower strawberry cell fluid losses.
3.3 Texture
Table 4 shows the regression analysis results of the texture variation percentage after the treatment of fruits through vacuum impregnation and thawing. Table 4 shows that only pectin concentration influences the regression coefficients; calcium chloride and pressure factors do not influence the regression coefficients.
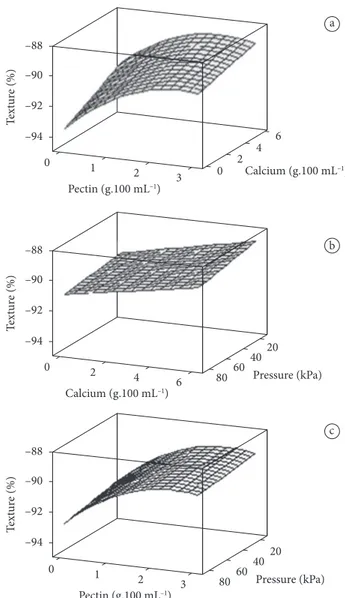
Figure 3 shows the response surfaces for the variation percentage of the strawberry texture after vacuum impregnation treatments, freezing and thawing, regarding the texture of the fruit in natura.
The surfaces of Figure 3 demonstrate that a high concentration exists (close to 3%) together with the maximum concentration of calcium chloride, where the functionality of pectin is more efficient in the texture preservation of thawed strawberries. The texture loss is high, as it was found by Van Buggenhout et al. (2006), values were around 80%, but these treatments combined with more efficient methods of freezing, such as fast freezing, can result in lower product texture loss. In cherries treated with calcium, it was observed a decrease in the degree of pectin esterification and an increase in the EDTA-soluble pectin fraction and Ca2+ contained in the
cellular wall (ALONSO; RODRIGUEZ; CANET, 1995). The calcium pectin complex formed, acts as intracellular cement to give firmness to vegetable tissue. Independent of the formation
Table 4. Estimate of the regression coefficients for the variation
percentage of texture.
Term Coefficient p
Constant -93.9654 0.000*
Pectin (X1) 2.6969 0.018**
Calcium (X2) 0.3115 0.103
Pressure (X3) 0.0086 0.456
Pectin*Pectin (X1)2 -0.5192 0.053
Pectin*Calcium (X1).(X2) -0.0590 0.268 Pectin*Pressure (X1).(X3) -0.0013 0.765 Calcium*Pressure (X2) (X3) 0.0008 0.720
** Significant to a level of 1% of probability; * Significant to a level of 5% of probability,
R2 = 96.3%.
Figure 3. Variation percentage of the texture in function of the a) pectin
structure and the viscoelastic behavior at the solid-gel transition point phase (BRANDÃO; ANDRADE, 1999).
3.5 Temperature history, freezing dynamics and microstructural analysis
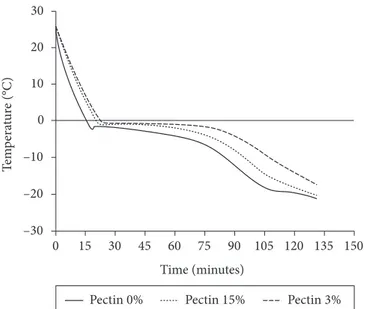
The cooling rate of Peltier cold stage system was similar to the freezing rate in domestic freezer; Figure 5 shows the freezing curve of strawberries pretreated, packed in plastic bags and frozen in a domestic freezer at temperature of - 18 ± 2 °C.
In Figure, it can be observed that the strawberry pieces were frozen at a rate of 0.4 °C/minute (Pectin 0%), 0.36 °C/minute (Pectin 1.5%) and 0.32 °C/minute (Pectin 3%). This difference in the rate of heat removal showed in Figure 5 is a consequence of pectin concentration increase. Pectin retains water in the structure; therefore, there is a decrease of the water available to the growth of ice crystals, thus influencing the freezing and harm the tissue integrity, therefore increasing undesirable
physical changes, chemistries and biochemistries, leading to a gradual and irreversible cumulative loss of quality (VAN BUGGENHOUT et al., 2006). Severe structural damage is due to the growth of ice crystals with the separation of the cells and the substantial loss of pectic material of the cellular wall and middle lamella (ROY; TAYLOR; KRAMER, 2001).
3.4 Viscosity
The freezing of the solution after the pre-treatment makes it possible to verify the effect occurred in the solution, in other words, the viscosity differences can be related to the freezing of the fruit and the caused changes. Table 5 presents the results of the regression analysis of the viscosity variation percentage after the treatment of the fruits through vacuum impregnation and thawing. Table 5 shows that the pectin factor and its interaction have an influence on the regression coefficients (p < 0.05).
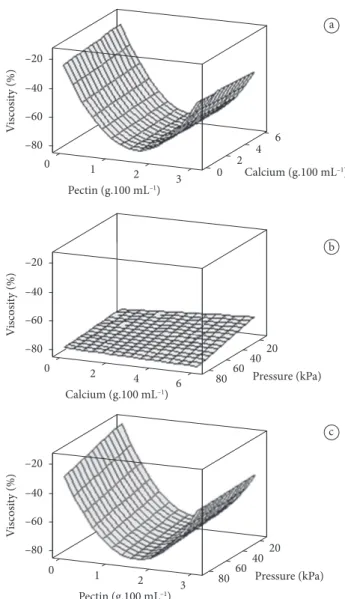
Figure 4 shows the solution viscosity variations after thawing. The pectin concentration has an influence on the viscosity of the solution.
Through Figure 4, it can be verified that concentrations of 1.5 and 3 g.100 mL-1 of solution, caused a higher loss of
viscosity. The pectin concentration 3 g.100 mL-1 of solution
obtained the best results for texture and weight preservation of the strawberries. The surfaces represent flow tendencies in the solution; probably, pectin concentrations between 1.5 and 3% would obtain better solute flows within the fruit.
One of the properties of the pectin is its ability to produce strong gels, in acid pH and in the presence of sugars, and the formation of the pectin-sucrose network depends on hydrogen bonds and hydrophobic interactions, which are functions of temperature (SATO; CUNHA, 2007).
The pectin-sugar system, mainly sucrose, is a quite complex system during the jellification process and it is principally temperature dependent. The hydrogen bond type interactions are predominant at lower temperatures and the hydrophobic interactions are predominant at higher temperatures. Therefore, depending on the temperature, the junction areas are formed and stabilized by different contributions from hydrophobic interactions and hydrogen bonds, which affect the network
Table 5. Estimate of the regression coefficients for the variation
percentage of viscosity.
Term Coefficient p
Constant -31.8791 0.100
Pectin (X1) -62.4274 0.014**
Calcium (X2) -0.1837 0.952
Pressure (X3) 0.1353 0.567
Pectin*Pectin (X1)2 20.0530 0.011**
Pectin*Calcium (X1).(X2) -0.3963 0.695 Pectin*Pressure (X1).(X3) -0.0599 0.514
Calcium*Pressure (X2) (X3) 0.0186 0.679
** Significant to a level of 5% of probability, R2 = 93.0%.
Figure 4. Variation percentage of the solution viscosity in function
its loss of ability to act as a semi-permeable membrane or a diff usion barrier. Th is has practical consequences in terms of the leeching of cellular substances of tissues and water loss, which alters thermal properties and fl avors (DELGADO, 1997).
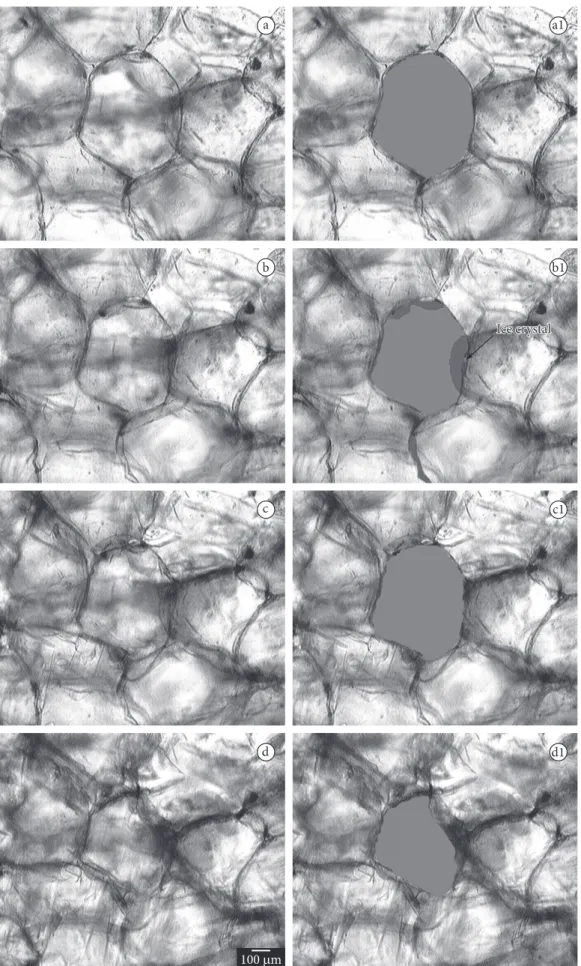
Figures 6 and 7 show that the growth of extracellular crystals caused tissue shrinkage and cell collapse due to the mechanical damage caused by the ice crystal growth that initiated in the intercellular spaces (DELGADO; RUBIOLO, 1994).
3.6 Cell shrinkage
Table 6 shows the regression analysis results of the cell area variation percentage of the fruits aft er treatment through vacuum impregnation and during freezing. Table 6 shows that only pectin concentration infl uences the regression coeffi cients; calcium chloride and pressure factors do not infl uence the regression coeffi cients.
Figure 8 presents the response surfaces for the variation percentage of the cell area reduction (shrinkage) of the strawberry tissues aft er treatment through vacuum impregnation and during freezing, in function of the pectin and calcium chloride concentration, and pectin and vacuum pressure.
Figure 8a presents a loss of 0%, in other words, this time shows the variation of the area before the onset of freezing; fi gure 8b shows the variation aft er 1 minute of freezing; through these, the occurrence of cell area reduction can be verifi ed, but not having a signifi cant diff erence between the treatments; fi gure 8c presents a tendency of area loss reduction through the pectin concentration increase; fi gure 8d shows that, with the increase of the pectin concentration there is a reduction of the cell area loss, the surfaces show an optimum concentration, where the functionality of the pectin is higher, above 2%.
Th e analysis of the cell area evidences the eff ectiveness of the treatments to maintain the previously analyzed quality parameters, such as loss of cellular fl uid and texture, where cells with larger areas represent more preserved cells, with lower fl uid loss and, consequently, higher turgidity and texture.
dynamics. Th e freezing dynamics aims to identify how the growth of ice crystals at the microscopic level occurs, and how the treatments can modify this growth rate.
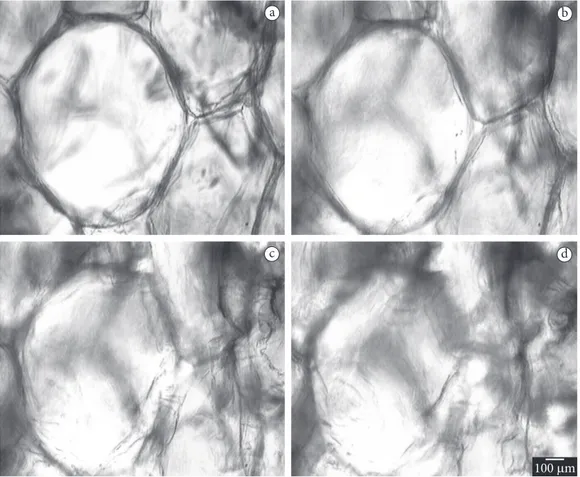
Figure 6 shows photomicrographs of the strawberries treated with concentration of 0% pectin, 6% calcium chloride and a pressure of 16.6 kPa at the time same intervals. Figure 6 shows photomicrographs of the analyses through photon microscopy of strawberries treated by vacuum impregnation with concentration of 3% pectin, 6% calcium chloride and 16.6 kPa pressure at the times of 0, 1, 2 and 3 minutes, aft er the beginning of the movement referring to the ice crystals growth. It is observed in the Figures that the formation of ice crystals results in accentuated damage to the cellular structure of the strawberry and its formation initiates in the intercellular spaces.
Comparing Figures 6 and 7, it can be observed that Figure 7 shows cells with more preserved structures during freezing, due to the treatment that contained the higher pectin concentration; Figure 6 shows more deteriorated cells due to the freezing process.
The freezing process can be approximately classified according to the freezing rate. Th e typical rates are: slow freezing, around 0.02-0.2 °C/minute; commercial freezing, between 0.2-0.83 °C/minute; and fast freezing, over 0.83 °C/ minute (BROWN, 1991). Th e freezing rate of the samples in this work was 0.4 °C/minute, which is classifi ed as commercial to slow.
Slow freezing can cause alterations in the product, mainly in the cellular membrane transport properties, that can result in denaturation or alterations on the interaction between proteins and lipids. A consequence of cell membrane deterioration is
0 –30 –20 –10 0 10 20 30
15 30 45 60 75 90 105 120 135 150
Time (minutes)
T
em
p
era
tur
e (°C)
Pectin 0% Pectin 15% Pectin 3%
Figure 5. Temperatures historical for the freezing of the strawberries
pieces submitted to pre treatments as function of the pectin concentration.
Table 6. Estimate of the regression coefficients for the variation
percentage of the area.
Term Coeffi cient p
Constant -26.7289 0.008
Pectin (X1) 8.5877 0.045**
Calcium (X2) 0.1259 0.964
Pressure (X3) 0.9657 0.733
Pectin*Pectin (X1)2 -7.9569 0.205
Pectin*Calcium (X1).(X2) -0.7614 0.787
Pectin*Pressure (X1).(X3) 0.7272 0.796 Calcium*Pressure (X2) (X3) -1.9822 0.498
Figure 7. Photomicrographs of the strawberries treated with concentration of 3% pectin, 6% calcium chloride and a pressure of 16.6 kPa, a) being 0; b) 1; c) 2; and d) 3 minutes aft er the onset of freezing.
Figure 8. Variation percentage of the cell area of the fruit in function of the pectin and calcium chloride concentration at the times a) 0; b) 1;
HUDSON, J. M.; BUESCHER, R. W. Relationship between degree of pectin methylation and tissue firmness of cucumber pickles. Journal
of Food Science, Oxford, v. 51, n. 1, p. 138-140, 1986.
LEWICKI, P. P.; PAWLAK, G. Effect of drying on microstructure of plant tissue. Drying Technology, v. 21, p. 657-683, 2003.
LUZA, J. G. et al.. Chilling injury in peaches: A cytochemical and ultrastructural cell wall study. Journal of the American Society
for Horticultural Science, v. 117, p. 114-118, 1992.
McFEETERS, R. F.; ARMSTRONG, S. A. Measurement of pectin methylation in plant cell walls. Analytical Biochemistry, Amsterdam, v. 139, p. 212–217, 1984.
McLELLAN, M. R. et al. Light microscopy of foodstuffs during freezing and thawing. In: BALD, W. B. (Ed.) Food Freezing: today and tomorrow. London: Springer, 1991. p.171–185.
NIETO, A. et al. Air drying behavior of apples as affected by blanching and glucose impregnation. Journal of Food Engineering, v. 36, p. 63-79, 1998.
PANAGIOTOU, N. M.; KARATHANOS, V. T.; MAROULIS, Z. B. Mass transfer modelling of the osmotic dehydration of some fruits.
International Journal of Food Science and Technology, Oxford,
v. 33, p. 267-284, 1998.
RESENDE, J. V.; CAL-VIDAL, J. Frutos de melão submetidos à pré-tratamentos com hidrocolóides: efeitos do processo de congelamento sobre a microestrutura celular. Ciência e Tecnologia
de Alimentos, Campinas, v. 22, n. 3, p. 295-304, set./dez. 2002.
ROY, S. S.; TAYLOR, T. A.; KRAMER, H. L. Textural and ultrastructural changes in carrot tissue as affected by blanching and freezing.
Journal of Food Science, v. 66, p. 176-180, 2001.
SALVATORI, D.; ANDRÉS, A.; CHIRALT A.; FITO, P. The response of some properties of fruits to vacuum impregnation. Journal of
Food Process Engineering, Oxford, v. 21, p. 59-73, 1998.
SATO, A. C. K.; CUNHA, R. L. Influência da temperatura no comportamento reológico da polpa de jabuticaba. Ciência e
Tecnologia de Alimentos, v. 27, n. 4, p. 890-896, 2007.
SOUSA, M. B. et al. The effect of the pre-treatments and the long and short-term frozen storage on the quality of raspberry (cv. Heritage).
European Food Research Technology, v. 221, p. 132-144, 2005.
SOUSA, M. B. et al. Effect of processing on the texture and sensory attributes of raspberry (cv. Heritage) and blackberry (cv. Thornfree).
Journal of Food Engineering, Kidlington, v. 78, p. 9-21, 2007.
TAIWO, K. A. et al. Effects of pre-treatments on the diffusion kinetics and some quality parameters of osmotically dehydrated apple slices. Journal of Agricultural and Food Chemistry, Davis, v. 49, p. 2804-2811, 2001.
TALENS, P. et al. Study of the influence of osmotic dehydration and freezing on the volatile profile of strawberries. Journal of Food
Science, Chicago, v. 67, p. 1648-1653, 2002.
TORREGGIANI, D.; BERTOLO, G. Osmotic pretreatments in fruit processing: Chemical, physical and structural effects. Journal of
Food Engineering, Oxford, v. 49, p. 247-253, 2001.
TREGUNNO, N. B.; GOFF, H. D. Osmodehydrofreezing of apples: structural and textural effects. Food Research International, Toronto, v. 29, p. 471-479, 1996.
VAN BUGGENHOUT, S. et al. Minimizing texture loss of frozen strawberries: effect of infusion with pectinmethylesterase and calcium combined with different freezing conditions and effect of subsequent storage/thawing conditions. European Food Research
Technology, Berlin, v. 223, p. 395-404, 2006.
VAN BUGGENHOUT, S. et al. Structure/processing relation of vacuum infused strawberry tissue frozen under different conditions.
European Food Research Technology, v. 226, p. 437-448, 2008.
ZHAO, Y.; XIE, J. Practical applications of vacuum impregnation in fruit and vegetable processing. Trends in Food Science & Technology, Kidlington, v. 15, p. 434-451, 2004.
4 Conclusions
The increase of pectin concentration in the solution facilitated the glucose impregnation in the tissues of the fruit and the increase of the TSS content after thawing.
The increase of the pectin and calcium chloride concentration in the solution reduces the loss cellular fluid.
The pectin concentration had a positive influence and demonstrated a potential for the protection of the frozen tissue samples.
The photomicrographs showed that the loss of cellular fluid occurs during freezing, with the crystal growth, and that the manifestation of these crystals occurs in the intercellular spaces.
Pressure does not exercise an influence on the measured parameters.
Acknowledgements
We would like to thank Conselho Nacional de Desenvolvimento Científico (CNPq) and Fundação de Amparo à Pesquisa do Estado de Minas Gerais (FAPEMIG) for the financial support granted to this research.
References
ALLAN-WOJTAS, P. M.; FORNEY, C. F.; CARBYN, S. E.; NICHOLAS, K. U. K. G. Microstructural Indicators of Quality-related Characteristics of Blueberries. Lebensmittel-Wissenschaft
und-Technologie, v. 34, p.23–32, 2001.
ALONSO, J.; RODRIGUEZ, T.; CANET, W. Effect of calcium pretreatments on the texture of frozen cherries. Role of pectinesterase in the changes in the pectic materials. Journal of Agricultural and
Food Chemistry, Davis, v. 43, p.1011-1016, 1995.
BRANDÃO, E. M.; ANDRADE, C. T. Influência de fatores estruturais no processo de gelificação de pectinas de alto teor de metoxilação.
Polímeros, v. 9, n. 3, p. 38-44, 1999.
BROWN, M. H. Microbiological aspects of frozen foods. In: BALD, W. B. (Ed.). Food Freezing: Today and tomorrow. London: Springer, 1991. p.15-25
CHIRALT, A.; FITO, P. Transport mechanisms in osmotic dehydration: the role of the structure. Food Science and Technology
International, Pullman, v. 9, n. 3, p. 179-185, 2003.
DELGADO, A. E.; RUBIOLO, A. C. Preparación de muestras de alimentos para la observación en el microscopio electrónico de barrido (SEM) y óptico. In: Congreso Argentino de Ciencia y Tecnología de Alimentos, 4, y Encuentro de Técnicos de Alimentos del Cono Sur, 1, Buenos Aires, Argentina. Anales... Buenos Aires: Tomo II, 1994. p.125-128, n. 220.
DELGADO, A. E. Determinación del comportamiento térmico y lãs características de los alimentos en la conservación por
congelación. 1997. 131 f. Tesis (Maestría en Ingeniería
Química)-Universidad Nacional del Litoral, Santa Fe, 1997.
DELGADO, A. E.; RUBIOLO, A. C. Microstructural changes in strawberry after freezing and thawing processes.
Lebensmittel-Wissenschaft und-Technologie, v.38, p.135-142, 2005.
FERNÁNDEZ, L.; OTERO, B.; GUIGNON, P. D. High-pressure shift freezing versus high-pressure assisted freezing: Effects on the microstructure of a food model. Food Hydrocolloids, Wrexham, v. 20, p. 510-522, 2006.
FLINT, O. Introduction. In: Food microscopy: a manual of practical methods, using optical microscopy. Oxford: Bios Scientific Publishers Ltd. in association with the Royal Microscopy Society, 1994. p.1-3.
HENG, K.; GUILBERT, S.; CUQ, J. L. Osmotic dehydration of papaya: influence of process variables on the product quality. Science des