1 Recebido para publicação em 21.7.2013 e aprovado em 2.2.2014.
2 Universidade Federal de Santa Maria, Frederico Westphalen-RS, Brazil, <santi_pratica@yahoo.com.br>; 3 Universidade Federal de Pelotas, Pelotas-RS, Brazil; 4 Escola Superior de Agricultura “Luiz de Queiroz” - Universidade de São Paulo, Piracicaba-SP, Brazil.
P
HYTOSOCIOLOGICALV
ARIABILITY OFW
EEDS INS
OYBEANF
IELD1Variabilidade Fitossociológica de Plantas Daninhas em Uma Lavoura de Soja
SANTI, A.L.2, BONA, S.D.2, LAMEGO, F.P.3, BASSO, C.J.2,EITELWEIN, M.T.4, CHERUBIN, M.R.4, KASPARY, T.E.2,RUCHEL, Q.3, and GALLON, M.2
ABSTRACT - Understanding spatial distribution of weeds in the crop enables to perform localized herbicide applications, increasing the technical and economic efficiency of operations and reducing environmental impacts. This work aimed to characterize the spatial and phytosociological variability of weeds occurring in soybean commercial field. It was conducted in an agricultural area located at the municipality of Boa Vista das Missões – RS, during the 2010/2011 harvest season. The area, that had been managed under no-tillage with soybean monoculture (summer) for five years, was divided in regular squares of 50 x 50 m (0.25 ha), totalizing 356 points. For species identification, 0.5 x 0.5 m sample squares were used. During the survey, 1,739 individuals were identified, distributed in 19 species of 13 families. The weed species Cardiospermum halicacabum, Digitaria horizontalis, Urochloa plantaginea and Raphanus raphanistrum showed the highest population variation in the area; however, only C.halicacabum, U.plantaginea and R.raphanistrum stood out based on the Importance Index Value (IVI). Localized management strategies considering the spatial variability of weed species placed in the Magnoliopsidas and Liliopsidas group show a high potential for use in soybean crop. The results show that the sampling method through regular grid was capable of characterizing the occurrence, population density and spatial variability of weed species in soybean crop.
Keywords: precision agriculture, spatial distribution, importance index value, variable rate application.
RESUMO -O conhecimento da distribuição espacial das plantas daninhas na lavoura possibilita realizar aplicações localizadas de herbicida, aumentando a eficiência técnica e econômica das intervenções, além de reduzir os impactos ambientais. O presente trabalho teve como objetivo caracterizar a variabilidade espacial e fitossociológica de plantas daninhas ocorrentes em uma lavoura comercial de soja. O trabalho foi conduzido em uma área agrícola localizada no município de Boa Vista das Missões – RS, na safra 2010/ 2011. A área vem sendo manejada em semeadura direta com monocultivo de soja (verão) há cinco anos. A área foi dividida em quadrículas regulares com dimensões de 50 x 50m (0,25ha), totalizando 356 pontos. Para identificação das espécies, foram usados quadros amostrais de dimensões 0,5 x 0,5 m. No levantamento foram identificados 1.739 indivíduos, distribuídos em 19 espécies de 13 famílias. As espécies daninhas
Cardiospermum halicacabum, Digitaria horizontalis, Urochloa plantaginea e
Raphanus raphanistrum apresentaram a maior variação populacional na área; no entanto, somente C. halicacabum, U. plantaginea e R. raphanistrum destacaram-se quanto ao Índice de Valor de Importância (IVI). Estratégias de manejo localizadas, considerando a variabilidade espacial das espécies de plantas daninhas agrupadas nas classes Magnoliopsidas e Liliopsidas, apresentam elevado potencial para utilização na cultura da soja. Os resultados demonstram que o método de amostragem através de malha regular foi capaz de caracterizar a ocorrência, a densidade populacional e a variabilidade espacial de espécies de plantas daninhas na cultura da soja.
Palavras-chave: agricultura de precisão,distribuição espacial, índice de valor de importância, aplicação em taxa
INTRODUCTION
The use of pesticides in order to increase and/or maintain the productivity of crops is characterized as one of the highest yield costs in agriculture (CONAB, 2012). Thus, with the use of agriculture tools of precision (AP) – a tool that enables obtaining information and georeferenced management of the soil and crops –, it is possible to consider the spatiotemporal variability of the distribution of weeds in the crop, thus enabling the realization of located managements with interventions at specific sites (Goel et al., 2003), promoting increased technical and economic efficiency of crops.
Studies using sampling to characterize the spatial variability of weeds and use of localized control have shown significant reductions in pesticide use and cost of yield of crops such as corn, wheat, barley and sugar beet (Timmermann, 2003). However, practical applications in the field are occurring slowly and inexpressively (Merotto Jr. & Bredemeier, 2010), because they demand viable and cheap technology (Candón, 2012a).
Seeking to characterize the distribution of the weed, it is clear that it can occur in a generalized way or in patch(Nordmeyer et al., 1997). When the occurrence is in foci, the prospects for use of AP are more promising than the conventional management (Merotto Jr. & Bredemeier, 2010). With the georeferencing of weeds, it is possible to apply the herbicide with great product savings, while maintaining the efficacy of control and reducing the environmental impact of conventional applications (Timmermann, 2003).
Within the context of the use of AP in order to have monitoring, mapping and weed control there are two lines of research in regard to the forms of phytosociological survey: gathering information electronically, in real time, through specific sensors and conventional sampling. As for the automatic collection of data, one can use color cameras and infrared coupled to a land (Silva Jr. et al., 2012) or air equipment (Candón et al., 2012b) and sensors and vegetation index (Chang et al., 2004; Merotto Jr. et al., 2012). On the other hand, in the conventional sampling meshes are
commonly used sample, dividing the area into smaller squares, where the georeferenced samples of the weed are held (Merotto Jr. & Bredemeier, 2010). In addition to this, alternative methods have been tested, such as the mapping of the contours of the patches of weeds (Balastreire & Baio, 2001), or even performing visual marking at the time of harvest, aided by virtual markers available in harvesters (Shiratsuchi et al., 2004).
In general, the methodology for mapping should be quick and simple, facilitating the development of the map; due to the factor of economic scale, it should be a methodology that can be applied to large areas (Balastreire & Baio, 2001). Thus, by the georeferenced sampling, it becomes possible to identify where the economic threshold level has been reached and therefore there is the need for herbicide application.
In this context, the present study aimed to characterize the spatial and phytosociological variabilities of the weeds in an area of tillage with planted soybean and managed with tools of precision agriculture.
MATERIALS AND METHODS
The study was performed in an agricultural area in the municipality of Boa Vista das Missões (RS), Brazil, located between the geographic coordinates of latitude 26°782 553 S to 26°932 143 S and longitude of 69°292 283 W to 69°302 963 W, with an average altitude of 577 meters, totaling 89.07 ha. The area has been managed under no-tillage for more than 10 years, with monoculture of soybean (summer) in the last five seasons. In winter the area has been rotated with cereals for grain (wheat and white oat) and cover crops (black oat and turnip).
The climate of the region, according to the Maluf’s classification (2000), is subtropical with wet spring (ST PU), average annual temperature of 18.1 oC and annual rainfall of
1919 mm year-1. The relief of the region is
The soybean planting was made on November 10, 2010 (2010/11 harvest), in succession to the wheat crop, being preceded by a burndown application with glyphosate herbicide associated with diclosulan at doses of 720 g e.a. ha-1 and 25,2 g i.a. ha-1,
respectively. Diclosulan is indicated for control of dicotyledons in incorporated pre-sowing or in pre-emergence in soybean crops (Rodrigues & Almeida, 2011); its half-life is 60 to 90 days, depending on weather and soil conditions (Lavorenti et al., 2003). The soybean cultivar used was Nidera 6411, with a spacing of 0.50 m and a population of 240,000 plants ha-1.
The phytosociological survey of the weeds occurring in the area was carried out during the vegetative growth stage V5, before the first application of post-emergence herbicide. Thus initially, it was proceeded to the georeferencing of the area, marking the perimeter with a portable GPS navigation. Subsequently, a mesh sample was generated, dividing the area into regular squares of 50 x 50 m (0.25 ha), totaling 356 georeferenced sampling points. The mesh was generated using the CR – Campeiro 7 software (Giotto & Robaina, 2007).
The phytosociological sampling was done using sample tables of dimensions 0.5 x 0.5 m (0.25 m2), identifying and counting the species
present in the center point.
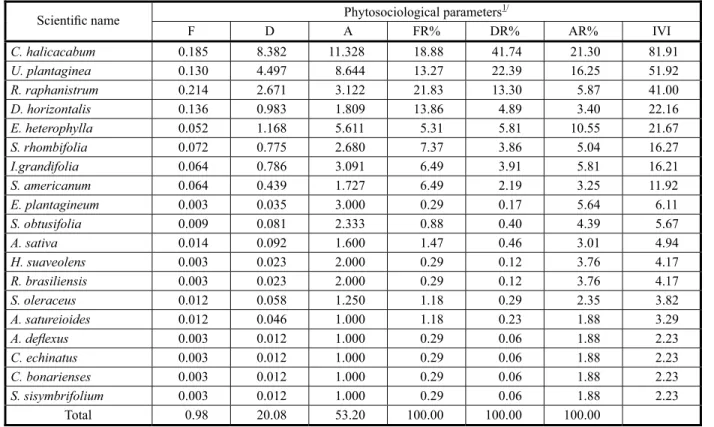
The data were submitted to the analysis proposed by Mueller-Dombois & Ellenberg (1974): Frequency (F = number of entries in which a species was detected/total number of entries), Density (D = number of individuals of a species/total area sampled), Abundance (A = number of individuals of a species/number of entries in which was detected a species), Relative Frequency ([FR% = (frequency of a species x 100)/total frequency]), Relative Density ([DR%= (density of a species x 100)/ total density]), Relative Abundance ([AR% = (abundance of a species x 100)/total abundance]) and Importance Value Index (IVI = FR + DR + AR).
The absolute values of occurrence of the different weed species were subjected to a descriptive statistical analysis, determining position measurements (mean and maximum values) and of dispersion [standard deviation,
coefficient of variation (CV%), asymmetry coefficient (Cs) and of kurtosis (Ck)].
The assessment of the spatial distribution of weed species occurring in the area was carried out by means of a spatialization of the data in thematic maps using the geostatistical interpolation by kriging, with the aid of the Falker MapPlus software (Falker, 2012). The assessment of the spatial distribution and the interpretation of the results followed the population density rates of weeds, always using the same caption for the various species, in order to facilitate the differentiation in the infestation occurring in the area, even though they have different biological behaviors. To simplify the spatial sampling, the occurrence of weeds was grouped into classes of infestation: Very low: < 2 plants m-2; Low: 2 to
6 plants m-2;Average: 6 to 10 plants m-2; High:
10 to 15 plants m-2; Very high: > 15 plants m-2.
Due to the lack of predetermined classes infestation, the classes in this work have been created based on the infestation levels of the species in the area.
RESULTS AND DISCUSSION
The phytosociological survey identified 1,739 individuals belonging to 19 species (15 Magnoliopisidas and 4 Liliopisidas) of 13 families, being Poaceae (4), Asteraceae (3) and Solanaceae (2) and those with most species occurring in the area (Table 1). Thus, it was verified that the mapping method by sampling using regular sample grids was able to capture the spatial variability of the sampled points, increasing accuracy as it thickened the samples, having as a limitation, regarding the farmer, the time and labor required for denser collections.
however, it becomes more time consuming with the increasing complexity of the spatial distribution of weeds in the area. Recently, with the use of optical sensors in Brazilian agriculture, some studies have shown promising results for use in weed mapping (Silva Jr. et al., 2012; Merotto Jr. et al., 2012).
The weed Raphanus raphanistrum was the one that presented the highest frequencies and relative frequency, equivalent to 0.214 and 21.83%, respectively (Table 2). Its spatial distribution had a more uniform behavior when compared with the other species, presenting the third largest IVI (41.00). This uniformity may be associated with its use as a green cover in winter prior to soybean cultivation. At the time, the desiccation of
R.raphanistrum was late and, consequently, many plants closed the cycle in the area, increasing the seed bank of the species. Thus, it is evident how important it is to perform an efficient burndown application, avoiding the occurrence of the species of coverage as weed in crop in succession and/or rotation.
As for the IVI (Table 2), the species that presented the highest values were
Cardiospermum halicacabum, with 81.91, and
Urochloa plantaginea, with 51.92. For
C. halicacabum the DR%, was the factor that most contributed for the IVI, demonstrating that the occurrence of this species had a high number of individuals per unit of area. The species occurred in a small part of the area or in isolated spots characterized as patch, but intensely. This weed species was very important in the soybean conventional crop, before the arrival of the RR soybean (Souza & Ruedell, 1993); this is because C.halicacabum
was not effectively controlled in the field, presenting difficulties later in mechanical separation of the seeds in sieves, as well as biological factors of the species, which favored its spread.
For the species U. plantaginea, AR% was the factor that most contributed for IVI, which shows that the plant is found in few points; however, when present in the sample area, it has a large number of individuals. Both for the
U. plantaginea and for the C. halicacabum, it is worth noting the high prolificacy, common to weeds. Therefore, a single remaining plant in the area is able to replenish considerably the soil seed bank.
The total density of infestation by weeds was approximately 20 plants m-2, which may
carry a significant decrease in productivity when no control method is adopted. The degree of weed interference is influenced by several factors, including the period of coexistence with agricultural crops, which is one of the most important (Pitelli, 1985). In soybeans, the critical period of interference, i.e., a period in which to intervene with some form of weed management, avoiding significant decreases in productivity, has been between 25 and 30 days after crop emergence (Voll et al., 2005).
The species Euphorbia heterophylla
presented low density, 0.98 plant m-2; however,
it is necessary to observe its FR%, which represented approximately 62% of the IVI, which reached the value of 13.86%, demonstrating the presence of the species in most of the area, but presenting low density. Although this has occurred, a community of infestation composed mainly by E.heterophylla
and U. plantaginea requires attention in monitoring, because of the high competitive ability of these species with soybean cultivation (Carvalho et al., 2010). Given that this area has remained for some years without rotation of crops, namely, soybean monoculture in summer, it is believed that the occurrence of these species was favored, increasing the area of the seed bank for those plants that “evaded” control. Besides, in the Brazilian state of Rio Grande do Sul, where soybean cultivation is almost entirely performed using transgenic cultivars resistant to glyphosate, the species E. heterophylla has been selected, as the occurrence of biotypes tolerant to glyphosate has been proven (Vidal et al., 2007).
The Liliopsidas plants presented a trend of behavior in the area as patch, and this characteristic was seen for the species
U. plantaginea e Digitaria horizontalis, by the rates of DR% and AR%, which were more expressive for these species (Table 2).
Table 2 - Phytosociological parameters evaluated for the species occurring in the area of no-tillage with soybean crop. Boa Vista das
Missões-RS, 2010/2011
1/ F = frequency; D = density; A = abundance; FR = relative frequency; DR = relative density; AR = relative abundance; IVI = importance
The species Ipomoea grandifolia and
Sidarhombifolia presented the phytosociological rates FR%, DR% and AR% quite similar (Table 2). For I.triloba, they were of 6.49, 3.91 and 5,81, and for S.rhombifolia, 7.37, 3.86 and 5.04, as well as the IVI of 16.21 and 16,27, respectively. In general, the main weed species observed in the study are called ruderal strategists (Radosevich et al., 1997), which are established in the area and adapt according to the system used (currently, direct seeding over straw).
The results of the statistical analysis (Table 3) show that the weeds tend to not exhibit normal frequency distribution. These results are confirmed by the values of Cs (symmetrical on the right) and Ck (leptokurtic distribution), greater than and far from zero.
This behavior agrees with the one observed by Shiratsuchi (2001) and Chiba et al. (2010).
As for the dispersion of the data, there were high values of coefficient of variation (CV%) observed for most species, especially
C.halicacabum (310.80%) and U. plantaginea
(236,86%) as those that showed the highest values, due to the occurrence of patch, with sampling points with high infestation (Table 2). The occurrence of high values of CV is characteristic in studies involving weed mapping (Gerhards et al., 1997), having been previously reported by Shiratsuchi (2001) and Schaffrath et al. (2007). These authors have observed values of CV ranging from 140 to 647% and from 74.03 to 168.85%, respectively.
In Figure 1 are only the weeds that showed greater spatial variability in the study area. The other species presented very low density of infestation (< 2 plants m-2) in more than
90% of the area. Although the value may seem small, again is emphasized the common prolificacy of weeds; using the weed species
Conyza bonariensis as an example, it was observed that a plant is capable to yield about 110 thousand seeds (Wu & Walker, 2007), causing replenishment of the soil seed bank, or in this particular case, given the very light structure of the seed, the dispersal in the area. However, in general, weed densities below
Table 3 - Descriptive statistical analysis of the variability of weeds occurring in an no-tillage area cultivated with soybeans. Boa Vista
das Missões-RS, 2010/2011
Figure 1 - Thematic maps of the spatial distribution of the main weeds in no-tillage area cultivated with soybeans, in which: A)
Cardiospermum halicacabum; B) Ipomoeagrandifolia; C) Euphorbia heterophylla; D) Urochloa plantaginea; E) Raphanus
2 plants m 2, especially in a well established
soybean crop, may not present a risk of losses.
C. halicacabum and I.grandifolia presented a very low infestation in 70.60 and 89.91% of the area and very high (> 15 plants m-2) in
11.51 and 1.18% of the area, respectively. This behavior may result from failures of previous herbicide applications, or even seeds from surrounding areas. E. heterophylla had a very high infestation in only 0.05% of the area and a percentage of 82.06% of the area occupied with less of 2 plants m-2, i.e. classified as very
low. On the other hand, an infestation of 13.64% of the area is observed, with 2 to 6 plants m-2, well distributed in the field (high
relative frequency). According to Carvalho et al. (2010), the high competitive ability of
E. heterophylla with soybeans promotes significant reductions in the growth of the cultivar, with a decrease of 82% in the accumulation of dry mass of the soybeans in the presence of 16 plants of E.heterophylla per pot.
D. horizontalis and U.plantaginea, because they are Liliopsidas of the Poaceae family, have lower capacity for dispersal of seeds over long distances, making the distribution more localized. This behavior is evident in the thematic maps, in which 89.05 and 78,14% of the area presented occurrence below 2 plants m-2 and 1,89 and 8.73% of the area,
with > 15 plants m-2, respectively.
R. raphanistrum presented a very low infestation in 71.13% of the field and very high in 3.61%; however, it is worth noting the second class (ranked as low), which was expressed in 14.5% of the area. The spatial distribution of the species was allocated only in the northern part of the area, a fact arising from the use of this species as a strategy of crop rotation in that site in the previous year.
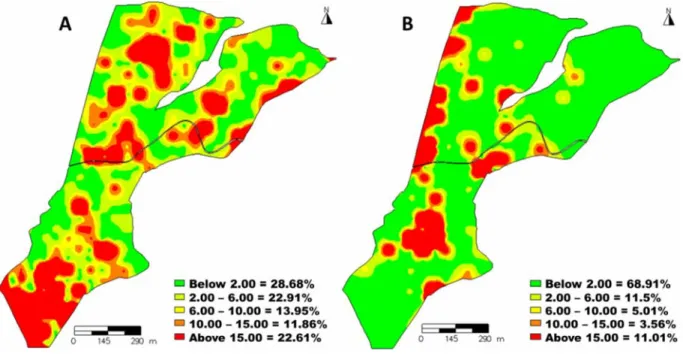
By the data obtained in this study, it is clear that the localized management of weeds is only justified if done based on the class of the species, Liliopsidas or Magnoliopsidas, as it would establish the zones of infestation. Accordingly, to characterize the spatial variability based on the families of the species, thematic maps were prepared based on cumulative species belonging to the same class (Figures 2 and 3). The maps reveal
that there is a greater infestation of plants classified as Magnoliopsidas. These results corroborate those found by Chiba et al. (2010). In general, as previously reported, it is believed that many of these species are still remnants of the seed bank in the area, from the time of conventional tillage of soybean. With the arrival of the RR soybeans, glyphosate has become the main herbicide used, and some of the species found may be tolerant to the herbicide.
In this context, it was found, based on the interpolated maps that in 68.91% of the area there would be no need of herbicide to control weeds of the Liliopsida class and, in 28.68%, no need for control of the species of the Magnoliopsida class, which can generate savings of herbicides and minimize the environmental impact. As the localized application was not held, studies that can actually prove the technical and economic efficiency of this method of weed control are suggested. Studies conducted about the sunflowercultivation by Jurado-Exposito et al. (2005) allowed a saving in the order of 81% when applying herbicides in a variable rate, based on the mapping interpolated by kriging.
The weed mapping is an important strategy to achieve sustainable and economic management of resources by applying varied volumes; it also allows monitoring the temporal evolution of the infestation and contributes to the establishment of management strategies that reduce the period of competition with the cultivation (Jaremtchuk et al., 2008). Besides, Biller et al. (1997) reported that the local application based on the concept of weed control in real time can provide herbicide savings from 30 to 70% and 100% efficiency in control. Control technologies of section sprayers, tanks for different active ingredients and spray volume control are fully developed, but the major limitation remains the identification of weed species in real time (Berge et al., 2008).
Figure 2 - Thematic maps of the spatial distribution of weeds according to their botanical family in no-tillage area cultivated with soybeans, in which: A) Magnoliopsida and B) Liliopsida. Boa Vista das Missões-RS, 2010/2011.
Figure 3 - Thematic maps of the presence and absence of weeds according to their botanical family in no-tillage area cultivated with
soybeans, in which: A) Magnoliopsida and B) Liliopsida. Boa Vista das Missões-RS, 2010/2011.
area; however, only C. halicacabum, U. plantaginea and R. raphanistrum had IVI considerably higher. Localized management strategies, considering the spatial variability of
herbicides, sample studies – like this one – should be conducted more frequently in order to monitor the population dynamics of weeds occurring in crops and thereby assist in decision making for their control.
ACKNOWLEDGMENT
We gratefully appreciate Mr. Eliseu Schaedler and Mr. Eduardo Dauve for the availability of the experimental area and the support for performing the research. We are thankful to CNPq and UFSM for granting the scholarships.
LITERATURE CITED
BALASTREIRE, L. A.; BAIO, F. H. R. Avaliação de uma metodologia prática para o mapeamento de plantas daninhas. R. Bras. Eng. Agríc. Amb., v. 5, n. 2, p. 349-352, 2001.
BERGE, T. W.; AASTVEIT, A. H.; FYKSE, H. Evaluation of an algorithm for automatic detection of broad-leaved weeds in spring cereals. Precision Agric., v. 9, n. 6, p. 391-405, 2008.
BILLER, R. H.; HOLLSTEIN, A.; SOMMER, C. Precision application of herbicides by use of optoelectronic sensors. In: PRECISION AGRICULTURE, 1997, Warwick. Proceedings… Oxford: SCI, 1997. v. 2. p. 451-458.
CANDÓN, D. G. et al. Sectioning remote imagery for characterization of Avena sterilis infestations. Part A:
Weed abundance. Precision Agric., v. 13, n. 3, p. 322-336, 2012b.
CANDÓN, D. G. et al. Sectioning remote imagery for characterization of Avena sterilis infestations. Part B:
Efficiency and economics of control. Precision Agric., v. 13, n. 3, p. 337-350, 2012a.
CARVALHO,L. B.; BIANCO, S.; GUZZO, C. D. Interferência de Euphorbia heterophylla no
crescimento e acúmulo de macronutrientes da soja. Planta Daninha, v. 28, n. 1, p. 33-39, 2010.
CHANG, J. et al. Detecting weed-free and weed-infested areas of a soybean field using near-infrared spectral data. Weed Sci., v. 52, n. 4, p. 642-646, 2004.
CHIBA, M. K. et al. Variabilidade espacial e temporal de plantas daninhas em Latossolo Vermelho argiloso sob semeadura direta. Acta Sci. Agron., v. 32, n. 4, p. 735-742,
2010.
COMPANHIA NACIONAL DE ABASTECIMENTO – CONAB. Custos de produção: Culturas de Verão - Série Histórica. 2012. Disponível em: <http://www.conab. gov.br/ conteudos.php?a=1277&t=2&Pagina_
objcmsconteudos=3#A_objcmsconteudos>. Acesso em: 7 set. 2012.
FALKER. Software Falker MapPlus. Disponível em: <http://www.falker.com.br/fmp/>. Acesso em: 3 fev. 2012.
GERHARDS, R. et al. Characterizing spatial stability of weed populations using interpolated maps. Weed Sci., v. 45, n. 1, p. 108-119, 1997.
GIOTTO, E.; ROBAINA, A. D. A agricultura de precisão com o CR Campeiro 7. Manual do usuário. Santa Maria: UFSM/Centro de Ciências Rurais/Departamento de Engenharia Rural/Laboratório de Geomática, 2007. 319 p.
GOEL, P. K. et al. Potential of airborne hyper spectral remote sensing to detect nitrogen deficiency and weed infestation in corn. Comp. Electron. Agr., v. 38, n. 2,
p. 99-124, 2003.
JAREMTCHUCK, C. C. et al. Efeito de sistemas de manejo sobre a velocidades de dessecação, infestação inicial de plantas daninhas e desenvolvimento e produtividade da soja. Acta Sci. Agron., v. 30, n. 4, p. 449-445, 2008.
JURADO-EXPOSITO, M. et al. Characterizing population growth rate of Convolvulus arvensis in weath-sunflowet
no-tillage systems. Crop Sci., v. 45, n. 5, p. 2106-2112, 2005.
LAVORENTI, A. et al. Comportamento do diclosulam em amostras de um Latossolo Vermelho distroférrico sob plantio direto e convencional. R. Bras. Ci. Solo, v. 27, n. 2, p. 183-190, 2003.
MALUF, J. R. T. Nova classificação climática do Estado do Rio Grande do Sul. R. Bras. Agrometeorol., v. 8, n. 1, p. 141-150, 2000.
MEROTTO JR., A.; BREDEMEIER, C. Agricultura de precisão aplicada aos NCD de infestantes. In: VIDAL, R. et al. Nível crítico de dano de infestantes em culturas anuais. Porto Alegre: Evangraf, 2010. p. 99-121.
MUELLER-DOMBOIS, D.; ELLENBERG, H. A. Aims and methods of vegetation ecology. New York: John Wiley, 1974. 547 p.
NORDMEYER, H. et al. Patchy weed control as an approach in precison farming. In: THE EUROPEAN CONFERENCE ON PRECISION AGRICULTURE, 1., Warwick, 1997. Proceeding... Oxford: BIOS Scientific, 1997. p. 307-315.
PITELLI, R. A. Interferências de plantas daninhas em culturas agrícolas. Inf. Agropec., v. 11, n. 129, p. 16-27, 1985.
RADOSEVICH, S.; HOLT, J.; GHERSA, C. Weed ecology: implications for vegetation management. 2. ed. New York: Wiley, 1997. 589 p.
RODRIGUES, B. N.; ALMEIDA, F. S. Guia de herbicidas. 6. ed. Londrina: Grafmarke, 2011. 697 p.
SANTOS, H. G. et al. (Ed.). Sistema brasileiro de classificação de solos. 3. ed. rev. ampl. Brasília - DF Embrapa, 2013. 353 p.
SCHAFFRATH, V. R. et al. Variabilidade espacial de plantas daninhas em dois sistemas de manejo de solo.
R. Bras. Eng. Agríc. Amb., v. 11, n. 1, p. 53-60, 2007.
SHIRATSUCHI, L. S. et al. Mapeamento da distribuição espacial da infestação de Panicum maximum durante a
colheita da cultura de milho. Planta Daninha, v. 22, n. 2, p. 269-274, 2004.
SHIRATSUCHI, L. S. Mapeamento da variabilidade espacial das plantas daninhas com a utilização de ferramentas de agricultura de precisão. 2001. 96 f. Dissertação (Mestrado em Fitotecnia) – Escola Superior de Agricultura “Luiz de Queiroz”, Universidade de São Paulo, Piracicaba, 2001.
SILVA JR., M. C. et al. Weed mapping using a machine vision system. Planta Daninha, v. 30, n. 1, p. 217-227, 2012.
SOUZA, R. O.; RUEDELL, J. Levantamento populacional das principais plantas daninhas nos cultivos de verão: relatório técnico - safra 1993. Cruz Alta: Fundacep/Fecotrigo, 1993. 5 p.
TIMMERMANN, C. The economic impact of site-specific weed control. Precision Agric., v. 4, n. 3, p. 249-260, 2003.
VIDAL, R. A. et al. Glyphosate resistant biotypes of wild poinsettia (Euphorbia heterophylla (L.)) and its
risk analysis on glyphosate-tolerant soybeans. J. Food Agric. Environ., v. 5, n. 2, p. 265-269, 2007.
VOLL, E. et al. A dinâmica das plantas daninhas e práticas de manejo. Londrina: Embrapa Soja, 2005. 85 p. (Documentos Embrapa Soja, 260).
WU, H.; WALKER, S. Germination, persistence and emergence of flaxleaf fleabane (Conyza bonariensis [L.]