Natural organic matter and disinfection by-products formation potential in
conventional and advanced water treatments
Sónia M. Rosa
Faculty of Sciences and Technology, University of Algarve,
Faro, Portugal e-mail: sarosa@ualg.pt
Vânia Sousa
Faculty of Sciences and Technology, University of Algarve,
Faro, Portugal e-mail: vssousa@ualg.pt
Margarida Ribau Teixeira* Faculty of Sciences and Technology,
University of Algarve, Faro, Portugal e-mail: mribau@ualg.pt
ABSTRACT
The performance of a conventional sequence (pre-ozonation, coagulation/flocculation/sedimentation, filtration, disinfection) and two advance sequences (pre-ozonation, nanofiltration; pre-ozonation, coagulation/flocculation/sedimentation, nanofiltration) on the removal of natural organic matter (NOM) and disinfection by-products (DBPs) formation potential was evaluated. Raw and treated waters were characterized in terms of molecular weight, which includes the amount of NOM removed and the qualitative changes in the NOM characteristics (molecular weight and hydrophobicity) since they could be directly related with the DBPs formation. The results demonstrate that, for the type of raw water analysed (hydrophilic with low dissolved organic carbon content), both treatment sequences remove larger molecular weight compounds. However, the sequences with nanofiltration have a higher percentage of low molecular weight compounds removed, when compared with conventional sequence, thus the water from nanofiltration sequences will have lower DBPs formation potential.
KEYWORDS
Natural organic matter (NOM), molecular weight (MW), HPSEC, disinfection by-products (DBPs), nanofiltration (NF), conventional treatment.
INTRODUCTION
Natural organic matter (NOM) is a complex matrix of organic compounds present in natural water which affects water quality (like colour, odour and taste) and some processes of drinking water treatment [1].
*
NOM is a heterogeneous mixture with slightly water-soluble compounds, present in aquatic systems. It can be divided in hydrophobic and hydrophilic compounds, being humic substances part of hydrophobic compounds [2]. Humic substances are precursors of disinfection by-products (DBPs) in chlorination, since chlorine, widely used as a drinking water disinfectant, reacts with NOM present in raw waters. NOM size and molecular weight (MW) are important properties in drinking water treatment processes, since the size of the humic substances has been related to the formation of DBPs [1,3,4]. Many different techniques have been used to measure MW of humic substances. High-performance size-exclusion chromatography (HPSEC) is one of those techniques and has been applied by several authors [4,5,6,7]. According with Pelekani et al. [5], HPSEC provide useful information about MW of the humic substances and it is a relatively simple and inexpensive technique, which provides a rapid analysis of the water samples at different stages of treatment. Many DBPs are classified into carcinogenic or mutagenic groups and their concentrations in drinking water have been regulated in European Union, United States and by World Health Organization.
Therefore, the removal of NOM is a very important step in drinking water treatment and some treatment processes such as chemical coagulation, activated carbon adsorption and advanced oxidation processes are capable of removing NOM from water. Coagulation is effective in the removal of high MW compounds and is often used as a pre-treatment [1,8], adsorption by activated carbon removes a broad MW spectrum compounds [9,10], and advanced oxidation processes are nonspecific and are capable of oxidizing emerging contaminants and mineralizing DBPs [11,12]. However, some processes like coagulation (normally used in conventional Water Treatment Plants sequences) do not remove easily the hydrophilic fraction of the NOM, which was referred as responsible for large portion of DBPs formation (the non-humic fraction of NOM) [1]. In addition, Amy et al. [13] referred that the majority of trihalometanes (THM) precursors are present in MW fraction less than 1 kDa. NOM can also be effectively removed by membrane process, especially by ultrafiltration and nanofiltration (NF). In fact, NF has been widely studied and used to remove NOM from ground and surface water for drinking water production. NF removes NOM by a sieving mechanism (membrane retains compounds larger than the membrane pore size), electrostatic interactions (both membrane and NOM are charged) and hydrophobic interactions (between the solute and the membrane) [14,15,16,17]. NF also removes multivalent ions, and small hazardous microcontaminants from the water [18,19]. The removal of NOM and DBPs formation potential by NF membranes has been studied by some authors. Rubia et al. [7], using ten different types of water, concluded that the NOM was highly rejected by the NF membranes and high reduction of THM precursors were obtained for all water sources. They also concluded that the estimation of MW is very important to the understanding of NOM properties and water treatment process selection. Ates et al. [20] evaluated NF performance on DBPs precursors’ removal in surface water having low-to-medium dissolved organic carbon (DOC) and specific UV absorbance (SUVA). The conclusions indicate rejections above 90% of THM, but DOC and UV254nm rejections could not be directly related with DBPs
formation reductions by the tested membranes. However, Chellam et al. [21] concluded that DOC and UV254nm are excellent surrogates for aqueous DBPs for the same type of
nanofiltered water, being the NOM removal also high.
The objective of the present work is the evaluation of the NOM removals by three different treatment sequences (one conventional and two advanced) and analyse the DBPs formation potential of those sequences by HPSEC. The three sequences analysed were: conventional
sequence – pre-ozonation (O3), coagulation/flocculation/ sedimentation (C/F/S), filtration and
disinfection; and two advance sequences – O3, C/F/S and NF, and O3 and NF.
MATERIALS AND METHODS Experiment set-up
Three water treatment sequences were analysed, the conventional sequence from Alcantarilha Water Treatment Plant (WTP), and two advanced sequences: one constituted by pre-ozonation (O3) and NF and another constituted by O3, C/F/S and NF. The treatment sequences
studied are presented in Figure 1.
(1) (2) Treated water Nanofiltration Treated water Treated water Pre-ozonation Coagulation Flotation Sedimentation Filtration Chlorination
Raw water
Nanofiltration
Figure 1. Conventional treatment versus advanced treatment: different steps in water treatment. Conventional treatment constituted by O3 + C/F/S + filtration + chlorination.
Advanced treatment constituted by: (1) O3 + NF; (2) O3 + C/F/S + NF.
Alcantarilha WTP pumps its raw water (RW) from Funcho reservoir in Algarve, southern Portugal. This WTP was designed to treat up to 3 m3/s by conventional treatment (pre-ozonation, C/F/S, rapid sand filtration (Filt.) and chlorination).
NF experiments were made in a laboratory unit using a M20 plate and frame unit, from Alfa Laval (membrane area of 0.0360 m2 up to0.720 m2; maximum pressure 80 bar; maximum flow 18 L/min and constant temperature maintained by a heat exchanger). Experiments were made in recirculation mode during approximately 100 h of operation. In these runs, permeate and retentate were recycled to the feed tank. In the O3 + NF sequence, ozonated water (OW)
from Alcantarilha WTP (after pre-ozonation) was the feed water of NF and in the O3 + C/F/S + NF sequence, the feed water was decanted water (DW) of Alcantarilha WTP
(after C/F/S). Samples were analysed in the beginning and final of each sequence.
Membranes
The membrane used in permeation experiments was NF99 from Alfa Laval. In this study the membrane area was 0.0720 m2 (four flat sheet membranes). The NF99 membrane is a thin film composite NF membrane of polypiperazine amide on a polysulfone microporous support and a polyester support, with an hydraulic permeability of 8.39 kg/(h.m2.bar) at 25ºC and a molecular weight cut-off of 153 g/mol.
HPSEC analysis
The HPSEC system includes a high-pressure gradient pump (Dionex Summit), an autosampler (ASI-100), a column thermostat (STH-585), a photo diode-array detector
(PDA-100) and a chromatography interface (UCI-(PDA-100). For NOM size separation was used a TSK G3000SWXL column (30 cm x 7.8 mm ID) protected by a TSK SWXL guard column (4.0 cm x
6.0 mm ID) (Tosoh Biosciences, GmbH). TSK gel packing is silica-modified with hydrophilic diol groups and separation range 1-35 kDa (polyethylene glycol). The flow rate used was 1 mL/min, injection volume 100 µ L and analysis time was 17 minutes with UV detection at 254 nm. The mobile phase used was sodium acetate at 0.01 M (the pH was adjusted to 7.0 using acetic acid from Merck). This solution was vacuum-filtered through a 0.2 µm hydrophilic polypropylene membrane filter (Pall Corporation). Sodium polystyrene sulfonates (PSS) standards (MW of 17000, 6800 and 4300 Da (Fluka)) and acetone (58 Da (Merck)) were used as standards. All standards were prepared in chromatographic mobile phase at a concentration of 1 mg/mL. MW was calculated by a linear calibration curve (r2 > 0.99). The number-averaged (Mn) and weight-averaged (Mw) molecular weights were determined using
equations (1) and (2) proposed by Yau et al. [22].
i=1∑ hi Mi n ∑ i=1 n hi = Mn i=1∑ hi Mi n ∑ i=1 n hi = Mn ∑ hi Mi hi Mi n ∑ i=1 n hi ∑ i=1 n ∑ i=1 n hi = Mn== Mn (1) ∑ i=1 n hi ∑ hiMi i=1 n = Mw ∑ i=1 n hi ∑ i=1 n ∑ i=1 n hi ∑ hiMi i=1 n ∑ hiMi i=1 n = Mw== Mw (2)
where hi is the height of the curve eluted at the ith retention time (Rti) and Mi is the molecular
weight of some solute at the ith retention time (Rti). The ratio Mw/Mn corresponds to the
polydispersivity (ρ) of the sample and is a measure of the sample heterogeneity (ρ = 1 for homogeneous polymers) [5].
Analytical methods
Several analytical methods were used to characterised NOM, namely dissolved organic carbon (DOC), UV absorbance at 254nm (UV254nm) and specific UV absorbance (SUVA =
UV254nm / DOC). SUVA indicates the relative aromaticity of DOC. High SUVA waters are
generally enriched in hydrophobic NOM, such as humic substances. Therefore, SUVA indicates aromatic compounds in the DOC and can be used to estimate the chemical nature of the DOC [23]. Water industry also uses SUVA as a surrogate parameter to monitor DBPs precursors [24].
All samples were filtered through a pre-rinsed 0.45 µm polycarbonate membrane filter (Aquatron CA, 30 mm) and analysed in the same day or, if not possible, the day after collection. Samples were cooled at 4 ºC.
The concentration of DOC was measured using Shimadzu TOC-5000A analyzer, which was calibrated with potassium hydrogen phthalate standards at concentrations that ranged 1-10 mg of C/L. UV absorption was acquired at 254 nm with a Beckman DU 640B spectrophotometer, in a 1 cm quartz cuvette. Samples were also analysed for pH (at 20°C, using a Crison pH-Meter BASIC 20+), conductivity (Crison GLP 32 conductimeter), and turbidity (HACH 2100N Turbidimeter) using standard methods of analysis [25].
RESULTS AND DISCUSSION
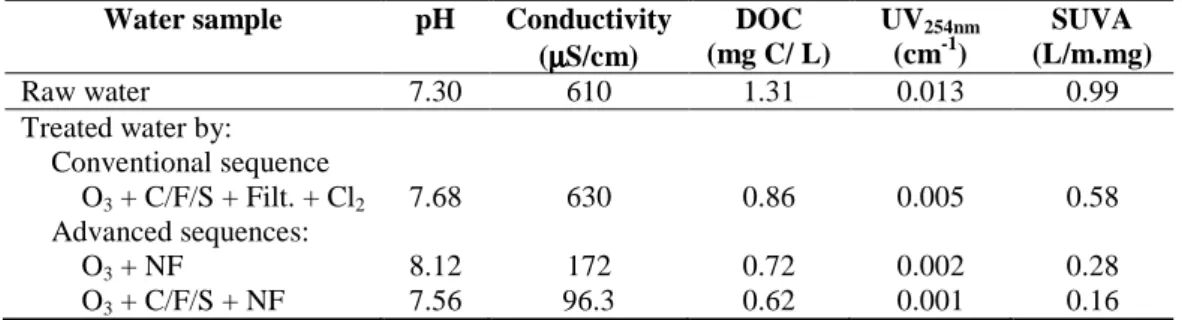
Table 1 summarizes water quality parameters for the raw and treated waters.
Table 1. Water quality parameters for raw and treated waters analysed.
Water sample pH Conductivity
(µµµµS/cm) DOC (mg C/ L) UV254nm (cm-1) SUVA (L/m.mg) Raw water 7.30 610 1.31 0.013 0.99 Treated water by:
Conventional sequence
O3 + C/F/S + Filt. + Cl2 7.68 630 0.86 0.005 0.58
Advanced sequences:
O3 + NF 8.12 172 0.72 0.002 0.28
O3 + C/F/S + NF 7.56 96.3 0.62 0.001 0.16
Table 1 indicates the characteristics of the typical raw water from Alcantarilha WTP, during the period analysed (2008). This water is a hard water, largely composed of non-humic materials (SUVA value is less than 2-3 L/(m.mg)), the organic matter is relatively hydrophilic, less aromatic, and of a lower molecular weight compared to waters with higher SUVA values [26]. This water should be more difficult to treat by coagulation than hydrophobic waters, since coagulation preferentially removes hydrophobic compounds and the hydrophilic fraction is considered least amenable to remove by coagulation [4, 20,27]. In addition, the DBPs formation is normally correlated with the high DOC concentration and high SUVA values (> 3 L/(m.mg) [26]), despite Rubia et al. [7] obtained that lower SUVA waters show a great DBPs formation potential reactivity and Fabris et al. [27] concluded that further improvement in DBP reduction requires treatments that target the removal of LMW compounds.
All treatment sequences reduced the DOC content to values below 1 mg C/L and the UV254nm
values, from which minimal DBPs formation potential may be expected [28]. However, as expected, sequences with NF are more efficient than the conventional sequence for the removal of NOM parameters. Coagulation is more effective for the removal of high SUVA waters due to their hydrophobicity and aromaticity (this fraction has the majority of the charged carboxylic acids). Therefore, the NOM of the studied low SUVA water is preferentially removed by membrane. Differences in NOM parameters of the treated waters between the two advanced sequences are attributed to the fouling associated to NF operation time (≅ 100 h). However, these differences are not significant because of the low UV254nm and
SUVA values of the treated waters when both sequences (conventional and advanced) are compared.
The fractionation of NOM by HPSEC into different fractions allows NOM characterization of natural water, which is important in water monitoring, not only to determine the effectiveness of the treatment process, but also to analyse their effect on treatment and disinfection.
MWs were classified into three different groups based on their sizes: low MW (LMW), intermediate MW (IMW) and high MW (HMW). These MWs are associated with the peaks presented in the chromatograms obtained by HPSEC. Peaks I and II represent high MW compounds, peak III represents intermediate MW, and IV, V and VI represent low MW compounds. The sizes that define the different types of MW are presented in Table 2.
Table 2. Classes of molecular weight distribution.
Size Limits (MW in PSS equivalents) Peaks
HMW HMW≥1000 I and II
IMW 1000<IMW<350 III
LMW LMW≤350 IV, V and IV
The MW distribution of the raw and treated waters of the three sequences is compared in Figure 2. The weight average (Mw) and the number average (Mn) molecular weights of treated
waters are presented in Table 3.
(a) (b) 0 200 400 600 800 1000 1200 1400 1600 1800 I II III IV V VI M W ( g /m o l) O3+C/F/S+Filt+Cl2 O3 + NF O3 + C/F/S + NF HMW IMW LMW 0 10 20 30 40 50 60 70 80 I II III IV V VI R el at iv e ar ea ( % ) O3+C/F/S+Filt+Cl2 O3 + NF O3 + C/F/S + NF HMW IMW LMW 0 10 20 30 40 50 60 70 80 I II III IV V VI R el at iv e ar ea ( % ) HMW IMW LMW 0 200 400 600 800 1000 1200 1400 1600 1800 I II III IV V VI M W ( g /m o l) HMW IMW LMW
Figure 2. Molecular weight distribution and relative area for: (a) raw water, and (b) treated waters by conventional sequence (O3 + C/F/S + Filt + Cl2) and advanced sequences (O3 + NF
and O3 + C/F/S + NF).
Table 3. Weight average (Mw) and the number average (Mn) molecular weights and
polydispersity(ρ) of the treated waters.
NOM fractions
Conventional treatment Advanced treatment
O3 + NF O3 + C/F/S + NF Mw Mn ρρρρ Mw Mn ρρρρ Mw Mn ρρρρ HMW I 1649 1636 1.01 - - - - II 1127 1109 1.02 1091 1078 1.01 1321 1255 1.05 IMW III 648 625 1.04 657 634 1.04 641 623 1.03 IV 338 333 1.02 337 328 1.03 327 316 1.04 LMW V 221 220 1.00 212 211 1.01 215 214 1.00 VI 182 181 1.01 170 170 1.00 177 176 1.01
The MW is higher in raw water than in treated waters, despite the sequence used (Figure 2). Raw water has molecular size fractions of HMW (Figure 2a), whereas in treated waters HMW fractions are undetectable or in small amounts (Figure 2b, Table 3). Treated waters have the dominant fractions in the smaller molecular size fractions (IV, V and VI, Figure 2b). The small polydispersity indicates high NOM homogeneity in the samples analysed (Table 3).
These results indicate that conventional and advanced treatments remove large molecules, and the smaller molecules, the more hydrophilic, are less retained. However, between conventional and advanced sequences there are important differences: in the conventional sequence the largest molecular size fractions (I) is present in treated water and the relative area of the IMW factions (III) are higher, whereas in advanced sequences LMW compounds (IV, V and VI) have the highest relative area in treated water (Figure 2b). Conventional treatment is not capable of removing so well such IMW compounds and the relatively amount of LMW compounds is lower than in treated water of advanced sequences. Most of the HMW compounds are removed by coagulation as already referred [20,27]. Membrane filtration improved the removal of all fractions. The relative area of hydrophilic compounds is higher in treated water compared with the hydrophobic compounds. This means that membrane filtration is more efficient in removing the HMW and IMW compounds than the conventional sequence, despite the hydrophilic fraction of NOM be less rejected than the hydrophobic fraction and less influenced on permeate flux [29,30]. It is common to associate the increase in negative charge and the increase of hydrophilicity with the decrease of adsorptive fouling by NOM [14,29,30]. NF rejects NOM by a combination of size exclusion and physical-chemical interactions as electrostatic repulsion and adsorption [31,32]. In addition, the low membrane cut-off (153 g/mol) indicates that the amount of the LMW should be very low. This can be seen by the SUVA values of the treated water (Table 1). In fact, the very low SUVA values of the treated waters from advanced sequences compared with the values of conventional sequence (0.28 and 0.16 L/(m.mg) vs. 0.58 L/(m.mg), Table 1), with high removal efficiencies, indicate that for these sequences the DBPs formation is minimised. Similar results were obtained by Rubia et al. [7].
Comparing advanced sequences, there are no significant differences, since both sequences have higher amount of LMW compounds (Figure 3). However, O3 + NF sequence has a
higher relative amount of peak IV, which could be attributed to the time of operation of the NF (≅ 100 h). The permeation flux of the sequence O3 + NF had a decrease during the time of
operation, being the permeation flux of the O3 + C/F/S + NF almost constant during this
period (data not shown). The permeate quality (treated water) slightly reflects this small difference in both advanced sequences (Table 1).
Fabris et al. [27] analysed the correlations between the MW and the THM formation. They concluded that a correlation exists between the HMW humics and the THM formation, and after coagulation the correlation shift to the LMW molecules that are less effectively removed by coagulation. Based on these conclusions, conventional treatment removed the HMW fractions (Figure 2b), then the DBPs formation is also reduced by this treatment. However, using NF, the DBPs formation potential is less than in conventional treatment, since the HMW and IMW fractions were significantly reduced. Rubia et al. [7] concluded that the reactive NOM for THM formation was still included in the NF permeate in their experiments and appropriate membrane selection and operating conditions for DBPs reduction is important.
CONCLUSIONS
The results demonstrate that, for the type of raw water analysed (hydrophilic with low DOC content), both treatment sequences (conventional and advanced) remove higher MW compounds. However, the sequences with NF have a higher percentage of low MW compounds in treated water, when compared with the treated water from conventional sequence. As high MW compounds are very important DBPs precursors, the water from NF sequences will have lower DBPs formation potential, because of membrane cut-off and electrostatic interactions between the membrane and the NOM. In addition, the determination of the MW is very important since it leads to the understanding of the physical and chemical properties of NOM and the selection of the adequate treatment process.
ACKNOWLEDGEMENT
This research was funded by Portuguese Science and Technology Foundation (FCT), project nº PTDC/ECM/68323/2006. The authors would like to thank Diogo Rosa for the analysis of some water samples by HPSEC.
REFERENCES
1. Owen, D.M., Amy, G.L., Chowdhury, Z.K., Paode, R., McCoy, G., Viscosil, K., NOM characterization and treatability, J. Am. Water Works Assoc., Vol. 87, pp 46-63, 1995. 2. Stumm, W., Chemistry of the Solid-Water Interface, Wiley Interscience, New York, 1992. 3. El-Rehaili, A.M.; Weber, Jr, W.J., Correlation of humic substance trihalomethane
formation potential and adsorption behaviour to molecular weight distribution in raw and chemically treated waters, Water Res., Vol. 21, No 5, pp 573-582, 1987.
4. Nissinen, T.K., Miettinen, I.T., Martikainen, P.J., Vartiainen, T., Molecular size distribution of natural organic matter in raw and drinking waters, Chemosphere, Vol. No 45, pp 865-873, 2001.
5. Pelekani, C, Newcombe, G, Snoeyink, V, Hepplewhite, C, Assemi, S, Beckett, R. Characterization of natural organic matter using high performance size exclusion chromatography, Environ. Sci. Technol., Vol. 33, pp 2807–2813, 1999.
6. Bolea, E., Girriz, M.P., Bouby, M., Laborda, F., Castillo, J.R., Geckeis, H., Multielement characterization of metal-humic substances complexation by size exclusion chromatography, asymmetrical flow field-flow fraction, ultrafiltration and inductively coupled plasma-mass spectrometry detection: A comparative approach, J. Chrom. A, Vol. 1129, pp 236-246, 2006.
7. Rubia, A., Rodríguez, M., León, V.M., Prats, D., Removal of natural organic matter and THM formation potential by ultra- and nanofiltration of surface waters, Water Res., Vol. 42, pp 714-722, 2008.
8. Vickers, J.C., Thompson, M.A., Kellar, U.G., The use of membrane filtration with coagulation processes for improved NOM removal, Desalination, Vol. 102, pp 57-61, 1995.
9. Kilduff, J.E., Karanfil, T., Chin, Y.,-P., Weber, Jr, W.J., Adsorption of natural organic polyelectrolytes by activated carbon: A size-exclusion chromatography study, Environ.
Sci. Technol., Vol. 30, No 4, pp 1336-1343, 1996.
10. Matilainen, A., Vieno, N., Tuhkanen, T., Efficiency of the activated carbon filtration in the natural organic matter removal, Environ. Inter., Vol. 32, No 3, pp 324-331, 2006.
11. Murray, C.A., Parsons, S.A., Removal of NOM from drinking water: Fenton’s and photo-Fenton’s processes, Chemosphere, Vol. 54, No 7, pp 1017-1023, 2004.
12. Katsumata, H., Sada, M., Kaneco, S., Suzuki, T., Ohta, K., Yobiko, Y., Humic acid degradation in aqueous solution by the photo-Fenton process, Chem. Eng. J., Vol. 137, pp 225-230, 2008.
13. Amy, G.L., Alleman, B.C., Cluff, C.B., Removal of dissolved organic matter by nanofiltration, J. Environ. Eng., Vol. 116, pp 200-205, 1990.
14. Hong, S., Elimelech, M., Chemical and physical aspects of natural organic matter (NOM) fouling of nanofiltration membranes, J. Membr. Sci., Vol. 132, pp 159-181, 1997.
15. Bellona, C., Drewes J.E., Amy, G., Factors affecting the rejection of organic solutes during NF/RO treatment - a literature review, Water Res., Vol. 38, pp 2795-2809, 2004. 16. Van der Bruggen, B., Schaep, J., Wilms, D. and Vandecasteele, C., Influence of molecular
size, polarity and charge on the retention of organic molecules by nanofiltration, J.
Membr. Sci., Vol. 156, pp 29-41, 1999.
17. Ribau Teixeira M., Rosa M.J., The impact of the water background matrix on the natural organic matter removal by nanofiltration, J. Membr. Sci., Vol. 279, pp 513-520, 2005. 18. Childress, A.E., Elimelech, M., Effect of solution chemistry on the surface charge of
polymeric reverse osmosis and nanofiltration membranes, J. Membr. Sci., Vol. 119, pp 253-268, 1996.
19. Jacangelo, J.G., DeMarco, J., Owen, D.M., Randtke, S.J., Selected processes for removing NOM: an overview, J. Am. Water Works Assoc., Vol. 87, pp 64-77, 1995.
20. Ates, N., Yilmaz, L., Kitis, M., Yetis, U., Removal of disinfection by-products precursors by UF and NF membranes in low-SUVA waters, J. Membr. Sci., Vol. 328, pp 104-112, 2009.
21. Chellam, S., Sharma, R.R., Shetty, G.R., Wei, Y., Nanofiltration of pretreated Lake Houston water: Disinfection by-products speciation, relationships, and control, Sep. and
Purif. Technol., Vol. 64, pp 160-16, 2008.
22. Yau, W.W., Kirkland, J.J., Bly, D.D., Modern size exclusion chromatography, Wiley Interscience, New York, 1979.
23. Leenheer, J.A., Croué, J.P., Characterizing aquatic dissolved organic matter, Environ. Sci.
Technol., Vol. 37, No 1, pp 18A-26A, 2003.
24. Crué, J.P., Korshin, G.V., Benjamin, M., Characterization of natural organic matter in
drinking water, American Water Works Association Research Foundation, Denver, 2000.
25. Clesceri, L.S., Greenberg A.E., Eaton, A.D., Standard Methods for the Examination of
Water and Wastewater, American Public Health Association, American Water Works
Association and Water Environment Federation, Washington, DC, 1998.
26. Edzwald, J.K., Van Benschoten, J.B., Aluminium coagulation of natural organic matter.
Chemical Water and Wastewater Treatment, Springer-Verlag, H.H. Hahn and R. Klute
(Eds.), Berlin, Vol. 90, pp 341-359, 1990.
27. Fabris, R., Chow, C.W.K., Drikas, M., Eikebrokk, B., Comparison of NOM character in selected Australian and Norwegian drinking waters, Water Res., Vol. 42, pp 4188-4169, 2008.
28. EPA, in Office of Water (4607), EPA 814-R-99-01299, United States Environmental Protection Agency, 1999.
29. Nilson, J., DiGiano, F.A., Influence of NOM composition on nanofiltration, J. Am. Water
Works Assoc., Vol. 88, No 5, pp 53-66, 1996.
30. Jucker, C., Clark, M.M., Adsorption of aquatic humic substances on hydrophobic ultrafiltration membranes, J. Membr. Sci., Vol. 97, pp 37-52, 1994.
31. Cho, J., Amy, G., Pellegrino, J., Membrane filtration of natural organic matter: initial comparison of rejection and flux decline characteristics with ultrafiltration and
nanofiltration membranes, Wat. Res., Vol 33, No 11, pp 2517-2526, 1999.
32. Amy, G., Cho, J., Interactions between natural organic matter (NOM) and membranes: rejection and fouling, Water Sci. Tech., Vol. 40, No 9, pp 131-139, 1999.